

The DOI matches its Crossref record; 45 of the 47 references it cites were found in a registry or an index.
Inhibitory Effect of mTOR Activator MHY1485 on Autophagy: Suppression of Lysosomal Fusion
Open accessAbstract
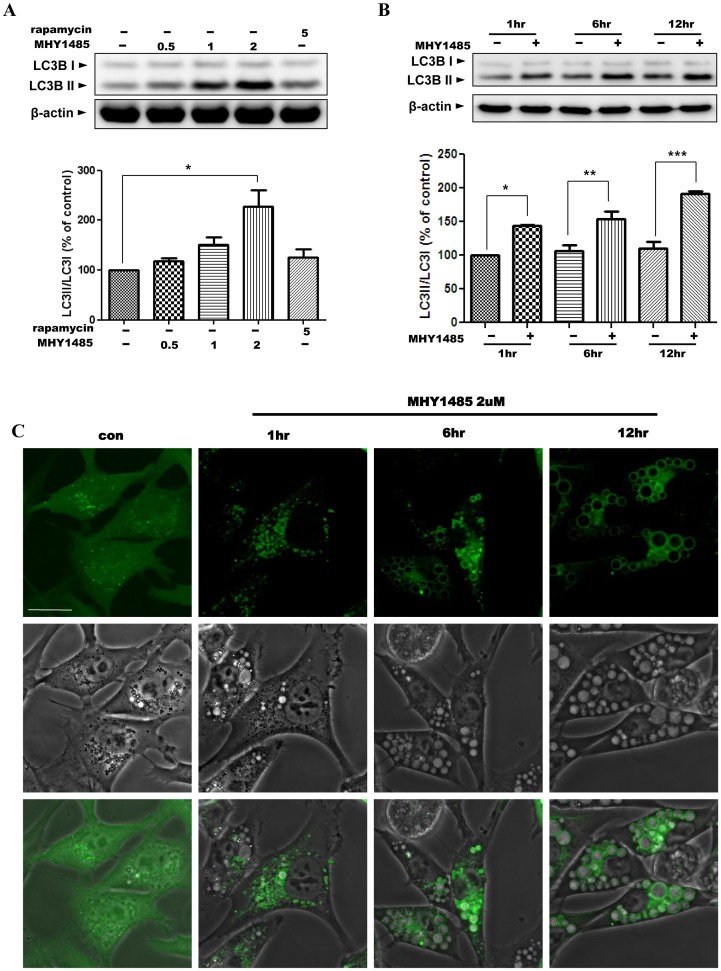
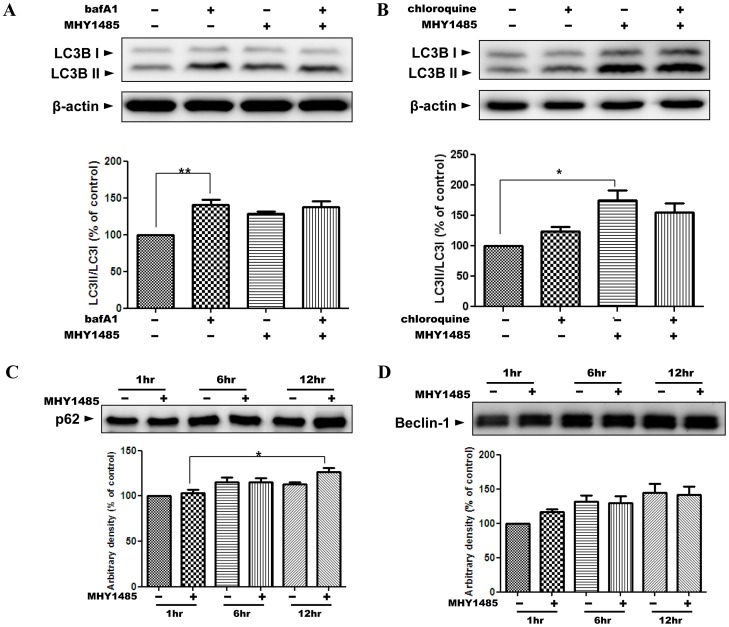
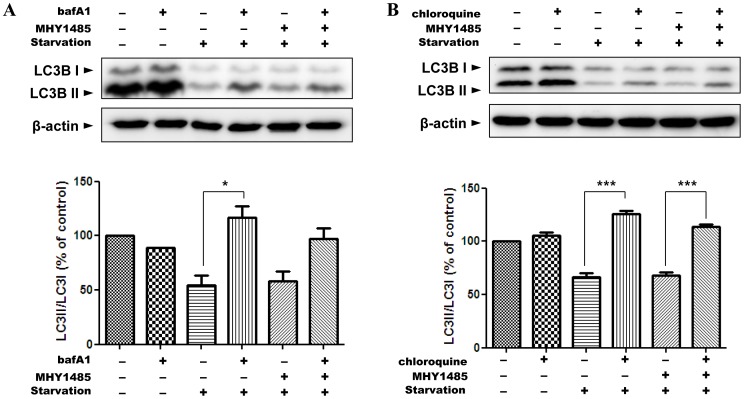
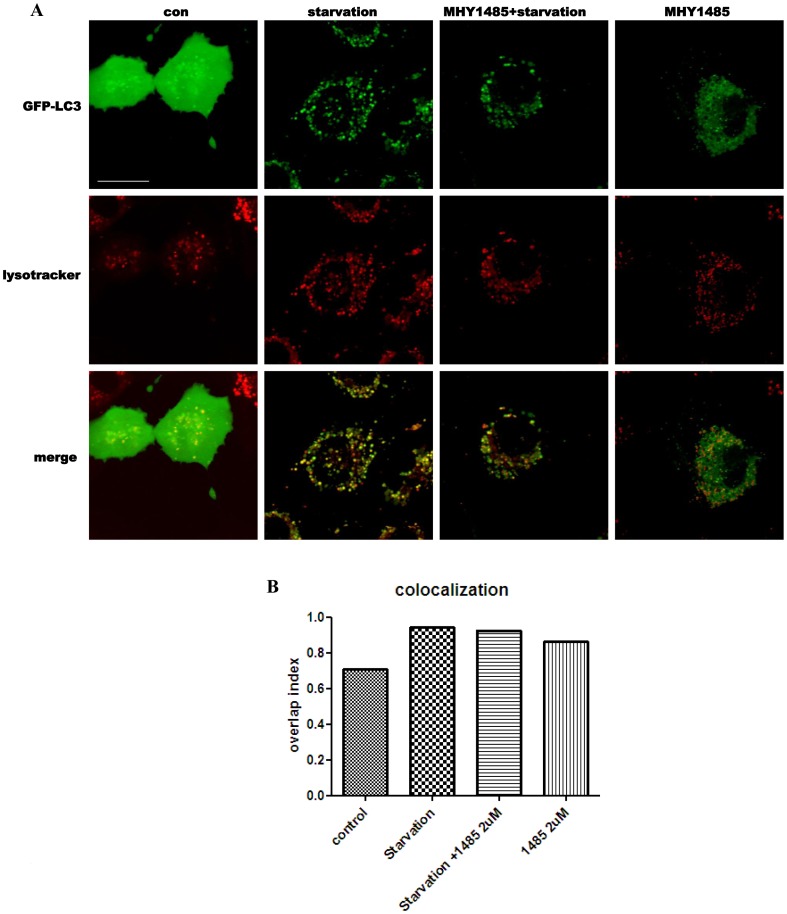
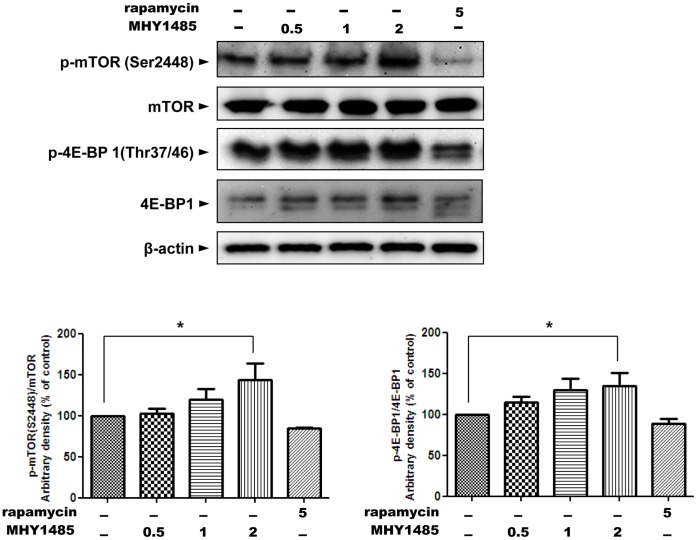
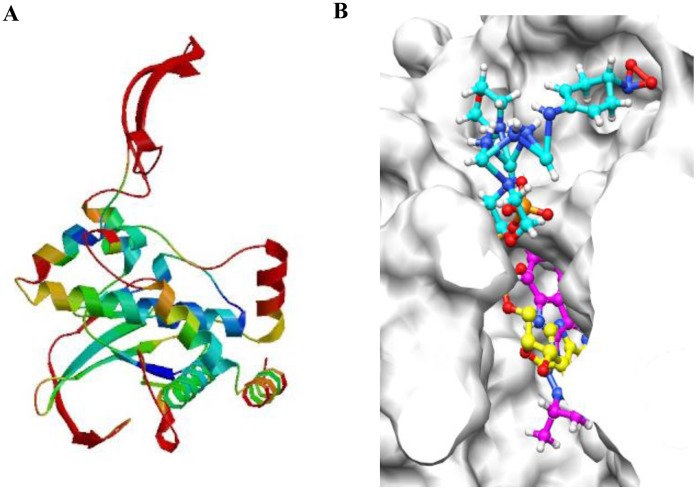
Autophagy is a major degradative process responsible for the disposal of cytoplasmic proteins and dysfunctional organelles via the lysosomal pathway. During the autophagic process, cells form double-membraned vesicles called autophagosomes that sequester disposable materials in the cytoplasm and finally fuse with lysosomes. In the present study, we investigated the inhibition of autophagy by a synthesized compound, MHY1485, in a culture system by using Ac2F rat hepatocytes. Autophagic flux was measured to evaluate the autophagic activity. Autophagosomes were visualized in Ac2F cells transfected with AdGFP-LC3 by live-cell confocal microscopy. In addition, activity of mTOR, a major regulatory protein of autophagy, was assessed by western blot and docking simulation using AutoDock 4.2. In the result, treatment with MHY1485 suppressed the basal autophagic flux, and this inhibitory effect was clearly confirmed in cells under starvation, a strong physiological inducer of autophagy. The levels of p62 and beclin-1 did not show significant change after treatment with MHY1485. Decreased co-localization of autophagosomes and lysosomes in confocal microscopic images revealed the inhibitory effect of MHY1485 on lysosomal fusion during starvation-induced autophagy. These effects of MHY1485 led to the accumulation of LC3II and enlargement of the autophagosomes in a dose- and time-dependent manner. Furthermore, MHY1485 induced mTOR activation and correspondingly showed a higher docking score than PP242, a well-known ATP-competitive mTOR inhibitor, in docking simulation. In conclusion, MHY1485 has an inhibitory effect on the autophagic process by inhibition of fusion between autophagosomes and lysosomes leading to the accumulation of LC3II protein and enlarged autophagosomes. MHY1485 also induces mTOR activity, providing a possibility for another regulatory mechanism of autophagy by the MHY compound. The significance of this study is the finding of a novel inhibitor of autophagy with an mTOR activating effect.
Overview
The claims and statistics of this paper haven’t been checked yet.
Run the check — free, no account needed. It reads the open-access text and checks the sources it cites.
Integrity signals
Registry
Cites
Statistics
Figures

Verification
Claims the paper makes
The claims and statistics of this paper haven’t been checked yet.
Run the check — free, no account needed. It reads the open-access text and checks the sources it cites.
Claims other papers make about this one
Each is checked against this paper’s own text: does it say what the citing paper says it does?
The source backs part of the claim, not all of it — or backs it for a different population, condition or comparison.
In the citing paper
“There are also data showing mTORC1 signaling may disrupt autophagy, which in turn may affect mitochondrial remodeling (Choi et al., 2012).”
From Skeletal Muscle Ribosome and Mitochondrial Biogenesis in Response to Different Exercise Training Modalities (2021) · cites this paper as Choi et al., 2012
Experimental — accuracy not yet measured
Self-check
Percentages, sums and reported differences re-computed from the paper’s own numbers.
The self-check needs the paper’s full text.
Citations
Cites
The SWISS-MODEL workspace: a web-based environment for protein structure homology modelling
Arnold, K., Bordoli, L., Kopp, J., & Schwede, T. F. (2005) · Bioinformatics · doi:10.1093/bioinformatics/bti770 · Cited by 7,031
Methods in Mammalian Autophagy Research
Mizushima, N., Yoshimori, T., & Levine, B. (2010) · Cell · doi:10.1016/j.cell.2010.01.028 · Cited by 4,497
mTOR: from growth signal integration to cancer, diabetes and ageing
Zoncu, R., Efeyan, A., & Sabatini, D. M. (2011) · Nature Reviews Molecular Cell Biology · doi:10.1038/nrm3025 · Cited by 3,941
Regulation mechanisms and signaling pathways of autophagy
He, C., & Klionsky, D. J. (2009) · Annual Review of Genetics · doi:10.1146/annurev-genet-102808-114910 · Cited by 3,609
How to Interpret LC3 Immunoblotting
Mizushima, N., & Yoshimori, T. (2007) · Autophagy · doi:10.4161/auto.4600 · Cited by 2,595 · cited 1×
“[9], [10], [11].”
Sancak, Y., Bar-Peled, L., Zoncu, R., Markhard, A. L., Nada, S., & Sabatini, D. M. (2010) · Cell · doi:10.1016/j.cell.2010.02.024 · Cited by 2,464 · cited 1×
“The recent identification of mTOR localization at the lysosomal membrane when it is activated [41], [42] and the several reports that morpholino triazine analogs can easily bind mTOR [43], [44] led us to the question about the effect of MHY1485 on the activity of mTOR.”
BackgroundEaten alive: a history of macroautophagy
Yang, Z., & Klionsky, D. J. (2010) · Nature Cell Biology · doi:10.1038/ncb0910-814 · Cited by 2,155
Yoshimori, T., Yamamoto, A., Moriyama, Y., Futai, M., & Tashiro, Y. (1991) · Journal of Biological Chemistry · doi:10.1016/s0021-9258(19)47429-2 · Cited by 1,334
The Role of Autophagy in Cancer: Therapeutic Implications
Yang, Z. J., Chee, C. E., Huang, S., & Sinicrope, F. A. (2011) · Molecular Cancer Therapeutics · doi:10.1158/1535-7163.mct-11-0047 · Cited by 1,243
Active-Site Inhibitors of mTOR Target Rapamycin-Resistant Outputs of mTORC1 and mTORC2
Feldman, M. E., Apsel, B., Uotila, A., Loewith, R., Knight, Z. A., Ruggero, D., & Shokat, K. M. (2009) · PLoS Biology · doi:10.1371/journal.pbio.1000038 · Cited by 1,111
Research works printed but not linked: 1
- [21]Tanida I, Waguri S (2010) Measurement of autophagy in cells and tissues. Methods in molecular biology 648: 193– 214. 20700714
Cited by
Sorted by citations
Items 101–192 of 192
Chen, Q., Zhou, S. Y., Qu, M., Yang, Y., Chen, Q., Meng, X., & Fan, H. (2024) · The Plant Journal · doi:10.1111/tpj.16766 · Cited by 11
The role of TOR in response to chilling stress in the Solanum lycopersicum L
Yang, Z., Zhang, Y., Ding, Q., Xing, H., Wang, H., Meng, X., Fan, H., Yu, Y., & Cui, N. (2024) · Plant Growth Regulation · doi:10.1007/s10725-024-01263-6 · Cited by 11
MHY1485 enhances X-irradiation-induced apoptosis and senescence in tumor cells
Sun, L., Morikawa, K., Sogo, Y., & Sugiura, Y. (2021) · Journal of Radiation Research · doi:10.1093/jrr/rrab057 · Cited by 11
Chemical tools for modulating autophagy
Triola, G. (2014) · Tetrahedron · doi:10.1016/j.tet.2014.10.057 · Cited by 11
Significance of low mTORC1 activity in defining the characteristics of brain tumor stem cells
Han, Y., Enomoto, A., Shiraki, Y., Wang, S.-Q., Wang, X., Toyokuni, S., Asai, N., Ushida, K., Ara, H., Ohka, F., et al. (2016) · Neuro-Oncology · doi:10.1093/neuonc/now237 · Cited by 11
Ma, L., Song, T., Yu, Y., Liu, L., Qu, M., Zhou, S. Y., Meng, X., & Fan, H. (2023) · Physiologia Plantarum · doi:10.1111/ppl.14124 · Cited by 10
Mikdache, A., Boueid, M., van der Spek, L., Lesport, E., Delespierre, B., Loisel‐Duwattez, J., Degerny, C., & Tawk, M. (2021) · Scientific Reports · doi:10.1038/s41598-021-92758-z · Cited by 10
Bisarò, B., Sciortino, M., Colombo, S., Leal, M. D. P. C., Costamagna, A., Castellano, I., Montemurro, F., Rossi, V., Valabrega, G., Turco, E., et al. (2015) · Oncotarget · doi:10.18632/oncotarget.6710 · Cited by 10
Huang, C., Chen, X., Wu, D., Chen, J., Wang, J., Li, S., Hu, J., Yan, Z., Zhu, Y., & Zhang, Y. (2025) · International Journal of Biological Macromolecules · doi:10.1016/j.ijbiomac.2025.147928 · Cited by 9
Ailanthone induces autophagy and ferroptosis in non‑small cell lung cancer Lewis cells
Yang, H., Zhang, X., Lu, Y., Wang, X., Zhang, Z., Xu, H., Li, F., Chen, Q., Bai, Y., Bai, X., et al. (2024) · Molecular and Clinical Oncology · doi:10.3892/mco.2024.2723 · Cited by 9
Anorexic response to rapamycin does not appear to involve a central mechanism
Toklu, H. Z., Bruce, E. B., Sakarya, Y., Carter, C. S., Morgan, D., Matheny, M. K., Kirichenko, N., Scarpace, P. J., & Tümer, N. (2016) · Clinical and Experimental Pharmacology and Physiology · doi:10.1111/1440-1681.12601 · Cited by 9
MHY1485 ameliorates UV-induced skin cell damages via activating mTOR-Nrf2 signaling
Yang, B., Xu, Q., Guo, C., Huang, J., Wang, S., Li, Y., Tu, Y., He, L., Zhi-gang, B., Ji, C., et al. (2016) · Oncotarget · doi:10.18632/oncotarget.14299 · Cited by 9
Redirecting Vesicular Transport to Improve Nonviral Delivery of Molecular Cargo
Mao, M., Chang, C., Pickar‐Oliver, A., Cervia, L. D., Wang, L., Ji, J., Liton, P. B., Gersbach, C. A., & Yuan, F. (2020) · Advanced Biosystems · doi:10.1002/adbi.202000059 · Cited by 9
Reversible inhibition of the blood-testis barrier protein improves stem cell homing in mouse testes
Kanatsu‐Shinohara, M., Morimoto, H., Watanabe, S., & Shinohara, T. (2018) · Journal of Reproduction and Development · doi:10.1262/jrd.2018-093 · Cited by 9
Resveratrol promotes autophagosome elimination via SIRT1 in cardiomyocytes
Kuno, A., Hosoda, R., Saga, Y., Iwahara, N., Tatekoshi, Y., Numazawa, R., & Horio, Y. (2024) · Journal of Pharmacological Sciences · doi:10.1016/j.jphs.2024.11.006 · Cited by 9
Yanagaki, M., Shirai, Y., Shimada, Y., Hamura, R., Taniai, T., Horiuchi, T., Takada, N., Haruki, K., Furukawa, K., Uwagawa, T., et al. (2022) · Carcinogenesis · doi:10.1093/carcin/bgac060 · Cited by 8
Mann, G., & Adegoke, O. A. J. (2024) · Journal of Nutritional Science · doi:10.1017/jns.2024.66 · Cited by 9
Weng, W.-W., Hong, J., Owusu-Ansah, K. G., Chen, B., Zheng, S., & Jiang, D. (2022) · Heliyon · doi:10.1016/j.heliyon.2022.e12064 · Cited by 8
The Polyphenolic Compound Curcumin Conjugation with an Alkyne Moiety in the Process of Autophagy
Yan, P., Sun, X., Chen, X., Chen, Y., Wang, X., Su, D., Zhou, H., Gao, L., Lu, L., Wang, J., et al. (2018) · The American Journal of Chinese Medicine · doi:10.1142/s0192415x18500350 · Cited by 7
Drosen, M. E., Bulbule, S. R., Gottschalk, G., Peterson, D. L., Allen, L. A., Arnold, L. A., & Roy, A. (2025) · Immunologic Research · doi:10.1007/s12026-024-09557-7 · Cited by 7
Relić, B., Charlier, E., Deroyer, C., Malaise, O., Crine, Y., Neuville, S., Gillet, P., de Seny, D., & Malaise, M. (2018) · Oncotarget · doi:10.18632/oncotarget.26295 · Cited by 8
Multi-Omics Approach Reveals Genes and Pathways Affected in Miller-Dieker Syndrome
Mahendran, G., Breger, K., McCown, P. J., Hulewicz, J. P., Bhandari, T., Addepalli, B., & Brown, J. A. (2024) · Molecular Neurobiology · doi:10.1007/s12035-024-04532-7 · Cited by 6
Towards Enhancing Therapeutic Glycoprotein Bioproduction: Interventions in the PI3K/AKT/mTOR Pathway
Mahameed, M., Sulieman, A., Alkam, D., & Tirosh, B. (2019) · Cell Structure and Function · doi:10.1247/csf.19013 · Cited by 6
Wu, Q., Fan, C., Liu, K., & Tang, J. (2024) · Experimental and Therapeutic Medicine · doi:10.3892/etm.2024.12540 · Cited by 6
Herold, N. K., Gutsfeld, S., Leuthold, D., Wray, C., Spath, J., & Tal, T. L. (2025) · NeuroToxicology · doi:10.1016/j.neuro.2025.05.001 · Cited by 5
Identification of Anhydrodebromoaplysiatoxin as a Dichotomic Autophagy Inhibitor
Feng, L., Lu, C., Wu, J., Chan, L. L., & Yue, J. (2023) · Marine Drugs · doi:10.3390/md21010046 · Cited by 5
Yang, Z., Guo, D., Zhao, J., Li, J., Zhang, R., Zhang, Y., Xu, C., Ke, T., & Wang, Q. K. (2023) · Arteriosclerosis Thrombosis and Vascular Biology · doi:10.1161/atvbaha.123.318818 · Cited by 5
Fang, K., Li, H.-F., Hsieh, C.-H., Li, D., Song, D.-C., Cheng, W.-T., & Guo, Z.-X. (2013) · Apoptosis · doi:10.1007/s10495-013-0809-7 · Cited by 5
Zhao, Z., Wu, Z., Ding, G., Fang, Z., Chen, M., Liu, Y., Du, J., Li, Y., Mai, K., & Ai, Q. (2025) · Aquaculture · doi:10.1016/j.aquaculture.2025.743226 · Cited by 4
DBT is a metabolic switch for maintenance of proteostasis under proteasomal impairment
Hwang, R., Lu, Y., Tang, Q., Periz, G., Park, G., Li, X., Xiang, Q., Liu, Y., Zhang, T., & Wang, J. (2023) · eLife · doi:10.7554/elife.91002 · Cited by 4
Effect of mTORC Agonism via MHY1485 with and without Rapamycin on C2C12 Myotube Metabolism
Cook, N. E., McGovern, M. R., Zaman, T., Lundin, P. M., & Vaughan, R. A. (2024) · International Journal of Molecular Sciences · doi:10.3390/ijms25136819 · Cited by 6
Mechanometabolism instructs hematopoietic stem cell specification
Horton, P. D., Syed, A., Winkler, M., Vaidya, A. B., Rariden, M., Arora, N., Zhou, Y., Kobayashi, M., Yoshimoto, M., Lee, H. J., et al. (2025) · The Journal of Experimental Medicine · doi:10.1084/jem.20250607 · Cited by 3
Ko, J. H., & Oh, J. Y. (2023) · Cytotherapy · doi:10.1016/j.jcyt.2023.03.013 · Cited by 3
Reversing an agonist into an inhibitor: Development of mTOR degraders
Zhu, L., Fu, S., Ma, L., Chen, Z., Zeng, Q., Li, R., Zhou, Y., Qian, H., Meng, X., & Ge, J. (2025) · European Journal of Medicinal Chemistry · doi:10.1016/j.ejmech.2025.117774 · Cited by 3
MHY1485 potentiates immunogenic cell death induction and anti-cancer immunity following irradiation
Sun, L., Morikawa, K., Sogo, Y., & Sugiura, Y. (2024) · Journal of Radiation Research · doi:10.1093/jrr/rrad107 · Cited by 3
Ribeiro, G. F., de Góes, C. G., Onorio, D. S., de Campos, C. B. L., & Morais, F. V. (2018) · PLoS ONE · doi:10.1371/journal.pone.0202529 · Cited by 3
Liu, M., & He, L. (2024) · Cellular and Molecular Life Sciences · doi:10.1007/s00018-024-05226-y · Cited by 2
Wang, X., Yu, H., Li, X., Tian, R., Xu, C., Li, T., Fei, J., Du, X., & Yin, Z. (2024) · Reproduction · doi:10.1530/rep-24-0219 · Cited by 2
Williams, C. J. (2013) · Human Biology · Cited by 2
Regulation of RNA methylation by therapy treatment, promotes tumor survivalPreprint
Bukhari, S. I. A., Truesdell, S. S., Datta, C., Choudhury, P., Wu, K. Q., Shrestha, J., Maharjan, R., Plotsker, E., Elased, R. K., Laisa, S., et al. (2023) · bioRxiv (Cold Spring Harbor Laboratory) · doi:10.1101/2023.05.19.540602 · Cited by 2
The role of lysosomes in autophagy
Rabanal‐Ruiz, Y., & Korolchuk, V. I. (2021) · Elsevier eBooks · doi:10.1016/b978-0-12-822003-0.00007-3 · Cited by 1
Yue, L., Huang, H., & Lin, W. (2024) · Angewandte Chemie · doi:10.1002/ange.202407308 · Cited by 1
Dong, N., & Yue, H. (2025) · European Journal of Pharmacology · doi:10.1016/j.ejphar.2025.178251 · Cited by 1
Xiao, Y., Yu, S.-J., Meng, J., Mo, L.-M., Yu, S.-Y., Li, M., Dou, X., Shi, X.-L., & Luo, Z.-F. (2026) · Microbial Pathogenesis · doi:10.1016/j.micpath.2026.108349 · Cited by 1
Alshaikh, A. B. A., Al‐kuraishy, H. M., Abdelaziz, A. M., Hepishy, I. M., Albar, M. A., & Batiha, G. E. (2026) · Naunyn-Schmiedeberg s Archives of Pharmacology · doi:10.1007/s00210-026-05202-2 · Cited by 1
Chen, M., Sun, Y., & Feng, S. (2026) · International Immunopharmacology · doi:10.1016/j.intimp.2026.116838 · Cited by 1
Multifactorial nature of anabolic resistance in ageing skeletal muscle: A systems modelling study
McColl, T. J., Moore, D. R., Emberly, E. G., Church, D. D., & Clarke, D. C. (2026) · The Journal of Physiology · doi:10.1113/jp290799 · Cited by 2
Xu, H., Luo, X., He, X., Jin, X., Zhang, Y. L., & Xu, X. (2026) · Genes & Genomics · doi:10.1007/s13258-026-01791-7 · Cited by 1
Singh, N., Mudassir, M., Ansari, S., Chosdol, K., Sinha, S., & Chattopadhyay, P. (2023) · Nanomedicine · doi:10.2217/nnm-2023-0139 · Cited by 1
Tang, D. D., Liao, G., Wu, Y., Wang, R., Maheshwari, N., & Penn, R. B. (2023) · Research Square · doi:10.21203/rs.3.rs-2869821/v1 · Cited by 1
DBT is a metabolic switch for maintenance of proteostasis under proteasomal impairmentPreprint
Hwang, R., Lu, Y., Tang, Q., Periz, G., Park, G., Li, X., Liu, Y., Zhang, T., & Wang, J. (2024) · eLife · doi:10.7554/elife.91002.2 · Cited by 1
DBT is a metabolic switch for maintenance of proteostasis under proteasomal impairmentPreprint
Hwang, R., Lu, Y., Tang, Q., Periz, G., Park, G., Li, X., Xiang, Q., Liu, Y., Zhang, T., & Wang, J. (2024) · eLife · doi:10.7554/elife.91002.3 · Cited by 1
McColl, T. J., Moore, D. R., Emberly, E. G., Church, D. D., & Clarke, D. C. (2025) · bioRxiv (Cold Spring Harbor Laboratory) · doi:10.1101/2025.09.12.675977 · Cited by 1
Fluid flow and Smad2 affects the response of vascular endothelial cells in vitro and in vivo
Tamez-Vielma, L. S. (2016) · Libraries and Cultural Resources (University of Calgary) · doi:10.11575/prism/26194
Interaction of type I interferons and mTOR signaling underlying PRRSV infection
Liu, Q. (2016) · K-State Research Exchange (Kansas State University)
Lifespan of Catalase-Deficient Mice Decreases Due to Lysosomal DysfunctionPreprint
Dutta, R. K., Lee, J. N., Maharjan, Y., Park, C., Choe, S., & Park, R. (2021) · Research Square · doi:10.21203/rs.3.rs-965044/v1
mTOR REGULATES THE PROLIFERATION AND DIFFERENTIATION OF TENDON STEM CELLS: AN IN VITRO STUDY
Gao, S., Tang, H., Zhou, B., & Tang, K. (2017) · Journal of Aging Research and Lifestyle · doi:10.14283/jarcp.2017.22
Wiersinga, W. J., & Haak, B. W. (2019) · Faculty Opinions – Post-Publication Peer Review of the Biomedical Literature · doi:10.3410/f.734920969.793556473
Okano, T., Ashida, H., Komatsu, N., Tsukasaki, M., Iida, T., Iwasawa, M., Takahashi, Y., Takeuchi, Y., Iwata, T., Sasai, M., et al. (2022) · SSRN Electronic Journal · doi:10.2139/ssrn.4147940
DBT is a metabolic switch for maintenance of proteostasis under proteasomal impairmentPreprint
Hwang, R., Lu, Y.-N., Tang, Q., Periz, G., Park, G., Li, X., Xiang, Q., Liu, Y., Zhang, T., & Wang, J. (2023) · bioRxiv (Cold Spring Harbor Laboratory) · doi:10.1101/2023.09.12.556394
DBT is a metabolic switch for maintenance of proteostasis under proteasomal impairmentPreprint
Hwang, R., Lu, Y., Tang, Q., Periz, G., Park, G., Li, X., Liu, Y., Zhang, T., & Wang, J. (2023) · eLife · doi:10.7554/elife.91002.1
El-Sheikh, M., Mesalam, A. A., & Kong, I. (2024) · Egyptian Journal of Chemistry · doi:10.21608/ejchem.2024.227220.8366
Rodems, B. J., Sharma, S., Baker, C. D., Kaszuba, C. M., Ito, T., Liesveld, J. L., Calvi, L. M., Becker, M. W., Jordan, C. T., Ashton, J. M., et al. (2024) · bioRxiv (Cold Spring Harbor Laboratory) · doi:10.1101/2024.05.11.593633
Hwang, R., Lu, Y., Tang, Q., Periz, G., Park, G., Li, X., Xiang, Q., Liu, Y., Zhang, T., & Wang, J. (2024) · eLife · doi:10.7554/elife.91002.3.sa3
DBT is a metabolic switch for maintenance of proteostasis under proteasomal impairment
Hwang, R., Lu, Y., Tang, Q., Periz, G., Park, G., Li, X., Xiang, Q., Liu, Y., Zhang, T., & Wang, J. (2024) · eLife · doi:10.7554/elife.91002.4
Antitumor and antiproliferative potential of crotoxin in triple negative breast tumors
Marques, D. A. C., Marzocchi, M. C. M., Attié, D., Teixeira, N. A. A., Cristina, A., Felipe, C., Cristina, C. N., & Torqueti, M. R. (2025) · Toxicon · doi:10.1016/j.toxicon.2025.108322
Zhao, W., Gong, Z., Wang, B., Wu, Z., Guo, Y., Wang, S., Zhai, H., Zheng, X., & Yang, L. (2025) · Cell Biochemistry and Biophysics · doi:10.1007/s12013-025-01916-x
Argon inhibits autophagy and improves cerebral ischemia-reperfusion injury via PI3K/Akt/mTOR pathwayPreprint
Ma, S., Wang, M., Luo, Z., Petersen, P., Wang, E., Xia, Y., & Yang, L.-H. (2025) · bioRxiv (Cold Spring Harbor Laboratory) · doi:10.1101/2025.10.31.685964
Madrakhimov, S. B., Yang, J. Y., Kim, J. H., Han, J. W., & Park, T. K. (2021) · Figshare · doi:10.6084/m9.figshare.14129348
Self-citationHe, T., Li, W., Song, Y., Li, Z., Tang, Y., Zhang, Z., & Yang, G.-Y. (2020) · Figshare · doi:10.6084/m9.figshare.13199233
Self-citationXue, W.-J., He, C.-F., Zhou, R.-Y., Xu, X.-D., Xiang, L., Wang, J.-T., Wang, X.-R., Zhou, H.-G., & Guo, J.-C. (2022) · Figshare · doi:10.6084/m9.figshare.20336875
He, T., Li, W., Song, Y., Li, Z., Tang, Y., Zhang, Z., & Yang, G.-Y. (2020) · Figshare · doi:10.6084/m9.figshare.13199236
Self-citationXue, W.-J., He, C.-F., Zhou, R.-Y., Xu, X.-D., Xiang, L., Wang, J.-T., Wang, X.-R., Zhou, H.-G., & 郭景春 (2022) · Figshare · doi:10.6084/m9.figshare.20336872
Non-covalent mTOR inhibition suppresses NLRP3-GSDMD inflammasome-mediated pyroptosis
Jiang, X., Zhang, X., Cai, X., Tang, M., Peng, J., Zhang, R., Su, K., Lin, L., Ma, R., Shen, C., et al. (2025) · Biochemical Pharmacology · doi:10.1016/j.bcp.2025.117459
Repressed mTORC1 signaling and transient dendritic pruning support axonal regenerationPreprint
Zhang, A., Masin, L., Bergmans, S., Putti, E., Albadri, S., Poulain, F. E., Bene, F. D., & Moons, L. (2026) · bioRxiv (Cold Spring Harbor Laboratory) · doi:10.64898/2026.02.11.705324
Ozawa-Uyeda, T. A., Huazano-García, A., Flores, J. L. H., & Lozoya‐Gloria, E. (2026) · European Journal of Phycology · doi:10.1080/09670262.2026.2628754
Membrane progesterone receptor signaling reverses hyperglycemia and insulin resistance in obese micePreprint
Nader, N., Zarif, L., Sherif, S., Al-Hamaq, J., Qahtani, D. A., Courjaret, R. J., Yu, F., Abunada, H. H., Vemulapalli, P. B., Choi, S., et al. (2026) · bioRxiv (Cold Spring Harbor Laboratory) · doi:10.64898/2026.03.27.714733
Role of p27/Kip1 in auphagy under metabolic stress conditions
Nowosad, A. (2018) · theses.fr (ABES) · doi:10.70675/11eb36d1zc3baz4d74z8d00zc049667c5976
Elucidating the Vulnerability of Glioblastoma Stem-like Cells to Lysosomal Dysfunctions
Maghe, C. (2023) · theses.fr (ABES) · doi:10.70675/cb5da8bdzc225z4cf1z80a7zeb24afa442f9
Huang, D., Mendjargal, A., Boldbaatar, D., Liu, Y., Guo, H., Olzvoi, E., Odkhuu, E., & Baldandorj, B. (2026) · Current Traditional Medicine · doi:10.2174/0122150838447424260311112620
Yu, T., Barayan, R., Song, L., Vidhyasagar, V., Tamakuwala, J., Nair, S. N., Philip, V., & Lok, B. H. (2026) · Cancer & Metabolism · doi:10.1186/s40170-026-00443-4
Zhu, X., Luo, Y., Xu, J.-Y., Yang, X., Liu, Y.-S., & Xiao, J. (2026) · Life Sciences · doi:10.1016/j.lfs.2026.124579
Yu, Y., Xia, W., Tao, C., Fang, X., Qi, Y., Zhang, W., Qin, T., Yang, J., Du, D., Liu, Z. H., et al. (2026) · Theriogenology · doi:10.1016/j.theriogenology.2026.118069
Vilioti, M. S., Ragnelli, B. C., Berling, F. P., Mendes, C. M., Assumpção, M. E. O. D., & Goissis, M. D. (2026) · Reproductive Biology · doi:10.1016/j.repbio.2026.101284
mTOR signalling, not clock gene rhythms, organises daily physiologyPreprint
Zeng, A., Mihut, A., Anandapadamanaban, M., Goity, A., Dantas, L. L. D. B., Chew, S. Y. P., Hayter, E. A., Andersson, L. C., Smith, T. S., Pasquini, G., et al. (2026) · bioRxiv (Cold Spring Harbor Laboratory) · doi:10.64898/2026.08.28.747564
Song, J., Kan, H., Jin, H., Yue, L., Qian, Z., Wang, B., Xia, Z., Zhou, Y., & Zhang, J. (2026) · Frontiers in Microbiology · doi:10.3389/fmicb.2026.1941347 · Cited by 1
Kudrna, K. M., Vilches, L. F., Xiaoxiao, W., Wang, J., Hugo, T., Bailey, K. L., & Dickinson, J. D. (2026) · bioRxiv (Cold Spring Harbor Laboratory) · doi:10.64898/2026.09.15.751828
Golgi disassembly: a key process for autophagy-mediated regulation of oocyte spindle migration
Zhang, J., Wang, N., Wang, X., Qiao, J., Yuan, P., & Yan, L. (2026) · Autophagy · doi:10.1080/15548627.2026.2747860
Yu, X.-J., Quan, B.-Y., Zou, P., Wang, S.-B., Li, L.-J., Luo, R., Zhang, Y.-Y., & Zhao, Y.-T. (2026) · Materials Today Bio · doi:10.1016/j.mtbio.2026.103768
Metadata
- Authors
- Choi, Y. J., Park, Y. J., Park, J. Y., Jeong, H. O., Kim, D. H., Ha, Y. M., Kim, J. M., Song, Y. M., Heo, H.-S., Yu, B. P., Chun, P., Moon, H. R., & Chung, H. Y.
- Affiliations
- Pusan National University (KR)
- Korea Research Institute of Bioscience and Biotechnology (KR)
- The University of Texas at San Antonio Health Science Center (US)
- Inje University (KR)
- Corresponding author
- Moon, Hyung Ryong
- Chung, Hae Young
- ORCID
- Venue
- PLoS ONE
- Publisher
- Public Library of Science (PLoS)
- Published
- 2012-08-22
- Volume
- 7
- Issue
- 8
- Pages
- e43418
- ISSN
- 1932-6203 (ISSN-L)
- PMC
- PMC3425474
- OpenAlex
- W1985820389
- Cited by
- 192
- References
- 47
- Citations by year
- 2026: 18 · 2025: 13 · 2024: 28 · 2023: 16 · 2022: 14 · 2021: 16 · 2020: 17 · 2019: 10 · 2018: 17 · 2017: 15 · 2016: 10 · 2015: 9 · 2014: 6 · 2013: 3
- FWCI
- 4.29
- Type
- journal article
- Language
- en
- Update notices
- correction (2013-01-29)
- Open access
- gold
- doi.org
- Locations
- PLoS ONE (publishedVersion, cc-by)
- PubMed Central (publishedVersion, cc-by)
- PubMed (publishedVersion)
- DOAJ (DOAJ: Directory of Open Access Journals) (submittedVersion, cc-by-sa)
- KRIBB Repository (submittedVersion)
- Funders
- National Research Foundation
- National Research Foundation of Korea (20090083538, No. 2009-0083538)
- Topics
- Life Sciences › Biochemistry, Genetics and Molecular Biology › Cell Biology › Autophagy in Disease and Therapy
- Life Sciences › Biochemistry, Genetics and Molecular Biology › Physiology › Calcium signaling and nucleotide metabolism
- Life Sciences › Biochemistry, Genetics and Molecular Biology › Molecular Biology › PI3K/AKT/mTOR signaling in cancer
- Keywords
- MHY1485, autophagy inhibition, mTOR activation, lysosome fusion, autophagosome-lysosome fusion, starvation-induced autophagy, autophagic flux, hepatocytes, p62, Beclin-1, mTOR inhibitors
- MeSH terms
- Animals, Autophagy, Liver, Lysosomes, Microtubule-Associated Proteins, Morpholines, Protein Conformation, Triazines, Vacuoles, Rats, TOR Serine-Threonine Kinases, Molecular Docking Simulation
About these checks
Registry, retraction, Cites and statistics results are computed, not judged, with one exception: a printed reference that no index lists is read once by a model before it counts as a citation error. Claims are extracted by a model and kept only when their quote appears verbatim in the text; each cited source is then checked, with a model’s help, for whether it says what the claim relies on. Those verdicts can be wrong — read the claim’s quote and the cited source before relying on one.
Statistics and arithmetic are recomputed, not judged.
Confidence bands are shown only for fields calibrated on our annotated test set. None is calibrated yet, so no band is shown.
What counts as a claim ›How we measure confidence ›How we check this ›
Are you an author, or do you see a problem with this page? Request a review
