

The DOI matches its Crossref record; 43 of the 43 references it cites were found in a registry or an index; 2 of the 25 sources its claims cite were checked for support.
The Relationship of Sugar to Population-Level Diabetes Prevalence: An Econometric Analysis of Repeated Cross-Sectional Data
Open accessAbstract
While experimental and observational studies suggest that sugar intake is associated with the development of type 2 diabetes, independent of its role in obesity, it is unclear whether alterations in sugar intake can account for differences in diabetes prevalence among overall populations. Using econometric models of repeated cross-sectional data on diabetes and nutritional components of food from 175 countries, we found that every 150 kcal/person/day increase in sugar availability (about one can of soda/day) was associated with increased diabetes prevalence by 1.1% (p <0.001) after testing for potential selection biases and controlling for other food types (including fibers, meats, fruits, oils, cereals), total calories, overweight and obesity, period-effects, and several socioeconomic variables such as aging, urbanization and income. No other food types yielded significant individual associations with diabetes prevalence after controlling for obesity and other confounders. The impact of sugar on diabetes was independent of sedentary behavior and alcohol use, and the effect was modified but not confounded by obesity or overweight. Duration and degree of sugar exposure correlated significantly with diabetes prevalence in a dose-dependent manner, while declines in sugar exposure correlated with significant subsequent declines in diabetes rates independently of other socioeconomic, dietary and obesity prevalence changes. Differences in sugar availability statistically explain variations in diabetes prevalence rates at a population level that are not explained by physical activity, overweight or obesity.
Overview
AI snapshot
Written from the paper’s full text.
TL;DR
Using econometric models of repeated cross-sectional data from 175 countries, this study found that higher sugar availability was associated with higher population-level diabetes prevalence, independent of obesity and other food types. The author concludes that sugar availability statistically explains some population variation in diabetes rates not explained by physical activity, overweight, or obesity.
Key findings
- Every 150 kcal/person/day increase in sugar availability (about one can of soda/day) was associated with a 1.1% increase in diabetes prevalence (95% CI: 0.48–1.7%; p<0.001) after controlling for other foods, total calories, overweight/obesity, period effects, and socioeconomic variables; total calorie availability was not significantly associated (0.1% rise per 150 kcal, not significant). No other food type had a significant individual association with diabetes prevalence after controls.
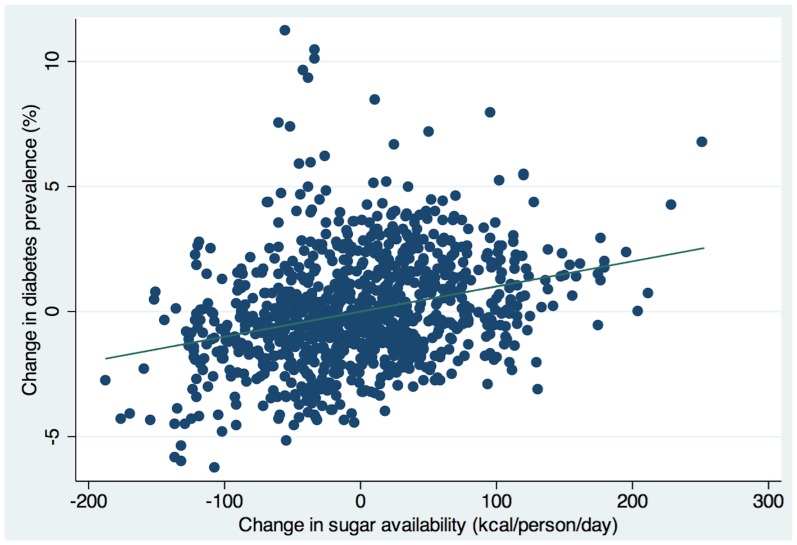
- The fraction of total calories from sugar was the only significant food fraction: a 1% rise corresponded to a 0.167% rise in diabetes prevalence. Each extra year of high sugar availability (≥300 kcal/person/day) was associated with a 0.053% increase in diabetes prevalence (p<0.05), and periods after a country lowered sugar availability showed a 0.074% reduction in diabetes prevalence (p<0.05).
- Diabetes prevalence rose 27% on average from 2000 to 2010, with just over one-fourth of the increase explained by rising sugar availability in the model. The sugar association remained after controlling for selection bias (magnified to 1.2% per 150 kcal/person/day, p<0.001), after removing outliers (1.2%, p<0.001), and in an autoregressive time-series model (0.4%, p<0.001).
Methods
- Econometric analysis of repeated cross-sectional panel data from 175 countries, 2000–2010. Diabetes prevalence (ages 20–79) came from the International Diabetes Federation; sugar and other food availability (kcal/person/day) came from UN FAO food supply data.
- Main models controlled for total calories, fibers, fruits, meats, cereals, oils, log GDP per capita, change in log GDP, urbanization, aging, obesity/overweight, period effects, and later physical inactivity, smoking, and heavy alcohol use. Food data were age-adjusted, regressions were population weighted, and robust standard errors were used.
- Analyses included Generalized Estimating Equations for model selection, a Hausman test, a Heckman-type selection model for high sugar availability, Granger-causality tests, and robustness checks (outlier removal, autoregressive time-series, fixed effects, direct survey data, and excluding the U.S.).
Limitations
- The paper states that cross-country ecological analysis risks ecological fallacy; food supply data measure availability, not actual consumption, and cannot account precisely for food wastage. It also cannot distinguish specific added sugars (e.g., HFCS vs. sucrose) or specific vehicles (e.g., soda vs. processed food).
- The paper states that ecological data limit statistical power and lose age, sex, and racial predictions; IDF diabetes prevalence data come from surveys of varying quality, likely underestimate diabetes, and do not distinguish type 1 from type 2 diabetes. FAO, IDF, and WHO data are described as imperfect, making findings exploratory.
- Evident from the text: the study is observational and country-level, so it cannot establish individual-level causation; despite extensive controls, unmeasured confounding remains possible, and sugar availability is a proxy for intake rather than a direct consumption measure.
Model-written summary. Check it against the paper before relying on it.
Integrity signals
Registry
Cites
Statistics
Figures
Verification
Claims the paper makes
28 Own result · 15 Not checked yet · 12 Own interpretation · 11 Own method · 4 No basis given · 1 Partly supported · accuracy not yet measured
A result the paper reports from its own data — it cites no other source for it, so there is none to check. The quote shows it is in the paper.
In the paper
“In countries like the Philippines, Romania, Sri Lanka, Georgia and Bangladesh, where high and rising diabetes rates were observed in the context of low obesity rates, sugar availability rose by over 20% during the study period.”
§ The Relationship of Sugar to Population-Level Diabetes Prevalence: An Econometric Analysis of Repeated Cross-Sectional Data > Results > Correlates of diabetes prevalence
plaincorrelational- Asserted: passes — The authors put it forward as true.
- Checkable: passes — It can be checked against evidence.
- Load-bearing: unclear — It is unclear whether the paper’s conclusions depend on it.
- Based: passes — The paper gives a reason why it holds.
- Rests on an assumption: Food supply data on market availability accurately reflect population-level sugar intake or consumption.
- Rests on an assumption: International Diabetes Federation diabetes prevalence estimates are valid and comparable across countries and years.
None of the sources cited for this claim have been checked yet.
In the paper
“The coefficient of log Gross Domestic Product (GDP) per capita was 1.07, which means that a 1% increase in GDP levels corresponded to a 1.07% rise in diabetes prevalence (p<0.05), consistent with the notion that economic development is a powerful correlate to diabetes prevalence [35], [36].”
§ The Relationship of Sugar to Population-Level Diabetes Prevalence: An Econometric Analysis of Repeated Cross-Sectional Data > Results > Correlates of diabetes prevalence
What the sources say
plaindirect- Asserted: passes — The authors put it forward as true.
- Checkable: passes — It can be checked against evidence.
- Load-bearing: unclear — It is unclear whether the paper’s conclusions depend on it.
- Based: passes — The paper gives a reason why it holds.
- Rests on an assumption: Food supply data on market availability accurately reflect population-level sugar intake or consumption.
- Rests on an assumption: International Diabetes Federation diabetes prevalence estimates are valid and comparable across countries and years.
A result the paper reports from its own data — it cites no other source for it, so there is none to check. The quote shows it is in the paper.
In the paper
“We initially separated fruit from other vegetables/fibers given the potential glucose burden of fruit; when repeating the analysis combining fruits with vegetables and other fibers, the results did not change.”
§ The Relationship of Sugar to Population-Level Diabetes Prevalence: An Econometric Analysis of Repeated Cross-Sectional Data > Results > Correlates of diabetes prevalence
plain- Asserted: passes — The authors put it forward as true.
- Checkable: passes — It can be checked against evidence.
- Load-bearing: unclear — It is unclear whether the paper’s conclusions depend on it.
- Based: passes — The paper gives a reason why it holds.
- Rests on an assumption: Food supply data on market availability accurately reflect population-level sugar intake or consumption.
- Rests on an assumption: International Diabetes Federation diabetes prevalence estimates are valid and comparable across countries and years.
A result the paper reports from its own data — it cites no other source for it, so there is none to check. The quote shows it is in the paper.
In the paper
“Using econometric models of repeated cross-sectional data on diabetes and nutritional components of food from 175 countries, we found that every 150 kcal/person/day increase in sugar availability (about one can of soda/day) was associated with increased diabetes prevalence by 1.1% (p <0.001) after testing for potential selection biases and controlling for other food types (including fibers, meats,”
- Also stated in: § Correlates of diabetes prevalence · plain
“Each 150 kilocalorie/person/day increase in total calorie availability related to a 0.1% rise in diabetes prevalence (not significant), whereas a 150 kilocalories/person/day rise in sugar availability (one 12 oz. can of soft drink) was associated with a 1.1% rise in diabetes prevalence (95% CI: 0.48–1.7%; p<0.001) after all control variables were incorporated into the model.”
§ The Relationship of Sugar to Population-Level Diabetes Prevalence: An Econometric Analysis of Repeated Cross-Sectional Data > Abstract
plaincorrelational- Asserted: passes — The authors put it forward as true.
- Checkable: passes — It can be checked against evidence.
- Load-bearing: passes — The paper’s conclusions depend on it.
- Based: passes — The paper gives a reason why it holds.
- Rests on an assumption: Food supply data on market availability accurately reflect population-level sugar intake or consumption.
- Rests on an assumption: International Diabetes Federation diabetes prevalence estimates are valid and comparable across countries and years.
- Also stated in: § Correlates of diabetes prevalence · plain
None of the sources cited for this claim have been checked yet.
In the paper
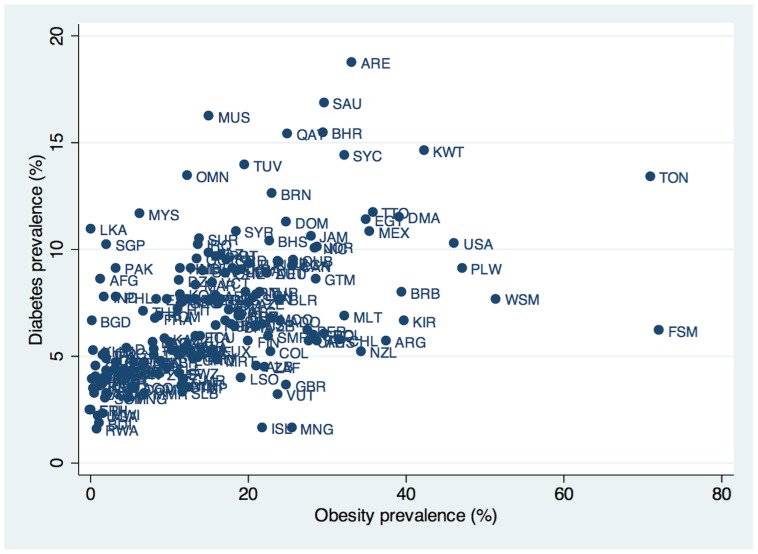
“High diabetes yet low obesity prevalence are observed in countries with different ethnic compositions, such as the Philippines, Romania, France, Bangladesh and Georgia, although there are likely surveillance quality differences between nations [6], [7].”
§ The Relationship of Sugar to Population-Level Diabetes Prevalence: An Econometric Analysis of Repeated Cross-Sectional Data > Introduction
What the sources say
- Not checked yetcites [6] International Diabetes Federation (2011) IDF Diabetes Atlas.
- Not checked yetcites [7] World Health Organization (2012) Global database on body mass index.
hedged- Asserted: passes — The authors put it forward as true.
- Checkable: passes — It can be checked against evidence.
- Load-bearing: passes — The paper’s conclusions depend on it.
- Based: passes — The paper gives a reason why it holds.
A result the paper reports from its own data — it cites no other source for it, so there is none to check. The quote shows it is in the paper.
In the paper
“We additionally tested whether sugar availability alone was a significant predictor of obesity rates independent of the other control variables (total consumption, urbanization, aging, income, other foods and period effects), and found the expected relationship between total calories and obesity, but not individually between sugar and obesity when total calories was accounted for—consistent with”
§ The Relationship of Sugar to Population-Level Diabetes Prevalence: An Econometric Analysis of Repeated Cross-Sectional Data > Results > Correlates of diabetes prevalence
plain- Asserted: passes — The authors put it forward as true.
- Checkable: passes — It can be checked against evidence.
- Load-bearing: passes — The paper’s conclusions depend on it.
- Based: passes — The paper gives a reason why it holds.
- Rests on an assumption: Food supply data on market availability accurately reflect population-level sugar intake or consumption.
- Rests on an assumption: International Diabetes Federation diabetes prevalence estimates are valid and comparable across countries and years.
A result the paper reports from its own data — it cites no other source for it, so there is none to check. The quote shows it is in the paper.
In the paper
“each 150 kcal/person/day rise in sugar availability related to a 0.4% rise in diabetes prevalence (p<0.001).”
§ The Relationship of Sugar to Population-Level Diabetes Prevalence: An Econometric Analysis of Repeated Cross-Sectional Data > Results > Additional robustness checks
plaincorrelational- Asserted: passes — The authors put it forward as true.
- Checkable: passes — It can be checked against evidence.
- Load-bearing: unclear — It is unclear whether the paper’s conclusions depend on it.
- Based: passes — The paper gives a reason why it holds.
- Rests on an assumption: No direct measures of actual human consumption that account for food wastage and provide precise measures of food consumption internationally exist.
A result the paper reports from its own data — it cites no other source for it, so there is none to check. The quote shows it is in the paper.
In the paper
“We found that in the periods after a country lowered its sugar availability (typically in the context of changes in trade agreements, discussed at length elsewhere, [38]), diabetes prevalence reduced by 0.074% (p<0.05), after correcting for changes in all other controls including the economic variables, socio-demographic variables, and changes in consumption of other food products as well as total”
§ The Relationship of Sugar to Population-Level Diabetes Prevalence: An Econometric Analysis of Repeated Cross-Sectional Data > Results > Additional robustness checks
plaindirect- Asserted: passes — The authors put it forward as true.
- Checkable: passes — It can be checked against evidence.
- Load-bearing: passes — The paper’s conclusions depend on it.
- Based: passes — The paper gives a reason why it holds.
- Rests on an assumption: No direct measures of actual human consumption that account for food wastage and provide precise measures of food consumption internationally exist.
A result the paper reports from its own data — it cites no other source for it, so there is none to check. The quote shows it is in the paper.
In the paper
“At a population level, however, obesity does not fully explain variations and trends in diabetes prevalence rates observed in many countries.”
§ The Relationship of Sugar to Population-Level Diabetes Prevalence: An Econometric Analysis of Repeated Cross-Sectional Data > Introduction
plain- Asserted: passes — The authors put it forward as true.
- Checkable: passes — It can be checked against evidence.
- Load-bearing: passes — The paper’s conclusions depend on it.
- Based: passes — The paper gives a reason why it holds.
A result the paper reports from its own data — it cites no other source for it, so there is none to check. The quote shows it is in the paper.
In the paper
“In Table 1 , we see that sugar availability remained a significant correlate to diabetes prevalence independent of obesity and total calorie consumption.”
§ The Relationship of Sugar to Population-Level Diabetes Prevalence: An Econometric Analysis of Repeated Cross-Sectional Data > Results > Correlates of diabetes prevalence
plaincorrelational- Asserted: passes — The authors put it forward as true.
- Checkable: passes — It can be checked against evidence.
- Load-bearing: passes — The paper’s conclusions depend on it.
- Based: passes — The paper gives a reason why it holds.
- Rests on an assumption: Food supply data on market availability accurately reflect population-level sugar intake or consumption.
- Rests on an assumption: International Diabetes Federation diabetes prevalence estimates are valid and comparable across countries and years.
- It may state two separate claims as one. 32
- The quote only partly states this claim. 1
- Probably not a substantial claim. 11
The cited sources support only part of this claim — read each source’s verdict below.
In the paper
“For example, liver fructose metabolism in the fed state generates lipogenic substrates in an unregulated fashion, which drives hepatic de novo lipogenesis and reduced fatty acid oxidation, forming excessive liver fat and inflammation that inactivates the insulin signaling pathway, leading to hepatic insulin resistance [16], [17].”
§ The Relationship of Sugar to Population-Level Diabetes Prevalence: An Econometric Analysis of Repeated Cross-Sectional Data > Introduction
What the sources say
- Supportedcites [16] AA Bremer, 2012, Toward a unifying hypothesis of metabolic syndrome, Pediatrics source
Split into 2 atoms — 2 confirmed, 0 partially supported, 0 disputed, 0 misattributed, 0 unverifiable. Expand the claim to see per-atom verdicts.
- Partly supportedcites [17] Y Nagai, 2009, The role of peroxisome proliferator-activated receptor gamma coactivator-1 beta in the pathogenesis of fructose-induced insulin resistance, Cell Metab sourceExperimental — accuracy not yet measured
Split into 2 atoms — 0 confirmed, 2 partially supported, 0 disputed, 0 misattributed, 0 unverifiable. Expand the claim to see per-atom verdicts.
plaindirect- Asserted: passes — The authors put it forward as true.
- Checkable: passes — It can be checked against evidence.
- Load-bearing: passes — The paper’s conclusions depend on it.
- Based: passes — The paper gives a reason why it holds.
It may state two separate claims as one.
- Supported
A result the paper reports from its own data — it cites no other source for it, so there is none to check. The quote shows it is in the paper.
In the paper
“The impact of sugar on diabetes was independent of sedentary behavior and alcohol use, and the effect was modified but not confounded by obesity or overweight.”
§ The Relationship of Sugar to Population-Level Diabetes Prevalence: An Econometric Analysis of Repeated Cross-Sectional Data > Abstract
plaindirect- Asserted: passes — The authors put it forward as true.
- Checkable: passes — It can be checked against evidence.
- Load-bearing: passes — The paper’s conclusions depend on it.
- Based: passes — The paper gives a reason why it holds.
It may state two separate claims as one.
- Rests on an assumption: Food supply data on market availability accurately reflect population-level sugar intake or consumption.
- Rests on an assumption: International Diabetes Federation diabetes prevalence estimates are valid and comparable across countries and years.
The paper states this without a source or data behind it here, so there is nothing to check it against. The quote shows it is in the paper.
In the paper
“Trends in diabetes and obesity are also dyssynchronous within some nations; while Sri Lanka’s diabetes prevalence rate rose from 3% in the year 2000 to 11% in 2010, its obesity rate remained at 0.1% during that time period.”
§ The Relationship of Sugar to Population-Level Diabetes Prevalence: An Econometric Analysis of Repeated Cross-Sectional Data > Introduction
plain- Asserted: passes — The authors put it forward as true.
- Checkable: passes — It can be checked against evidence.
- Load-bearing: passes — The paper’s conclusions depend on it.
- Based: passes — The paper gives a reason why it holds.
It may state two separate claims as one.
A result the paper reports from its own data — it cites no other source for it, so there is none to check. The quote shows it is in the paper.
In the paper
“Incorporation of these factors (see Table S4) did not affect the sugar variable and did not themselves reach statistical significance as independent correlates of diabetes when the other control variables were included in the model.”
§ The Relationship of Sugar to Population-Level Diabetes Prevalence: An Econometric Analysis of Repeated Cross-Sectional Data > Results > Additional control variables
plain- Asserted: passes — The authors put it forward as true.
- Checkable: passes — It can be checked against evidence.
- Load-bearing: passes — The paper’s conclusions depend on it.
- Based: passes — The paper gives a reason why it holds.
It may state two separate claims as one.
A result the paper reports from its own data — it cites no other source for it, so there is none to check. The quote shows it is in the paper.
In the paper
“As shown in Figure 1 , several countries with high diabetes prevalence rates have low obesity rates, and vice versa.”
§ The Relationship of Sugar to Population-Level Diabetes Prevalence: An Econometric Analysis of Repeated Cross-Sectional Data > Introduction
plain- Asserted: passes — The authors put it forward as true.
- Checkable: passes — It can be checked against evidence.
- Load-bearing: passes — The paper’s conclusions depend on it.
- Based: passes — The paper gives a reason why it holds.
It may state two separate claims as one.
A result the paper reports from its own data — it cites no other source for it, so there is none to check. The quote shows it is in the paper.
In the paper
“Duration and degree of sugar exposure correlated significantly with diabetes prevalence in a dose-dependent manner, while declines in sugar exposure correlated with significant subsequent declines in diabetes rates independently of other socioeconomic, dietary and obesity prevalence changes.”
§ The Relationship of Sugar to Population-Level Diabetes Prevalence: An Econometric Analysis of Repeated Cross-Sectional Data > Abstract
plaincorrelational- Asserted: passes — The authors put it forward as true.
- Checkable: passes — It can be checked against evidence.
- Load-bearing: passes — The paper’s conclusions depend on it.
- Based: passes — The paper gives a reason why it holds.
It may state two separate claims as one.
- Rests on an assumption: Food supply data on market availability accurately reflect population-level sugar intake or consumption.
- Rests on an assumption: International Diabetes Federation diabetes prevalence estimates are valid and comparable across countries and years.
A result the paper reports from its own data — it cites no other source for it, so there is none to check. The quote shows it is in the paper.
In the paper
“We tested the hypothesis that low-carbohydrate fibers (nuts and vegetables) might be protective against diabetes by individually including them in the regression (as opposed to all fiber-containing foods) but they had no significant effect, and did not change the impact of sugar on diabetes prevalence.”
§ The Relationship of Sugar to Population-Level Diabetes Prevalence: An Econometric Analysis of Repeated Cross-Sectional Data > Results > Correlates of diabetes prevalence
plain- Asserted: passes — The authors put it forward as true.
- Checkable: passes — It can be checked against evidence.
- Load-bearing: unclear — It is unclear whether the paper’s conclusions depend on it.
- Based: passes — The paper gives a reason why it holds.
It may state two separate claims as one.
- Rests on an assumption: Food supply data on market availability accurately reflect population-level sugar intake or consumption.
- Rests on an assumption: International Diabetes Federation diabetes prevalence estimates are valid and comparable across countries and years.
A result the paper reports from its own data — it cites no other source for it, so there is none to check. The quote shows it is in the paper.
In the paper
“Each 150 kilocalorie/person/day increase in total calorie availability related to a 0.1% rise in diabetes prevalence (not significant)”
§ The Relationship of Sugar to Population-Level Diabetes Prevalence: An Econometric Analysis of Repeated Cross-Sectional Data > Results > Correlates of diabetes prevalence
plaincorrelational- Asserted: passes — The authors put it forward as true.
- Checkable: passes — It can be checked against evidence.
- Load-bearing: unclear — It is unclear whether the paper’s conclusions depend on it.
- Based: passes — The paper gives a reason why it holds.
It may state two separate claims as one.
- Rests on an assumption: Food supply data on market availability accurately reflect population-level sugar intake or consumption.
- Rests on an assumption: International Diabetes Federation diabetes prevalence estimates are valid and comparable across countries and years.
A result the paper reports from its own data — it cites no other source for it, so there is none to check. The quote shows it is in the paper.
In the paper
“In all cases, the sugar variable maintained a similar association with diabetes prevalence.”
§ The Relationship of Sugar to Population-Level Diabetes Prevalence: An Econometric Analysis of Repeated Cross-Sectional Data > Results > Additional robustness checks
plaincorrelational- Asserted: passes — The authors put it forward as true.
- Checkable: passes — It can be checked against evidence.
- Load-bearing: passes — The paper’s conclusions depend on it.
- Based: passes — The paper gives a reason why it holds.
The quote only partly states this claim.
- Rests on an assumption: No direct measures of actual human consumption that account for food wastage and provide precise measures of food consumption internationally exist.
A result the paper reports from its own data — it cites no other source for it, so there is none to check. The quote shows it is in the paper.
In the paper
“Diabetes prevalence rates rose 27% on average from 2000 to 2010, with just over one-fourth of the increase explained by a rise in sugar availability in this model.”
§ The Relationship of Sugar to Population-Level Diabetes Prevalence: An Econometric Analysis of Repeated Cross-Sectional Data > Results > Correlates of diabetes prevalence
plaindirect- Asserted: passes — The authors put it forward as true.
- Checkable: passes — It can be checked against evidence.
- Load-bearing: passes — The paper’s conclusions depend on it.
- Based: passes — The paper gives a reason why it holds.
It may state two separate claims as one.
- Rests on an assumption: Food supply data on market availability accurately reflect population-level sugar intake or consumption.
- Rests on an assumption: International Diabetes Federation diabetes prevalence estimates are valid and comparable across countries and years.
A result the paper reports from its own data — it cites no other source for it, so there is none to check. The quote shows it is in the paper.
In the paper
“We identified a significant relationship between high sugar availability and subsequently higher diabetes prevalence rates, not vice versa.”
§ The Relationship of Sugar to Population-Level Diabetes Prevalence: An Econometric Analysis of Repeated Cross-Sectional Data > Results > Additional robustness checks
plaindirect- Asserted: passes — The authors put it forward as true.
- Checkable: passes — It can be checked against evidence.
- Load-bearing: passes — The paper’s conclusions depend on it.
- Based: passes — The paper gives a reason why it holds.
It may state two separate claims as one.
A result the paper reports from its own data — it cites no other source for it, so there is none to check. The quote shows it is in the paper.
In the paper
“As shown in Table 2 , the fraction of total calories arising from sugar was the only significant food fraction correlated with diabetes, with a 1% rise in the fraction of total food calories as sugar corresponding to a 0.167% rise in diabetes prevalence.”
§ The Relationship of Sugar to Population-Level Diabetes Prevalence: An Econometric Analysis of Repeated Cross-Sectional Data > Results > Tests of sugar exposure
plaincorrelational- Asserted: passes — The authors put it forward as true.
- Checkable: passes — It can be checked against evidence.
- Load-bearing: passes — The paper’s conclusions depend on it.
- Based: passes — The paper gives a reason why it holds.
It may state two separate claims as one.
- Rests on an assumption: Food supply data on market availability accurately reflect population-level sugar intake or consumption.
- Rests on an assumption: International Diabetes Federation diabetes prevalence estimates are valid and comparable across countries and years.
The paper states this without a source or data behind it here, so there is nothing to check it against. The quote shows it is in the paper.
In the paper
“Conversely, diabetes prevalence in New Zealand declined from 8% in 2000 to 5% in 2010 while obesity rates in the country rose from 23% to 34% during that decade.”
§ The Relationship of Sugar to Population-Level Diabetes Prevalence: An Econometric Analysis of Repeated Cross-Sectional Data > Introduction
plain- Asserted: passes — The authors put it forward as true.
- Checkable: passes — It can be checked against evidence.
- Load-bearing: passes — The paper’s conclusions depend on it.
- Based: passes — The paper gives a reason why it holds.
It may state two separate claims as one.
A result the paper reports from its own data — it cites no other source for it, so there is none to check. The quote shows it is in the paper.
In the paper
“The results were strengthened: a 150 kcal/person/day rise in sugar availability corresponded to a 1.2% rise in diabetes prevalence (p<0.001) as opposed to a 1.1% rise when outliers were included.”
§ The Relationship of Sugar to Population-Level Diabetes Prevalence: An Econometric Analysis of Repeated Cross-Sectional Data > Results > Additional robustness checks
boostedcorrelational- Asserted: passes — The authors put it forward as true.
- Checkable: passes — It can be checked against evidence.
- Load-bearing: unclear — It is unclear whether the paper’s conclusions depend on it.
- Based: passes — The paper gives a reason why it holds.
It may state two separate claims as one.
- Rests on an assumption: No direct measures of actual human consumption that account for food wastage and provide precise measures of food consumption internationally exist.
The paper states this without a source or data behind it here, so there is nothing to check it against. The quote shows it is in the paper.
In the paper
“Similarly, in our analysis, many foods did not have significant correlations to diabetes prevalence at the population level, even though they are associated with diabetes in cohort or clinical trial studies.”
§ The Relationship of Sugar to Population-Level Diabetes Prevalence: An Econometric Analysis of Repeated Cross-Sectional Data > Discussion
plain- Asserted: passes — The authors put it forward as true.
- Checkable: passes — It can be checked against evidence.
- Load-bearing: passes — The paper’s conclusions depend on it.
- Based: passes — The paper gives a reason why it holds.
It may state two separate claims as one.
A result the paper reports from its own data — it cites no other source for it, so there is none to check. The quote shows it is in the paper.
In the paper
“Other societal factors associated with diabetes were those classically associated with metabolic syndrome; including income, urbanization and aging.”
§ The Relationship of Sugar to Population-Level Diabetes Prevalence: An Econometric Analysis of Repeated Cross-Sectional Data > Discussion
plaincorrelational- Asserted: passes — The authors put it forward as true.
- Checkable: passes — It can be checked against evidence.
- Load-bearing: unclear — It is unclear whether the paper’s conclusions depend on it.
- Based: passes — The paper gives a reason why it holds.
It may state two separate claims as one.
A conclusion the paper draws from its own results — it cites no other source for it, so there is none to check. The quote shows it is in the paper.
In the paper
“we identified that sugar availability appears to be uniquely correlated to diabetes prevalence independent of overweight and obesity prevalence rates, unlike other food types and total consumption, and independent of other changes in economic and social change such as urbanization, aging, changes to household income, sedentary lifestyles and tobacco or alcohol use.”
§ The Relationship of Sugar to Population-Level Diabetes Prevalence: An Econometric Analysis of Repeated Cross-Sectional Data > Discussion
hedgedcorrelational- Asserted: passes — The authors put it forward as true.
- Checkable: passes — It can be checked against evidence.
- Load-bearing: passes — The paper’s conclusions depend on it.
- Based: passes — The paper gives a reason why it holds.
It may state two separate claims as one.
- Rests on an assumption: No direct measures of actual human consumption that account for food wastage and provide precise measures of food consumption internationally exist.
In the paper
“Similarly, variables capturing urbanization and aging populations were associated with diabetes prevalence; however these variables fell from significance as total food availability and obesity were incorporated into the model ( Table 1 ), suggesting that calorie consumption and obesity are among the pathways by which these other factors may contribute to diabetes, consistent with cross-sectional”
§ The Relationship of Sugar to Population-Level Diabetes Prevalence: An Econometric Analysis of Repeated Cross-Sectional Data > Results > Correlates of diabetes prevalence
What the sources say
- Not checked yetcites [37] KR Siegel, 2012, Societal correlates of diabetes prevalence: an analysis across 94 countries, Diabetes Res Clin Pract source
hedgedconditional- Asserted: passes — The authors put it forward as true.
- Checkable: passes — It can be checked against evidence.
- Load-bearing: passes — The paper’s conclusions depend on it.
- Based: passes — The paper gives a reason why it holds.
It may state two separate claims as one.
- Rests on an assumption: Food supply data on market availability accurately reflect population-level sugar intake or consumption.
- Rests on an assumption: International Diabetes Federation diabetes prevalence estimates are valid and comparable across countries and years.
In the paper
“We also modeled the hazard of having high sugar availability rates in each country, and used this constructed hazard variable to explicitly control for potential unobserved selection bias (a “Heckman selection model”, see Text S1) [29].”
§ The Relationship of Sugar to Population-Level Diabetes Prevalence: An Econometric Analysis of Repeated Cross-Sectional Data > Methods
What the sources say
- Not checked yetcites [29] J Heckman, 2004, Using matching, instrumental variables and control functions to estimate economic choice models, Rev Econ Stat source
plain- Asserted: passes — The authors put it forward as true.
- Checkable: passes — It can be checked against evidence.
- Load-bearing: passes — The paper’s conclusions depend on it.
- Based: passes — The paper gives a reason why it holds.
It may state two separate claims as one.
A conclusion the paper draws from its own results — it cites no other source for it, so there is none to check. The quote shows it is in the paper.
In the paper
“When obesity was removed from the model, the effect size of sugar was not significantly amplified (beta = 0.0081, p<0.001), suggesting that obesity does not appear to account for the major part of the impact of sugar on diabetes.”
§ The Relationship of Sugar to Population-Level Diabetes Prevalence: An Econometric Analysis of Repeated Cross-Sectional Data > Results > Correlates of diabetes prevalence
hedged- Asserted: passes — The authors put it forward as true.
- Checkable: passes — It can be checked against evidence.
- Load-bearing: passes — The paper’s conclusions depend on it.
- Based: passes — The paper gives a reason why it holds.
It may state two separate claims as one.
- Rests on an assumption: Food supply data on market availability accurately reflect population-level sugar intake or consumption.
- Rests on an assumption: International Diabetes Federation diabetes prevalence estimates are valid and comparable across countries and years.
In the paper
“First, a Hausman test [28] was performed to test whether factors that differ across countries such as the differing strength of diabetes surveillance systems would systematically affect our results, ensuring the available data were suitable to answer our research questions.”
§ The Relationship of Sugar to Population-Level Diabetes Prevalence: An Econometric Analysis of Repeated Cross-Sectional Data > Methods
What the sources say
- Not checked yetcites [28] JA Hausman, 1978, Specification tests in econometrics, Econometrica source
plain- Asserted: passes — The authors put it forward as true.
- Checkable: passes — It can be checked against evidence.
- Load-bearing: passes — The paper’s conclusions depend on it.
- Based: passes — The paper gives a reason why it holds.
Probably not a substantial claim.
None of the sources cited for this claim have been checked yet.
In the paper
“Sugary foods have been significantly associated with the development of insulin resistance in laboratory-based studies [18], [19].”
§ The Relationship of Sugar to Population-Level Diabetes Prevalence: An Econometric Analysis of Repeated Cross-Sectional Data > Introduction
What the sources say
- Not checked yetcites [18] KL Teff, 2009, Endocrine and metabolic effects of consuming fructose- and glucose-sweetened beverages with meals in obese men and women: influence of insulin resistance on plasma triglyceride responses, J Clin Endocrinol Metab source
- Not checked yetcites [19] AA Bremer, 2011, Fructose-fed rhesus monkeys: a nonhuman primate model of insulin resistance, metabolic syndrome, and type 2 diabetes, Clin Transl Sci source
plaincorrelational- Asserted: passes — The authors put it forward as true.
- Checkable: passes — It can be checked against evidence.
- Load-bearing: fails — The paper’s conclusions may not depend on it.
- Based: passes — The paper gives a reason why it holds.
Probably not a substantial claim. The paper’s conclusions may not depend on it.
In the paper
“Lastly, a high prevalence of smoking and heavy alcohol use have been associated with diabetes [5].”
§ The Relationship of Sugar to Population-Level Diabetes Prevalence: An Econometric Analysis of Repeated Cross-Sectional Data > Results > Additional control variables
What the sources say
- Not checked yetcites [5] FB Hu, 2011, Globalization of diabetes: the role of diet, lifestyle, and genes, Diab Care source
plaincorrelational- Asserted: passes — The authors put it forward as true.
- Checkable: passes — It can be checked against evidence.
- Load-bearing: fails — The paper’s conclusions may not depend on it.
- Based: passes — The paper gives a reason why it holds.
Probably not a substantial claim. The paper’s conclusions may not depend on it. It may state two separate claims as one.
None of the sources cited for this claim have been checked yet.
In the paper
“Sugars added to processed food, in particular the monosaccharide fructose, can contribute to obesity [14], but also appear to have properties that increase diabetes risk independently from obesity [15].”
§ The Relationship of Sugar to Population-Level Diabetes Prevalence: An Econometric Analysis of Repeated Cross-Sectional Data > Introduction
What the sources say
- Not checked yetcites [14] RJ Johnson, 2007, Potential role of sugar (fructose) in the epidemic of hypertension, obesity and the metabolic syndrome, diabetes, kidney disease, and cardiovascular disease, Am J Clin Nutr source
- Not checked yetcites [15] Malik VS, Hu FB (2012) Sweeteners and risk of obesity and type 2 diabetes: the role of sugar-sweetened beverages. Curr Diab Rep epub Jan 31.
hedgeddirect- Asserted: passes — The authors put it forward as true.
- Checkable: passes — It can be checked against evidence.
- Load-bearing: passes — The paper’s conclusions depend on it.
- Based: passes — The paper gives a reason why it holds.
It may state two separate claims as one.
In the paper
“We also performed Granger-causality tests, which use the temporal nature of the data to test whether high sugar availability preceded an increase in diabetes (“precedence”) or whether high diabetes prevalence preceded high sugar availability [34] (see Text S1).”
§ The Relationship of Sugar to Population-Level Diabetes Prevalence: An Econometric Analysis of Repeated Cross-Sectional Data > Methods
What the sources say
- Not checked yetcites [34] CWJ Granger, 1969, Investigating causal relations by econometric models and cross-spectral methods, Econometrica
plaindirect- Asserted: passes — The authors put it forward as true.
- Checkable: passes — It can be checked against evidence.
- Load-bearing: fails — The paper’s conclusions may not depend on it.
- Based: passes — The paper gives a reason why it holds.
Probably not a substantial claim. The paper’s conclusions may not depend on it. It may state two separate claims as one.
What the paper did — it cites no source for this, so there is none to check. The quote shows it is in the paper.
In the paper
“(It is possible that weight gain, rather than overt obesity, might account for some of the changes in diabetes, hence our models were repeated with overweight prevalence rather than obesity in Table S3, and with measures of physical inactivity rather than BMI in Table S4, but the results did not change).”
§ The Relationship of Sugar to Population-Level Diabetes Prevalence: An Econometric Analysis of Repeated Cross-Sectional Data > Results > Correlates of diabetes prevalence
plain- Asserted: passes — The authors put it forward as true.
- Checkable: passes — It can be checked against evidence.
- Load-bearing: unclear — It is unclear whether the paper’s conclusions depend on it.
- Based: passes — The paper gives a reason why it holds.
It may state two separate claims as one.
- Rests on an assumption: Food supply data on market availability accurately reflect population-level sugar intake or consumption.
- Rests on an assumption: International Diabetes Federation diabetes prevalence estimates are valid and comparable across countries and years.
A conclusion the paper draws from its own results — it cites no other source for it, so there is none to check. The quote shows it is in the paper.
In the paper
“We found that obesity appeared to exacerbate, but not confound, the impact of sugar availability on diabetes prevalence”
§ The Relationship of Sugar to Population-Level Diabetes Prevalence: An Econometric Analysis of Repeated Cross-Sectional Data > Discussion
hedgedconditional- Asserted: passes — The authors put it forward as true.
- Checkable: passes — It can be checked against evidence.
- Load-bearing: passes — The paper’s conclusions depend on it.
- Based: passes — The paper gives a reason why it holds.
It may state two separate claims as one.
- Rests on an assumption: No direct measures of actual human consumption that account for food wastage and provide precise measures of food consumption internationally exist.
What the paper did — it cites no source for this, so there is none to check. The quote shows it is in the paper.
In the paper
“In all analyses, food availability data were age-adjusted, regressions were population weighted, and robust standard errors were computed to ensure stability of the results in the face of heteroskedasticity and intragroup correlations.”
§ The Relationship of Sugar to Population-Level Diabetes Prevalence: An Econometric Analysis of Repeated Cross-Sectional Data > Methods
plain- Asserted: passes — The authors put it forward as true.
- Checkable: passes — It can be checked against evidence.
- Load-bearing: passes — The paper’s conclusions depend on it.
- Based: passes — The paper gives a reason why it holds.
Probably not a substantial claim. It may state two separate claims as one.
In the paper
“We conducted explicit model selection procedures using Generalized Estimating Equations (see results in Text S1) to ensure the model was an optimal choice for the given data [30].”
§ The Relationship of Sugar to Population-Level Diabetes Prevalence: An Econometric Analysis of Repeated Cross-Sectional Data > Methods
What the sources say
- Not checked yetcites [30] Hardin JW, Hilbe JM (2003) Generalized estimating equations. Boca Raton: CRC Press. source
plain- Asserted: passes — The authors put it forward as true.
- Checkable: passes — It can be checked against evidence.
- Load-bearing: fails — The paper’s conclusions may not depend on it.
- Based: passes — The paper gives a reason why it holds.
Probably not a substantial claim. The paper’s conclusions may not depend on it.
None of the sources cited for this claim have been checked yet.
In the paper
“Reactive oxygen species are produced by the Maillard reaction [20], [21], damaging pancreatic beta cells, and leading to a subcellular stress response (the “unfolded protein response” in the endoplasmic reticulum) that drives insulin inadequacy [22], [23].”
§ The Relationship of Sugar to Population-Level Diabetes Prevalence: An Econometric Analysis of Repeated Cross-Sectional Data > Introduction
What the sources say
- Not checked yetcites [20] CG Schalkwijk, 2004, Fructose-mediated non-enzymatic glycation: sweet coupling or bad modification, Diabetes Metab Res source
- Not checked yetcites [21] WL Dills, 1993, Protein fructosylation: fructose and the Maillard reaction, Am J Clin Nutr source
- Not checked yetcites [22] CX Santos, 2009, Mechanisms and implications of reactive oxygen species generation during the unfolded protein response: roles of endoplasmic reticulum oxidoreductases, mitochondrial electron transport, and NADPH oxidase, Antioxid Redox Signal source
plaindirect- Asserted: passes — The authors put it forward as true.
- Checkable: passes — It can be checked against evidence.
- Load-bearing: unclear — It is unclear whether the paper’s conclusions depend on it.
- Based: passes — The paper gives a reason why it holds.
It may state two separate claims as one.
None of the sources cited for this claim have been checked yet.
In the paper
“The observed associations are biologically plausible, given the numerous mechanisms by which sugar foments pathophysiologic processes leading to diabetes [19], [40].”
§ The Relationship of Sugar to Population-Level Diabetes Prevalence: An Econometric Analysis of Repeated Cross-Sectional Data > Discussion
What the sources say
- Not checked yetcites [19] AA Bremer, 2011, Fructose-fed rhesus monkeys: a nonhuman primate model of insulin resistance, metabolic syndrome, and type 2 diabetes, Clin Transl Sci source
- Not checked yetcites [40] JS Lim, 2010, The role of fructose in the pathogenesis of NAFLD and the metabolic syndrome, Nat Rev Gastroenterol Hepatol source
plaindirect- Asserted: passes — The authors put it forward as true.
- Checkable: fails — It may be too vague to check against evidence.
- Load-bearing: fails — The paper’s conclusions may not depend on it.
- Based: passes — The paper gives a reason why it holds.
Probably not a substantial claim. It may be too vague to check against evidence. The paper’s conclusions may not depend on it.
What the paper did — it cites no source for this, so there is none to check. The quote shows it is in the paper.
In the paper
“It is thought that much of the FAO data on foods and nutrients in the food supply have limits to their reliability, and that IDF data and WHO data on obesity prevalence are difficult to validate independently.”
§ The Relationship of Sugar to Population-Level Diabetes Prevalence: An Econometric Analysis of Repeated Cross-Sectional Data > Discussion
hedged- Asserted: passes — The authors put it forward as true.
- Checkable: passes — It can be checked against evidence.
- Load-bearing: fails — The paper’s conclusions may not depend on it.
- Based: fails — The paper may give no reason why it holds.
Probably not a substantial claim. The paper’s conclusions may not depend on it. The paper may give no reason why it holds. It may state two separate claims as one.
What the paper did — it cites no source for this, so there is none to check. The quote shows it is in the paper.
In the paper
“our ecological approach limits statistical power as one makes inferences about individuals based on aggregates; age, sex, and racial predictions are lost.”
§ The Relationship of Sugar to Population-Level Diabetes Prevalence: An Econometric Analysis of Repeated Cross-Sectional Data > Discussion
plain- Asserted: passes — The authors put it forward as true.
- Checkable: passes — It can be checked against evidence.
- Load-bearing: fails — The paper’s conclusions may not depend on it.
- Based: passes — The paper gives a reason why it holds.
Probably not a substantial claim. The paper’s conclusions may not depend on it. It may state two separate claims as one.
What the paper did — it cites no source for this, so there is none to check. The quote shows it is in the paper.
In the paper
“the International Diabetes Federation database contains diabetes prevalence data based on multiple surveys of varying quality; as many diabetics go undiagnosed, these are likely underestimates, and do not distinguish between Type 1 (approximately 10%) and Type 2 diabetes (90%)”
§ The Relationship of Sugar to Population-Level Diabetes Prevalence: An Econometric Analysis of Repeated Cross-Sectional Data > Discussion
hedged- Asserted: passes — The authors put it forward as true.
- Checkable: passes — It can be checked against evidence.
- Load-bearing: passes — The paper’s conclusions depend on it.
- Based: passes — The paper gives a reason why it holds.
It may state two separate claims as one.
What the paper did — it cites no source for this, so there is none to check. The quote shows it is in the paper.
In the paper
“as with all cross-country analyses, the potential exists for ecological fallacies.”
§ The Relationship of Sugar to Population-Level Diabetes Prevalence: An Econometric Analysis of Repeated Cross-Sectional Data > Discussion
hedged- Asserted: passes — The authors put it forward as true.
- Checkable: fails — It may be too vague to check against evidence.
- Load-bearing: fails — The paper’s conclusions may not depend on it.
- Based: passes — The paper gives a reason why it holds.
Probably not a substantial claim. It may be too vague to check against evidence. The paper’s conclusions may not depend on it.
A conclusion the paper draws from its own results — it cites no other source for it, so there is none to check. The quote shows it is in the paper.
In the paper
“the sugar-diabetes relationship appeared to meet criteria for temporal causality without being the result of selection biases or the effect of secular trends that may be artifacts of economic development or changes in surveillance.”
§ The Relationship of Sugar to Population-Level Diabetes Prevalence: An Econometric Analysis of Repeated Cross-Sectional Data > Discussion
hedgedconditional- Asserted: passes — The authors put it forward as true.
- Checkable: passes — It can be checked against evidence.
- Load-bearing: passes — The paper’s conclusions depend on it.
- Based: passes — The paper gives a reason why it holds.
It may state two separate claims as one.
What the paper did — it cites no source for this, so there is none to check. The quote shows it is in the paper.
In the paper
“our analysis cannot distinguish between any specific added sugars, such as HFCS or sucrose, or between any specific vehicle, such as soda or processed food.”
§ The Relationship of Sugar to Population-Level Diabetes Prevalence: An Econometric Analysis of Repeated Cross-Sectional Data > Discussion
plain- Asserted: passes — The authors put it forward as true.
- Checkable: passes — It can be checked against evidence.
- Load-bearing: passes — The paper’s conclusions depend on it.
- Based: passes — The paper gives a reason why it holds.
It may state two separate claims as one.
None of the sources cited for this claim have been checked yet.
In the paper
“In other countries, supply and consumption are more closely aligned [41], and differential wastage among foodstuffs does not appear to occur [42].”
§ The Relationship of Sugar to Population-Level Diabetes Prevalence: An Econometric Analysis of Repeated Cross-Sectional Data > Discussion
What the sources say
- Not checked yetcites [41] Gustavsson J, Cederberg C, Sonesson U, van Otterdijk R, Meybeck A (2011) Global food losses and food waste. Rome: Food and Agriculture Organization.
- Not checked yetcites [42] Muth MK, Karns SA, Nielsen SJ, Buzby JC, Wells HF (2011) Consumer-level food loss estimates and their use in the ERS loss-adjusted food availability data. Washngton, D.C.: U.S. Dept. of Agriculture.
hedgedcorrelational- Asserted: passes — The authors put it forward as true.
- Checkable: passes — It can be checked against evidence.
- Load-bearing: passes — The paper’s conclusions depend on it.
- Based: passes — The paper gives a reason why it holds.
It may state two separate claims as one.
- Rests on an assumption: No direct measures of actual human consumption that account for food wastage and provide precise measures of food consumption internationally exist.
What the paper did — it cites no source for this, so there is none to check. The quote shows it is in the paper.
In the paper
“these data are known to be highly imperfect.”
§ The Relationship of Sugar to Population-Level Diabetes Prevalence: An Econometric Analysis of Repeated Cross-Sectional Data > Discussion
boosted- Asserted: passes — The authors put it forward as true.
- Checkable: passes — It can be checked against evidence.
- Load-bearing: passes — The paper’s conclusions depend on it.
- Based: passes — The paper gives a reason why it holds.
Probably not a substantial claim.
The paper relies on this without support.
Food supply data on market availability accurately reflect population-level sugar intake or consumption.
“We used United Nations Food and Agricultural Organization food supply data [26] to capture market availability of different food items (sugars, fibers, fruits, meats, cereals, oils, and total food) in kilocalories per person per day in each country for each year of the analysis.”
The paper relies on this without support.
International Diabetes Federation diabetes prevalence estimates are valid and comparable across countries and years.
“The dependent variables in the analysis were International Diabetes Federation estimates of diabetes prevalence among persons aged 20 to 79 years old from 2000 through 2010 [6].”
The paper relies on this without support.
No direct measures of actual human consumption that account for food wastage and provide precise measures of food consumption internationally exist.
“as there are no direct measures of actual human consumption that can account for food wastage and provide precise measures of food consumption internationally.”
Claims other papers make about this one
Each is checked against this paper’s own text: does it say what the citing paper says it does?
In the citing paper
“In the 1985 to 2005 period extensive added sugar intake occurred across HIC (55) but more recently large increases have occurred in LMIC, particularly in consumption of sugar-sweetened beverages and processed foods (56–59).”
From Food Consumption and its Impact on Cardiovascular Disease: Importance of Solutions Focused on the Globalized Food System (2015) · cites this paper as [56]
Citations
Cites
Investigating causal relations by econometric models and cross-spectral methods
Granger, C. W. J. (1969) · Econometrica · doi:10.2307/1912791 · Cited by 22,989
Specification Tests in Econometrics
Hausman, J. A. (1978) · Econometrica · doi:10.2307/1913827 · Cited by 18,820 · cited 1×
“First, a Hausman test [28] was performed to test whether factors that differ across countries such as the differing strength of diabetes surveillance systems would systematically affect our results, ensuring the available data were suitable to answer our research questions.”
MethodGlobal physical activity levels: surveillance progress, pitfalls, and prospects
Hallal, P. C., Andersen, L. B., Bull, F. C., Guthold, R., Haskell, W., & Ekelund, U. (2012) · The Lancet · doi:10.1016/s0140-6736(12)60646-1 · Cited by 5,711 · cited 1×
“We further tested the impact of introducing a measure of sedentary behavior, the estimated percentage of the population aged 15 years and older that is physically inactive from the International Physical Activity Questionnaire [31](defined as not meeting any of three criteria: (a) 5630 minutes of moderate-intensity ac…”
MethodInvestigating Causal Relations by Econometric Models and Cross-Spectral Methods
Granger, C. W. J. (2010) · Essays in Econometrics · doi:10.1017/cbo9780511753978.002 · Cited by 4,762
Danaei, G., Finucane, M. M., Lu, Y., Singh, G. M., Cowan, M. J., Paciorek, C. J., Lin, J. K., Farzadfar, F., Khang, Y.-H., Stevens, G. A., et al. (2011) · The Lancet · doi:10.1016/s0140-6736(11)60679-x · Cited by 3,568 · cited 1×
“Nearly 1 in 10 adults worldwide are now affected by diabetes [1].”
Background(2011) · FAO eBooks · Cited by 3,368
Hu, F. B. (2011) · Diabetes Care · doi:10.2337/dc11-0442 · Cited by 1,954 · cited 1×
“Lastly, a high prevalence of smoking and heavy alcohol use have been associated with diabetes [5].”
BackgroundObesity, Fat Distribution, and Weight Gain as Risk Factors for Clinical Diabetes in Men
Chan, J. M., Rimm, E. B., Colditz, G. A., Stampfer, M. J., & Willett, W. C. (1994) · Diabetes Care · doi:10.2337/diacare.17.9.961 · Cited by 1,808 · cited 1×
“About 20% of obese individuals appear to have normal insulin regulation and normal metabolic indices (no indication of diabetes) and normal longevity [8], while up to 40% of normal weight people in some populations manifest aspects of the ‘‘metabolic syndrome’’ [9–12].”
BackgroundGeneralized Estimating Equations
Hardin, J. W., & Hilbe, J. M. (2002) · doi:10.1201/9781420035285 · Cited by 1,766
Epidemic obesity and type 2 diabetes in Asia
Yoon, K.-H., Lee, J.-H., Kim, J.-W., Cho, J. H., Choi, Y.-H., Ko, S.-H., Zimmet, P., & Son, H.-Y. (2006) · The Lancet · doi:10.1016/s0140-6736(06)69703-1 · Cited by 1,580 · cited 1×
“05), consistent with the notion that economic development is a powerful correlate to diabetes prevalence [35,36].”
Background
Cited by
Sorted by citations
IDF Diabetes Atlas: Global estimates of diabetes prevalence for 2017 and projections for 2045
Cho, N. H., Shaw, J. E., Karuranga, S., Huang, Y., da Rocha Fernandes, J. D., Ohlrogge, A. W., & Malanda, B. (2018) · Diabetes Research and Clinical Practice · doi:10.1016/j.diabres.2018.02.023 · Cited by 7,283
IDF Diabetes Atlas: Global estimates for the prevalence of diabetes for 2015 and 2040
Ogurtsova, K., Fernandes, J. D. D. R., Huang, Y., Linnenkamp, U., Guariguata, L., Cho, N. H., Cavan, D. A., Shaw, J. E., & Makaroff, L. (2017) · Diabetes Research and Clinical Practice · doi:10.1016/j.diabres.2017.03.024 · Cited by 7,138
“There are many population-level diabetes risk factors that were not incorporated into the model, such as ethnicity [42], overweight [29], highest level of household education [40], household income [40], food security [40], sugar availability [4], percent of total energy intake from sugars and sweeteners [44], impaire…”
BackgroundAdded sugar intake and cardiovascular diseases mortality among US adults
Yang, Q., Zhang, Z., Gregg, E. W., Flanders, W. D., Merritt, R., & Hu, F. B. (2014) · JAMA Internal Medicine · doi:10.1001/jamainternmed.2013.13563 · Cited by 947
“The number needed to harm at 15 years of follow-up (median follow-up) reduced from 265 (95% CI, 166-715) to 22 (13-66) (Table 2).”
Beyond weight loss: a review of the therapeutic uses of very-low-carbohydrate (ketogenic) diets
Paoli, A., Rubini, A., Volek, J. S., & Grimaldi, K. A. (2013) · European Journal of Clinical Nutrition · doi:10.1038/ejcn.2013.116 · Cited by 885
Dietary quality among men and women in 187 countries in 1990 and 2010: a systematic assessment
Imamura, F., Micha, R., Khatibzadeh, S., Fahimi, S., Shi, P., Powles, J., & Mozaffarian, D. (2015) · The Lancet Global Health · doi:10.1016/s2214-109x(14)70381-x · Cited by 834
Metadata
- Authors
- Basu, S., Yoffe, P., Hills, N., & Lustig, R. H.
- Affiliations
- Stanford University (US)
- University of California, Berkeley (US)
- University of California, San Francisco (US)
- Corresponding author
- Basu, Sanjay
- Venue
- PLoS ONE
- Publisher
- Public Library of Science (PLoS)
- Published
- 2013-02-27
- Volume
- 8
- Issue
- 2
- Pages
- e57873
- ISSN
- 1932-6203 (ISSN-L)
- PMC
- PMC3584048
- OpenAlex
- W2014750665
- Cited by
- 435
- References
- 43
- Citations by year
- 2026: 11 · 2025: 10 · 2024: 16 · 2023: 21 · 2022: 29 · 2021: 66 · 2020: 37 · 2019: 31 · 2018: 34 · 2017: 34 · 2016: 48 · 2015: 41 · 2014: 31 · 2013: 23
- FWCI
- 37.57
- Type
- journal article
- Language
- en
- Open access
- gold
- doi.org
- Locations
- PLoS ONE (publishedVersion, cc-by)
- Europe PMC (PubMed Central) (publishedVersion, cc-by)
- PubMed Central (publishedVersion, cc-by)
- PubMed (publishedVersion)
- RePEc: Research Papers in Economics (submittedVersion)
- DOAJ (DOAJ: Directory of Open Access Journals) (submittedVersion, cc-by-sa)
- eScholarship (California Digital Library) (submittedVersion)
- Figshare (submittedVersion, cc-by)
- Topics
- Health Sciences › Medicine › Endocrinology, Diabetes and Metabolism › Diet, Metabolism, and Disease
- Health Sciences › Medicine › Public Health, Environmental and Occupational Health › Obesity, Physical Activity, Diet
- Health Sciences › Medicine › Endocrinology, Diabetes and Metabolism › Diabetes, Cardiovascular Risks, and Lipoproteins
- Keywords
- sugar consumption, type 2 diabetes, diabetes prevalence, sugar availability, soft drink consumption, obesity, dietary exposure, dose-response relationship, cross-national comparison, socioeconomic determinants of health, urbanization, income
- MeSH terms
- Adult, Aged, Energy Intake, Carbohydrates, Cross-Sectional Studies, Diabetes Mellitus, Type 2, Humans, Middle Aged, Obesity, Selection Bias, Prevalence, Models, Econometric, Young Adult
About these checks
Registry, retraction, Cites and statistics results are computed, not judged, with one exception: a printed reference that no index lists is read once by a model before it counts as a citation error. Claims are extracted by a model and kept only when their quote appears verbatim in the text; each cited source is then checked, with a model’s help, for whether it says what the claim relies on. Those verdicts can be wrong — read the claim’s quote and the cited source before relying on one.
A language model drew the claims from the paper on 2026-10-10, under version 3 of the claim definition (model deepseek-v4.1-flash, prompt extract-v3).
A second model labelled each claim on 2026-10-10 (model jev-1.13-20260917, definition revision gold-guideline-v0.2).
Cited sources are checked with a language model’s help (gpt-6-sol).
Statistics and arithmetic are recomputed, not judged.
Confidence bands are shown only for fields calibrated on our annotated test set. None is calibrated yet, so no band is shown.
What counts as a claim ›How we measure confidence ›How we check this ›
Are you an author, or do you see a problem with this page? Request a review
