

The DOI matches its Crossref record; 82 of the 82 references it cites were found in a registry or an index.
Phylogenetic analysis reveals a cryptic species Blastomyces gilchristii, sp. nov. within the human pathogenic fungus Blastomyces dermatitidis.
Open accessAbstract
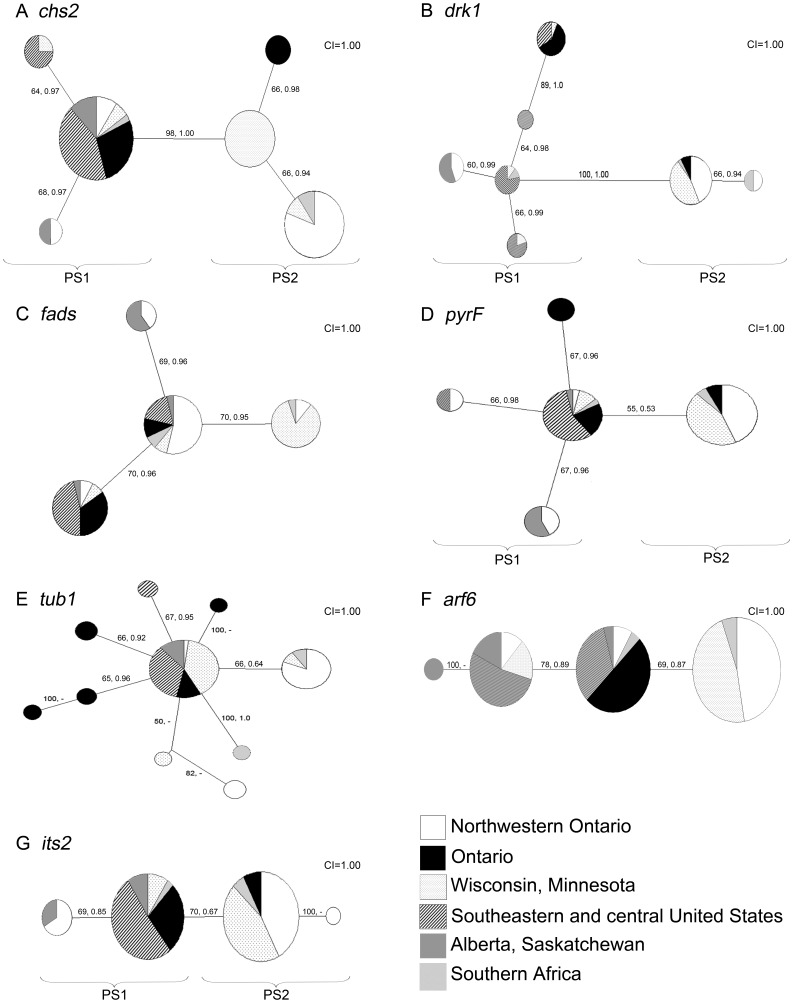
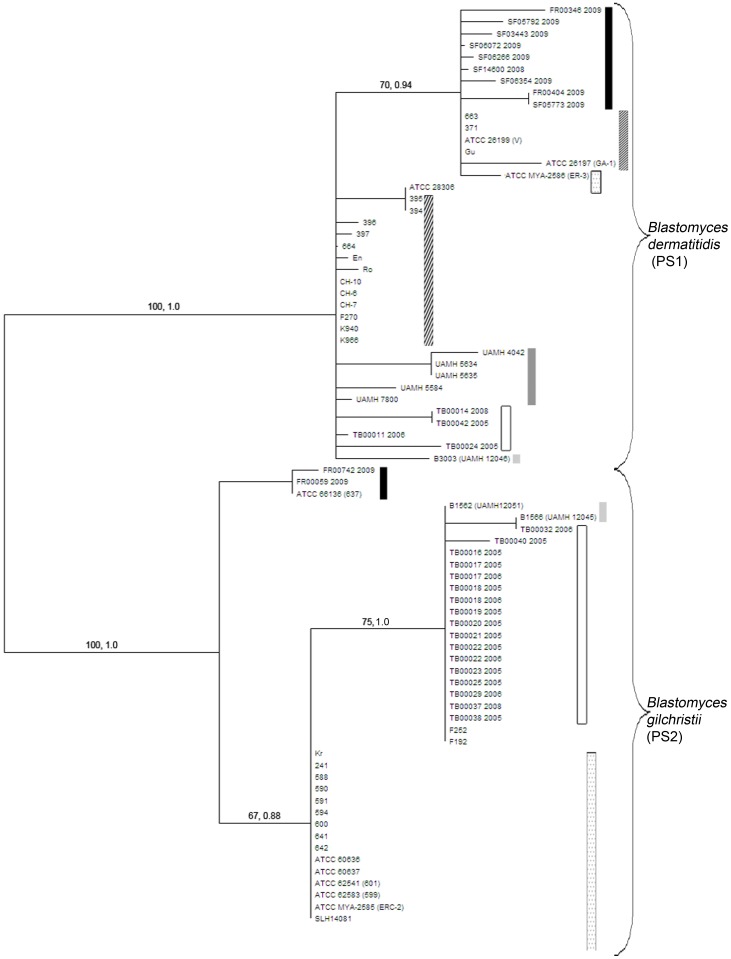
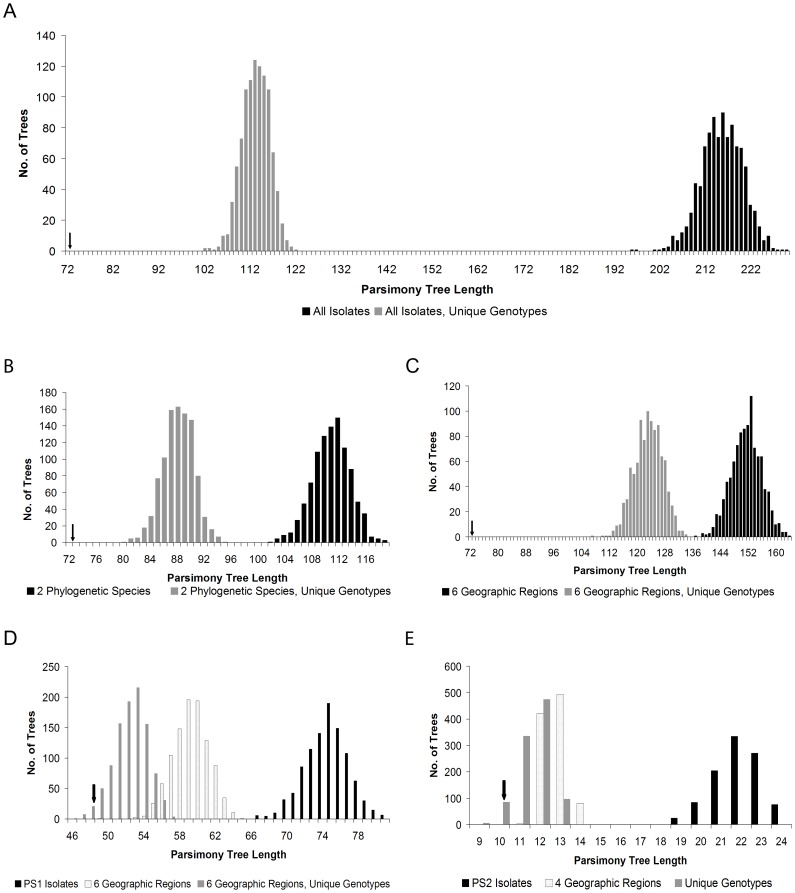
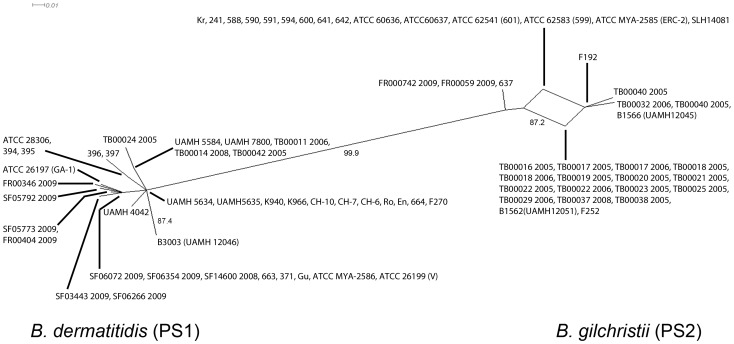
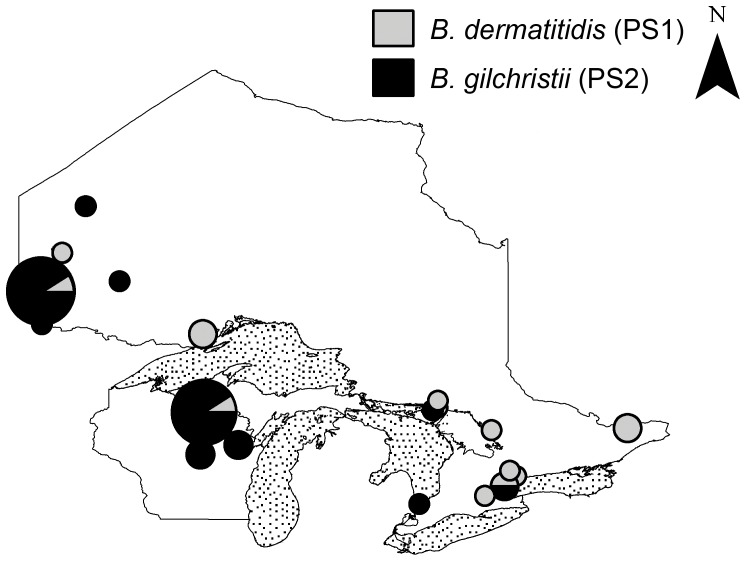
BACKGROUND: Analysis of the population genetic structure of microbial species is of fundamental importance to many scientific disciplines because it can identify cryptic species, reveal reproductive mode, and elucidate processes that contribute to pathogen evolution. Here, we examined the population genetic structure and geographic differentiation of the sexual, dimorphic fungus Blastomyces dermatitidis, the causative agent of blastomycosis. METHODOLOGY/PRINCIPAL FINDINGS: Criteria for Genealogical Concordance Phylogenetic Species Recognition (GCPSR) applied to seven nuclear loci (arf6, chs2, drk1, fads, pyrF, tub1, and its-2) from 78 clinical and environmental isolates identified two previously unrecognized phylogenetic species. Four of seven single gene phylogenies examined (chs2, drk1, pyrF, and its-2) supported the separation of Phylogenetic Species 1 (PS1) and Phylogenetic Species 2 (PS2) which were also well differentiated in the concatenated chs2-drk1-fads-pyrF-tub1-arf6-its2 genealogy with all isolates falling into one of two evolutionarily independent lineages. Phylogenetic species were genetically distinct with interspecific divergence 4-fold greater than intraspecific divergence and a high Fst value (0.772, P<0.001) indicative of restricted gene flow between PS1 and PS2. Whereas panmixia expected of a single freely recombining population was not observed, recombination was detected when PS1 and PS2 were assessed separately, suggesting reproductive isolation. Random mating among PS1 isolates, which were distributed across North America, was only detected after partitioning isolates into six geographic regions. The PS2 population, found predominantly in the hyper-endemic regions of northwestern Ontario, Wisconsin, and Minnesota, contained a substantial clonal component with random mating detected only among unique genotypes in the population. CONCLUSIONS/SIGNIFICANCE: These analyses provide evidence for a genetically divergent clade within Blastomyces dermatitidis, which we use to describe a novel species, Blastomyces gilchristii sp. nov. In addition, we discuss the value of population genetic and phylogenetic analyses as a foundation for disease surveillance, understanding pathogen evolution, and discerning phenotypic differences between phylogenetic species.
Overview
The claims and statistics of this paper haven’t been checked yet.
Run the check — free, no account needed. It reads the open-access text and checks the sources it cites.
Integrity signals
Registry
Cites
Statistics
Figures
Verification
Claims the paper makes
The claims and statistics of this paper haven’t been checked yet.
Run the check — free, no account needed. It reads the open-access text and checks the sources it cites.
Claims other papers make about this one
Each is checked against this paper’s own text: does it say what the citing paper says it does?
In the citing paper
“Blastomycosis is an uncommon but underdiagnosed and potentially life-threatening infection caused by the dimorphic fungi Blastomyces dermatitidis, which includes at least 1 cryptic subspecies, B. gilchristii [170].”
From Race and ethnicity: Risk factors for fungal infections? (2023) · cites this paper as [170]
Self-check
Percentages, sums and reported differences re-computed from the paper’s own numbers.
The self-check needs the paper’s full text.
Citations
Cites
Amplification and direct sequencing of fungal ribosomal RNA genes for phylogenetics
White, T. J., Bruns, T., Lee, S., & Taylor, J. (1990) · PCR Protocols · doi:10.1016/b978-0-12-372180-8.50042-1 · Cited by 36,648
MrBayes 3: Bayesian phylogenetic inference under mixed models
Ronquist, F., & Huelsenbeck, J. P. (2003) · Bioinformatics · doi:10.1093/bioinformatics/btg180 · Cited by 29,194
DnaSP v5: a software for comprehensive analysis of DNA polymorphism data
Librado, P., & Rozas, J. (2009) · Bioinformatics · doi:10.1093/bioinformatics/btp187 · Cited by 16,147
jModelTest: Phylogenetic Model Averaging
Posada, D. (2008) · Molecular Biology and Evolution · doi:10.1093/molbev/msn083 · Cited by 10,578
Application of Phylogenetic Networks in Evolutionary Studies
Huson, D. H., & Bryant, D. (2005) · Molecular Biology and Evolution · doi:10.1093/molbev/msj030 · Cited by 8,895
Simple methods for estimating the numbers of synonymous and nonsynonymous nucleotide substitutions.
Nei, M., & Gojobori, T. (1986) · Molecular Biology and Evolution · doi:10.1093/oxfordjournals.molbev.a040410 · Cited by 4,904
Prokaryotes: The unseen majority
Whitman, W. B., Coleman, D. C., & Wiebe, W. J. (1998) · Proceedings of the National Academy of Sciences · doi:10.1073/pnas.95.12.6578 · Cited by 4,871
United Nations Environment Programme
Miller, N. N. (1987) · Brill | Nijhoff eBooks · doi:10.1163/9789004634169_010 · Cited by 3,699
White, T. C., Bruns, T. D., Lee, S., Taylor, F. J. R., White, T., Lee, S., Taylor, D. L., & Shawe‐Taylor, J. (1990) · Cited by 2,604
Phylogenetic Species Recognition and Species Concepts in Fungi
Taylor, J. W., Jacobson, D. J., Kroken, S., Kasuga, T., Geiser, D. M., Hibbett, D. S., & Fisher, M. C. (2000) · Fungal Genetics and Biology · doi:10.1006/fgbi.2000.1228 · Cited by 1,904
Smith, J. M., Smith, N. H., O'Rourke, M., & Spratt, B. G. (1993) · Proceedings of the National Academy of Sciences · doi:10.1073/pnas.90.10.4384 · Cited by 1,802
Hudson, R. R., & Kaplan, N. L. (1985) · Genetics · doi:10.1093/genetics/111.1.147 · Cited by 1,555
The magnitude of fungal diversity: the 1.5 million species estimate revisited * * Paper presented at
Hawksworth, D. (2001) · Mycological Research · doi:10.1017/s0953756201004725 · Cited by 1,545
A Simple and Robust Statistical Test for Detecting the Presence of Recombination
Bruen, T. C., Philippe, H., & Bryant, D. (2006) · Genetics · doi:10.1534/genetics.105.048975 · Cited by 1,366
Indices of multilocus linkage disequilibrium
Agapow, P., & Burt, A. (2001) · Molecular Ecology Notes · doi:10.1046/j.1471-8278.2000.00014.x · Cited by 1,196
Epidemiology of Invasive Mycoses in North America
Pfaller, M. A., & Diekema, D. J. (2010) · Critical Reviews in Microbiology · doi:10.3109/10408410903241444 · Cited by 901
MULTILOCUS STRUCTURE OF NATURAL POPULATIONS OF HORDEUM SPONTANEUM
Brown, A. H. D., Feldman, M. W., & Nevo, E. (1980) · Genetics · doi:10.1093/genetics/96.2.523 · Cited by 643
Cryptic speciation and recombination in the aflatoxin-producing fungus Aspergillus flavus
Geiser, D. M., Pitt, J. I., & Taylor, J. W. (1998) · Proceedings of the National Academy of Sciences · doi:10.1073/pnas.95.1.388 · Cited by 527
Split decomposition: A new and useful approach to phylogenetic analysis of distance data
Bandelt, H., & Dress, A. (1992) · Molecular Phylogenetics and Evolution · doi:10.1016/1055-7903(92)90021-8 · Cited by 504
Same-sex mating and the origin of the Vancouver Island Cryptococcus gattii outbreak
Fraser, J. A., Giles, S. S., Wenink, E. C., Geunes-Boyer, S. G., Wright, J. R., Diezmann, S., Allen, A., Stajich, J. E., Dietrich, F. S., Perfect, J. R., et al. (2005) · Nature · doi:10.1038/nature04220 · Cited by 499
Molecular markers reveal cryptic sex in the human pathogen Coccidioides immitis.
Burt, A., Carter, D. A., Koenig, G. L., White, T. J., & Taylor, J. W. (1996) · Proceedings of the National Academy of Sciences · doi:10.1073/pnas.93.2.770 · Cited by 467
Clinical and laboratory update on blastomycosis.
Saccente, M., & Woods, G. L. (2010) · Clinical Microbiology Reviews · doi:10.1128/cmr.00056-09 · Cited by 450
Fisher, M. C., Koenig, G. L., White, T. J., & Taylor, J. W. (2002) · Mycologia · doi:10.2307/3761847 · Cited by 450
Dettman, J. R., Jacobson, D. J., & Taylor, J. W. (2003) · Evolution · doi:10.1111/j.0014-3820.2003.tb01514.x · Cited by 435
Global Control of Dimorphism and Virulence in Fungi
Nemecek, J. C., Wüthrich, M., & Klein, B. S. (2006) · Science · doi:10.1126/science.1124105 · Cited by 380
Klein, B. S., Vergeront, J. M., Weeks, R. J., Kumar, U. N., Mathai, G., Varkey, B., Kaufman, L., Bradsher, R. W., Jf, S., Davis, J. P., et al. (1986) · New England Journal of Medicine · doi:10.1056/nejm198602273140901 · Cited by 375
Phylogenetic analysis reveals a high level of speciation in the Paracoccidioides genus
Teixeira, M. D. M., Theodoro, R. C., de Carvalho, M. J. A., Fernandes, L., Paes, H. C., Hahn, R. C., Mendoza, L., Bagagli, E., San-Blas, G., & Felipe, M. S. S. (2009) · Molecular Phylogenetics and Evolution · doi:10.1016/j.ympev.2009.04.005 · Cited by 372
Matute, D. R., McEwen, J. G., Puccia, R., Montes, B. A., San-Blas, G., Bagagli, E., Rauscher, J. T., Restrepo, Á., Morais, F., Niño‐Vega, G. A., et al. (2005) · Molecular Biology and Evolution · doi:10.1093/molbev/msj008 · Cited by 356
Phylogeography of the fungal pathogenHistoplasma capsulatum
Kasuga, T., White, T. J., Koenig, G. L., McEwen, J. G., Restrepo, Á., Castañeda, E., Lacaz, C. D. S., Heins‐Vaccari, E. M., de Freitas, R. S., Zancopé‐Oliveira, R. M., et al. (2003) · Molecular Ecology · doi:10.1046/j.1365-294x.2003.01995.x · Cited by 353
The Evolutionary Biology and Population Genetics Underlying Fungal Strain Typing
Taylor, J. W., Geiser, D. M., Burt, A., & Koufopanou, V. (1999) · Clinical Microbiology Reviews · doi:10.1128/cmr.12.1.126 · Cited by 338
Koufopanou, V., Burt, A., & Taylor, J. W. (1997) · Proceedings of the National Academy of Sciences · doi:10.1073/pnas.94.10.5478 · Cited by 301
Rachowicz, L. J., Hero, J., Alford, R. A., Taylor, J. W., Morgan, J. A. T., Vredenburg, V. T., Collins, J. P., & Briggs, C. J. (2005) · Conservation Biology · doi:10.1111/j.1523-1739.2005.00255.x · Cited by 268
CRYPTIC SPECIATION IN THE COSMOPOLITAN AND CLONAL HUMAN PATHOGENIC FUNGUS ASPERGILLUS FUMIGATUS
Pringle, A., Baker, D. M., Platt, J. L., Wares, J. P., Latgé, J. P., & Taylor, J. W. (2005) · Evolution · doi:10.1111/j.0014-3820.2005.tb01059.x · Cited by 267
Classification of fungal chitin synthases.
Bowen, A. R. S. G., Chen-Wu, J. L.-P., Momany, M., Young, R. A., Szaniszlo, P. J., & Robbins, P. W. (1992) · Proceedings of the National Academy of Sciences · doi:10.1073/pnas.89.2.519 · Cited by 258
Fisher, M. C., Koenig, G. L., White, T. J., San-Blas, G., Negroni, R., Alvarez, I. G., Wanke, B., & Taylor, J. W. (2001) · Proceedings of the National Academy of Sciences · doi:10.1073/pnas.071406098 · Cited by 257
Dettman, J. R., Jacobson, D. J., Turner, E., Pringle, A., & Taylor, J. W. (2003) · Evolution · doi:10.1111/j.0014-3820.2003.tb01515.x · Cited by 230
Klein, B. S., Vergeront, J. M., DiSalvo, A. F., Kaufman, L., & Davis, J. P. (1987) · American Review of Respiratory Disease · doi:10.1164/ajrccm/136.6.1333 · Cited by 190
Fungal multilocus sequence typing — it’s not just for bacteria
Taylor, J. W., & Fisher, M. C. (2003) · Current Opinion in Microbiology · doi:10.1016/s1369-5274(03)00088-2 · Cited by 176
Estimation of Nucleotide Substitution Rates in Eurotiomycete Fungi
Kasuga, T., White, T. J., & Taylor, J. W. (2002) · Molecular Biology and Evolution · doi:10.1093/oxfordjournals.molbev.a004056 · Cited by 171
Epidemiology and Clinical Spectrum of Blastomycosis Diagnosed at Manitoba Hospitals
Crampton, T. L., Light, R. B., Berg, G. M., Meyers, M. P., Schroeder, G. C., Hershfield, E. S., & Embil, J. M. (2002) · Clinical Infectious Diseases · doi:10.1086/340049 · Cited by 139
Alastruey‐Izquierdo, A., Hoffmann, K., de Hoog, S., Rodrı́guez-Tudela, J. L., Voigt, K., Bibashi, E., & Walther, G. (2010) · Journal of Clinical Microbiology · doi:10.1128/jcm.01744-09 · Cited by 138
Caullery, M. (1931) · Science · doi:10.1126/science.74.1915.254 · Cited by 132
A CASE OF PSEUDO-LUPUS VULGARIS CAUSED BY A BLASTOMYCES
Gilchrist, T. C., & Stokes, W. R. (1898) · The Journal of Experimental Medicine · doi:10.1084/jem.3.1.53 · Cited by 108
Koufopanou, V., Burt, A., Szaro, T. M., & Taylor, J. W. (2001) · Molecular Biology and Evolution · doi:10.1093/oxfordjournals.molbev.a003910 · Cited by 108
The epidemiology of blastomycosis in Illinois and factors associated with death
Dworkin, M. S., Duckro, A. N., Proia, L., Semel, J. D., & Huhn, G. (2005) · Clinical Infectious Diseases · doi:10.1086/498152 · Cited by 100
The microbe's contribution to biology
(1956) · Journal of the Franklin Institute · doi:10.1016/0016-0032(56)90154-5 · Cited by 98
Ecologic Niche Modeling of Blastomyces dermatitidis in Wisconsin
Reed, K. D., Meece, J. K., Archer, J. R., & Peterson, A. T. (2008) · PLoS ONE · doi:10.1371/journal.pone.0002034 · Cited by 97
Fisher, M. C., Koenig, G. L., White, T. J., & Taylor, J. W. (2000) · Molecular Biology and Evolution · doi:10.1093/oxfordjournals.molbev.a026399 · Cited by 95
Blastomycosis in Ontario, 1994–2003
Morris, S. K., Brophy, J. C., Richardson, S. E., Summerbell, R. C., Parkin, P. C., Jamieson, F., Limerick, B., Wiebe, L., & Ford‐Jones, E. L. (2006) · Emerging infectious diseases · doi:10.3201/eid1202.050849 · Cited by 94
Self-citationThe Microbe's Contribution to Biology
Kluyver, A. J., & van Niel, C. B. (1956) · Harvard University Press eBooks · doi:10.4159/harvard.9780674188693 · Cited by 88
Fisher, M. C., Koenig, G. L., White, T. J., & Taylor, J. W. (2000) · Journal of Clinical Microbiology · doi:10.1128/jcm.38.2.807-813.2000 · Cited by 87
Molecular Epidemiology of Blastomyces dermatitidis
McCullough, M. J., DiSalvo, A. F., Clemons, K. V., Park, P., & Stevens, D. A. (2000) · Clinical Infectious Diseases · doi:10.1086/313649 · Cited by 83
Self-citationSaul, N., Krockenberger, M. B., & Carter, D. A. (2008) · Eukaryotic Cell · doi:10.1128/ec.00020-08 · Cited by 82
Thein vitroisolation ofBlastomyces dermatitidisfrom a woodpile in north central Wisconsin, USA
Baumgardner, D. J., & Paretsky, D. P. (1999) · Medical Mycology · doi:10.1080/j.1365-280x.1999.00214.x · Cited by 73
Henk, D. A., Shahar-Golan, R., Devi, K. R., Boyce, K. J., Zhan, N., Fedorova, N. D., Nierman, W. C., Hsueh, P., Yuen, K., Sieu, T. P. M., et al. (2012) · PLoS Pathogens · doi:10.1371/journal.ppat.1002851 · Cited by 63
Clinical Characteristics and Outcomes in Patients with Pulmonary Blastomycosis
Kralt, D., Light, B., Cheang, M., MacNair, T., Wiebe, L., Limerick, B., Sarsfield, P., Hammond, G. W., Macdonald, K., Trepman, E., et al. (2008) · Mycopathologia · doi:10.1007/s11046-008-9163-7 · Cited by 63
Genetics and evolution of infectious diseases
Tibayrenc, M. (2011) · HAL · Cited by 58
Carlos, W. G., Rose, A. S., Wheat, L. J., Norris, S., Sarosi, G. A., Knox, K. S., & Hage, C. A. (2010) · CHEST Journal · doi:10.1378/chest.10-0627 · Cited by 58
Henk, D. A., Eagle, C. E., BROWN, K., van den Berg, M. A., Dyer, P. S., Peterson, S. W., & Fisher, M. C. (2011) · Molecular Ecology · doi:10.1111/j.1365-294x.2011.05244.x · Cited by 58
Non-Rural Point Source Blastomycosis Outbreak Near a Yard Waste Collection Site
Pfister, J., Archer, J. R., Hersil, S., Boers, T., Reed, K. D., Meece, J. K., Anderson, J. L., Burgess, J. W., Sullivan, T. D., Klein, B. S., et al. (2010) · Clinical Medicine & Research · doi:10.3121/cmr.2010.958 · Cited by 57
Recombination and Genetic Differentiation in the Mycorrhizal Fungus Cenococcum geophilum Fr.
LoBuglio, K. F., & Taylor, J. W. (2002) · Mycologia · doi:10.2307/3761692 · Cited by 56
Dwight, P., Naus, M., Sarsfield, P., & Limerick, B. (2000) · PubMed · Cited by 54
Fisher, M. C., Rannala, B. H., Chaturvedi, V. P., & Taylor, J. W. (2002) · Proceedings of the National Academy of Sciences · doi:10.1073/pnas.132178099 · Cited by 54
Molecular taxonomy and epidemiology of Blastomyces and Histoplasma species
Guého, E., Leclerc, M.-C., de Hoog, S., & Dupont, B. (1997) · Mycoses · doi:10.1111/j.1439-0507.1997.tb00191.x · Cited by 50
Additional Isolations of Blastomyces Dermatitidis from Natural Sites
Denton, J. F., & DiSalvo, A. F. (1979) · American Journal of Tropical Medicine and Hygiene · doi:10.4269/ajtmh.1979.28.697 · Cited by 48
Carman, W. F., Frean, J., Crewe-Brown, H. H., Culligan, G. A., & Young, C. N. (1989) · Mycopathologia · doi:10.1007/bf00437587 · Cited by 47
Spontaneous mutant ofBlastomyces dermatitidisattenuated in virulence for mice
Brass, C., Volkmann, C. M., Philpott, D. E., Klein, H. P., Halde, C., & Stevens, D. A. (1982) · Medical Mycology · doi:10.1080/00362178285380221 · Cited by 44
Self-citationMeece, J. K., Anderson, J. L., Klein, B. S., Sullivan, T. D., Foley, S. L., Baumgardner, D. J., Brummitt, C. F., & Reed, K. D. (2010) · Medical Mycology · doi:10.3109/13693780903103952 · Cited by 41
Meece, J. K., Anderson, J. L., Fisher, M. C., Henk, D. A., Sloss, B. L., & Reed, K. D. (2011) · Applied and Environmental Microbiology · doi:10.1128/aem.00258-11 · Cited by 39
Epidemiology of human blastomycosis in Vilas County, Wisconsin. II: 1991-1996.
Baumgardner, D. J., & Brockman, K. G. (1998) · PubMed · Cited by 33
An exploratory algorithm to identify intra-host recombinant viral sequences
Salemi, M., Gray, R. R., & Goodenow, M. M. (2008) · Molecular Phylogenetics and Evolution · doi:10.1016/j.ympev.2008.08.017 · Cited by 32
Seasonal variations in the clinical presentation of pulmonary and extrapulmonary blastomycosis
Light, R. B., Kralt, D., Embil, J. M., Trepman, E., Wiebe, L., Limerick, B., Sarsfield, P., Hammond, G. W., & Macdonald, K. (2008) · Medical Mycology · doi:10.1080/13693780802132763 · Cited by 32
The Epidemiology of Blastomycosis
DiSalvo, A. F. (1992) · Springer eBooks · doi:10.1007/978-1-4615-3306-1_5 · Cited by 28
Studies on the molecular ecology of Blastomyces dermatitidis
Baumgardner, D. J., & Laundre, B. J. (2001) · Mycopathologia · doi:10.1023/a:1012438029997 · Cited by 28
Conversion of Blastomyces dermatitidis to the yeast form at 37 degrees C and 26 degrees C
Kane, J. (1984) · Journal of Clinical Microbiology · doi:10.1128/jcm.20.3.594-596.1984 · Cited by 28
Douhan, G. W., Martin, D. P., & Rizzo, D. (2007) · Current Genetics · doi:10.1007/s00294-007-0150-1 · Cited by 28
African strains of Blastomyces dermatitidis that do not express surface adhesin WI-1
Klein, B. S., Aizenstein, B. D., & Hogan, L. H. (1997) · Infection and Immunity · doi:10.1128/iai.65.4.1505-1509.1997 · Cited by 21
Blastomycosis in the Mountainous Region of Northeast Tennessee
Hussein, R., Khan, S., Levy, F., Mehta, J., & Sarubbi, F. A. (2008) · CHEST Journal · doi:10.1378/chest.08-1947 · Cited by 18
Sudman, M. S., & Kaplan, W. E. (1974) · Applied Microbiology · doi:10.1128/am.27.3.496-499.1974 · Cited by 15
Virulent isolates and mutants of Blastomyces in mice: a legacy for studies of pathogenesis.
Stevens, D. A., Brummer, E., DiSalvo, A. F., & Ganer, A. (1997) · PubMed · Cited by 15
Self-citationSudman, M. S., & Kaplan, W. (1974) · Applied Microbiology · doi:10.1128/aem.27.3.496-499.1974 · Cited by 7
Brandhorst, T. T., Rooney, P. J., Sullivan, T. D., & Klein, B. S. (2002) · International Journal of Medical Microbiology · doi:10.1078/1438-4221-00219 · Cited by 6
Research works printed but not linked: 1
- TC Gilchrist, 1894, Protozoan dermatitis, J Cutan Gen Dis, 12, 496
Cited by
Sorted by citations
Donnelly, J. P., Chen, S. C.-J., Kauffman, C. A., Steinbach, W. J., Baddley, J. W., Verweij, P. E., Clancy, C. J., Wingard, J. R., Lockhart, S. R., Groll, A. H., et al. (2019) · Clinical Infectious Diseases · doi:10.1093/cid/ciz1008 · Cited by 2,987
Self-citationFungal Diversity Revisited: 2.2 to 3.8 Million Species
Hawksworth, D. L., & Lücking, R. (2017) · Microbiology Spectrum · doi:10.1128/microbiolspec.funk-0052-2016 · Cited by 1,346
A pan-cancer mycobiome analysis reveals fungal involvement in gastrointestinal and lung tumors
Dohlman, A. B., Klug, J., Mesko, M., Gao, I. H., Lipkin, S. M., Shen, X., & Iliev, I. D. (2022) · Cell · doi:10.1016/j.cell.2022.09.015 · Cited by 429
Emerging Fungal Infections: New Patients, New Patterns, and New Pathogens
Friedman, D. Z. P., & Schwartz, I. S. (2019) · Journal of Fungi · doi:10.3390/jof5030067 · Cited by 369
Wijayawardene, N. N., Hyde, K. D., Rajeshkumar, K. C., Hawksworth, D. L., Hugo Madrid, L., Kirk, P. M., Braun, U., Singh, R. V., Crous, P. W., Kukwa, M., et al. (2017) · Fungal Diversity · doi:10.1007/s13225-017-0386-0 · Cited by 335
Metadata
- Authors
- Brown, E. M., McTaggart, L. R., Zhang, S. X., Low, D. E., Stevens, D. A., & Richardson, S. E.
- Affiliations
- Mount Sinai Hospital (CA)
- Public Health Ontario (CA)
- Johns Hopkins University (US)
- Santa Clara Valley Medical Center (US)
- University of Toronto (CA)
- Corresponding author
- McTaggart, Lisa R.
- ORCID
- Venue
- PLoS ONE
- Publisher
- Public Library of Science (PLoS)
- Published
- 2013-03-22
- Volume
- 8
- Issue
- 3
- Pages
- e59237
- ISSN
- 1932-6203 (ISSN-L)
- PMC
- PMC3606480
- OpenAlex
- W2033915514
- Cited by
- 148
- References
- 81
- Citations by year
- 2026: 5 · 2025: 6 · 2024: 13 · 2023: 17 · 2022: 8 · 2021: 11 · 2020: 14 · 2019: 10 · 2018: 12 · 2017: 8 · 2016: 21 · 2015: 10 · 2014: 10 · 2013: 3
- FWCI
- 10.71
- Type
- journal article
- Language
- en
- Update notices
- correction (2016-12-09)
- Open access
- gold
- doi.org
- Locations
- PLoS ONE (publishedVersion, cc-by)
- Europe PMC (PubMed Central) (publishedVersion, cc-by)
- PubMed Central (publishedVersion, cc-by)
- PubMed (publishedVersion)
- DOAJ (DOAJ: Directory of Open Access Journals) (submittedVersion, cc-by-sa)
- Figshare (submittedVersion, cc-by)
- Funders
- Northwestern University
- Topics
- Health Sciences › Medicine › Infectious Diseases › Fungal Infections and Studies
- Life Sciences › Biochemistry, Genetics and Molecular Biology › Genetics › Genetic diversity and population structure
- Life Sciences › Agricultural and Biological Sciences › Plant Science › Plant Pathogens and Fungal Diseases
- Keywords
- Blastomyces dermatitidis, cryptic species, blastomycosis, population structure, phylogenetic species recognition, territorial differentiation, recombination, reproductive isolation, clonal populations, nuclear loci, pathogen evolution, disease surveillance
- MeSH terms
- Blastomyces, DNA, Fungal, Genetics, Population, Humans, Phylogeny, Evolution, Molecular
About these checks
Registry, retraction, Cites and statistics results are computed, not judged, with one exception: a printed reference that no index lists is read once by a model before it counts as a citation error. Claims are extracted by a model and kept only when their quote appears verbatim in the text; each cited source is then checked, with a model’s help, for whether it says what the claim relies on. Those verdicts can be wrong — read the claim’s quote and the cited source before relying on one.
Statistics and arithmetic are recomputed, not judged.
Confidence bands are shown only for fields calibrated on our annotated test set. None is calibrated yet, so no band is shown.
What counts as a claim ›How we measure confidence ›How we check this ›
Are you an author, or do you see a problem with this page? Request a review
