

The DOI matches its Crossref record; 38 of the 39 references it cites were found in a registry or an index, and 1 are not checked yet; 2 of the 29 sources its claims cite were checked for support.
Treatment of Obesity and Diabetes Using Oxytocin or Analogs in Patients and Mouse Models
Open accessAbstract
Obesity is important for the development of type-2 diabetes as a result of obesity-induced insulin resistance accompanied by impaired compensation of insulin secretion from pancreatic beta cells. Here, based on a randomized pilot clinical trial, we report that intranasal oxytocin administration over an 8-week period led to effective reduction of obesity and reversal of related prediabetic changes in patients. Using mouse models, we further systematically evaluated whether oxytocin and its analogs yield therapeutic effects against prediabetic or diabetic disorders regardless of obesity. Our results showed that oxytocin and two analogs including [Ser4, Ile8]-oxytocin or [Asu1,6]-oxytocin worked in mice to reverse insulin resistance and glucose intolerance prior to reduction of obesity. In parallel, using streptozotocin-induced diabetic mouse model, we found that treatment with oxytocin or its analogs reduced the magnitude of glucose intolerance through improving insulin secretion. The anti-diabetic effects of oxytocin and its analogs in these animal models can be produced similarly whether central or peripheral administration was used. In conclusion, oxytocin and its analogs have multi-level effects in improving weight control, insulin sensitivity and insulin secretion, and bear potentials for being developed as therapeutic peptides for obesity and diabetes.
Verified 2026-10-09 · 1 reference not checked yet
Overview
AI snapshot
Written from the paper’s full text.
TL;DR
In an 8-week randomized pilot trial, intranasal oxytocin reduced body weight and BMI and improved lipid profiles in obese non-diabetic patients, with no reported adverse effects. In mouse models, oxytocin and two analogs improved insulin sensitivity and insulin secretion independently of body-weight reduction, including after streptozotocin-induced beta-cell damage.
Key findings
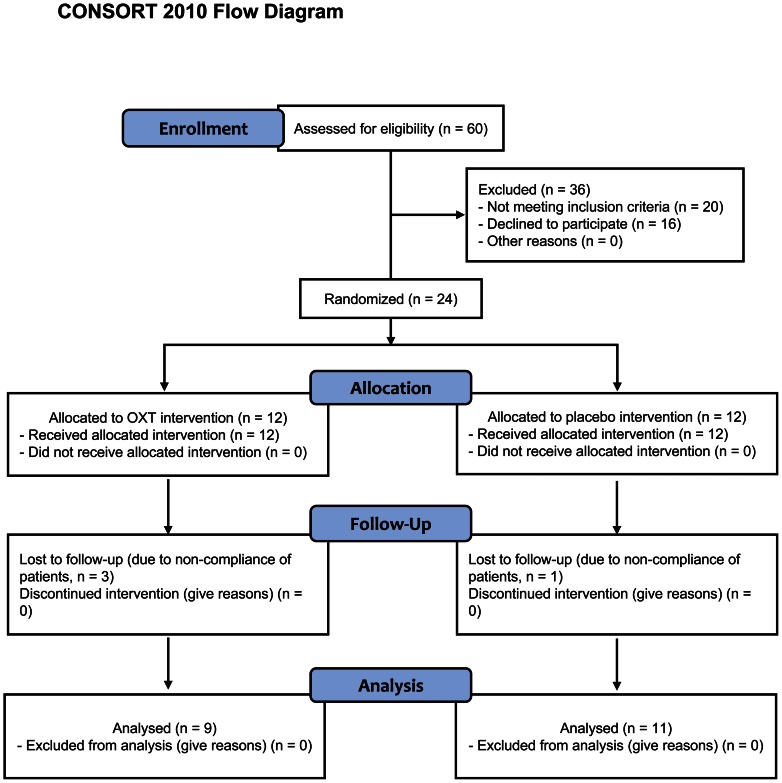
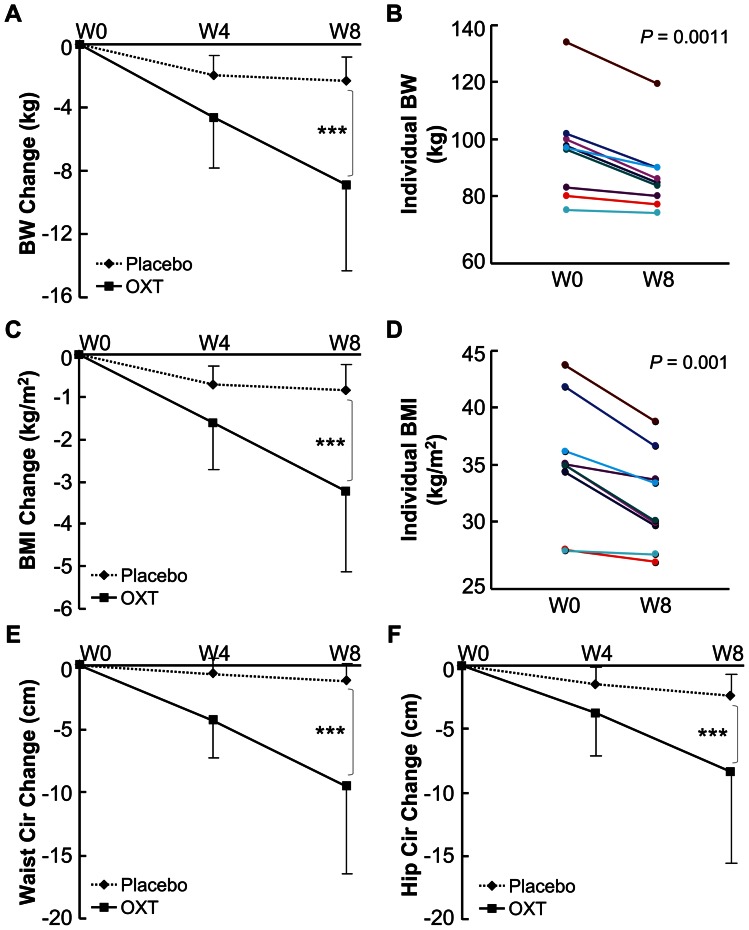
- In the clinical trial, intranasal oxytocin (24 units 4 times/day) for 8 weeks reduced body weight by 8.9±5.4 kg and BMI by 3.2±1.9 kg/m² versus baseline (P<0.001); 4-week weight reduction was 4.6±3.2 kg. Placebo produced no therapeutic effect against obesity (n=9 oxytocin, n=11 placebo).
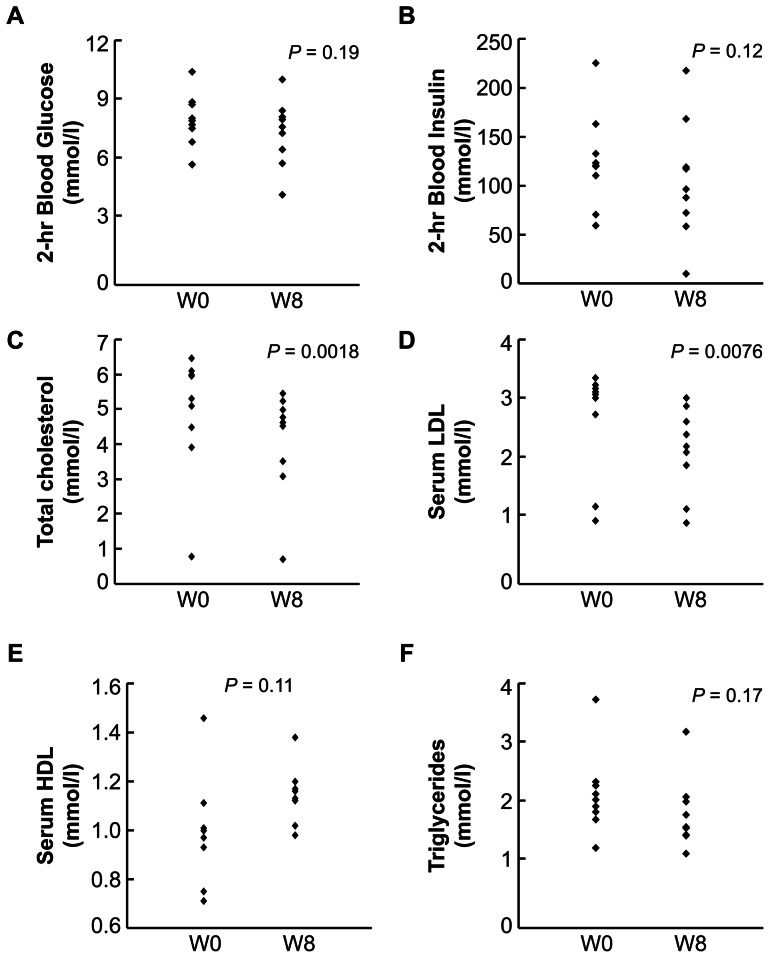
- Oxytocin treatment significantly reduced serum LDL and cholesterol and tended to increase HDL; no adverse effects were reported, and no cardiovascular, liver, or kidney dysfunction was found.
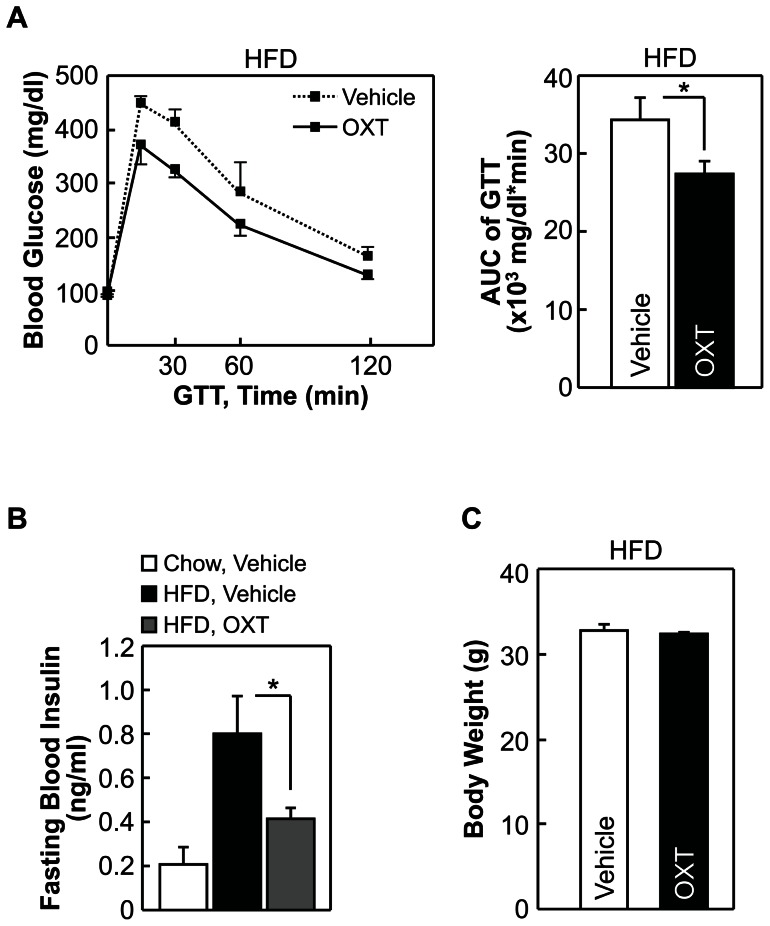
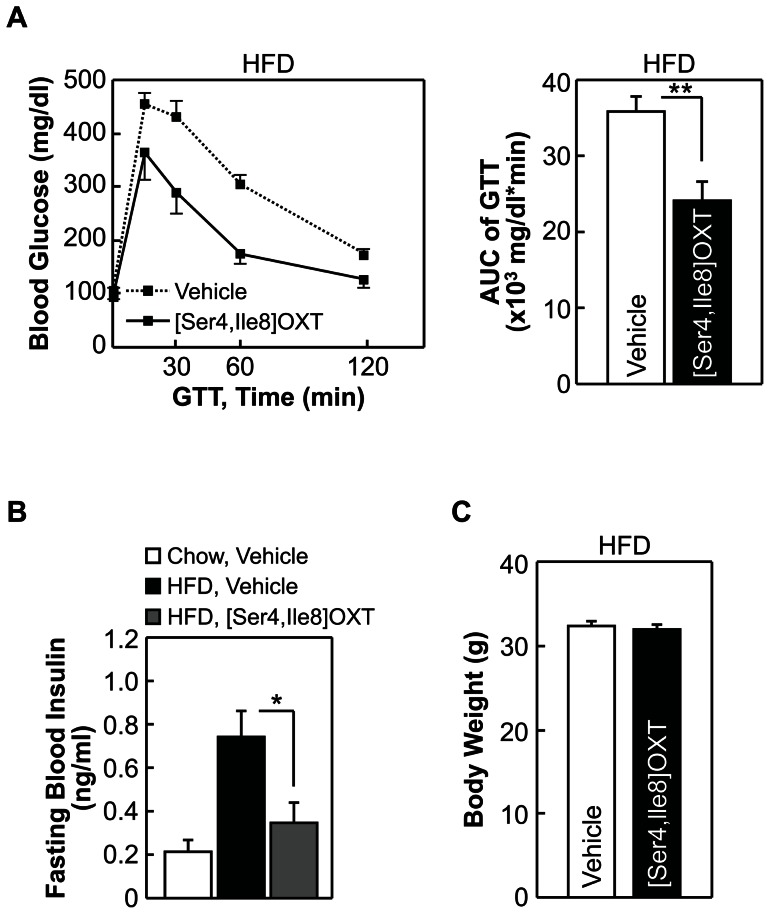
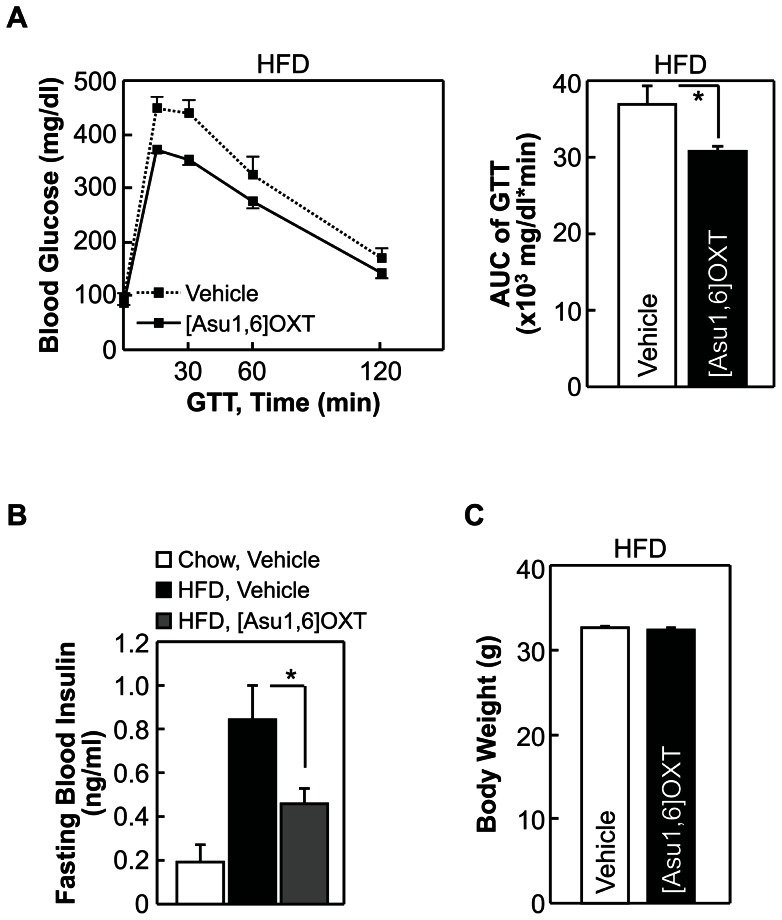
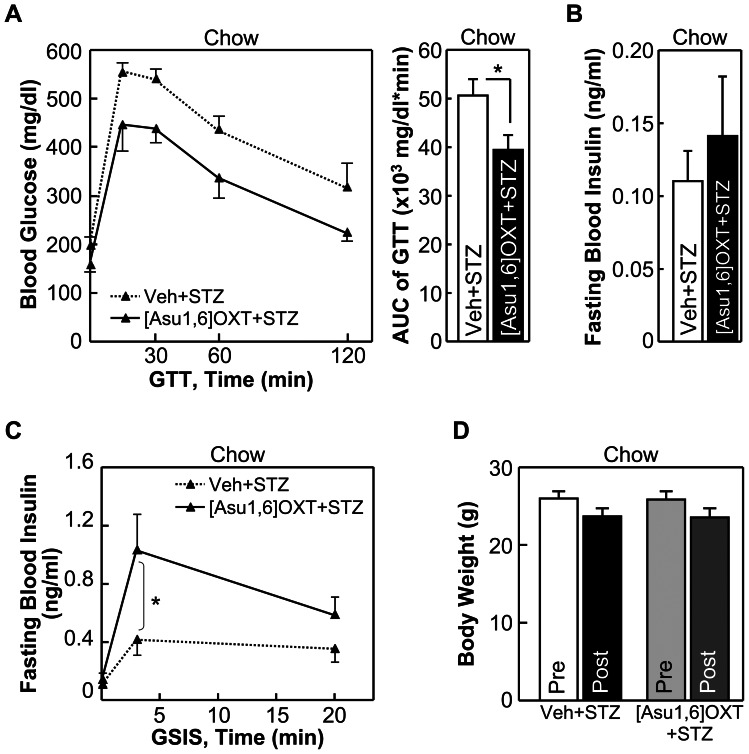
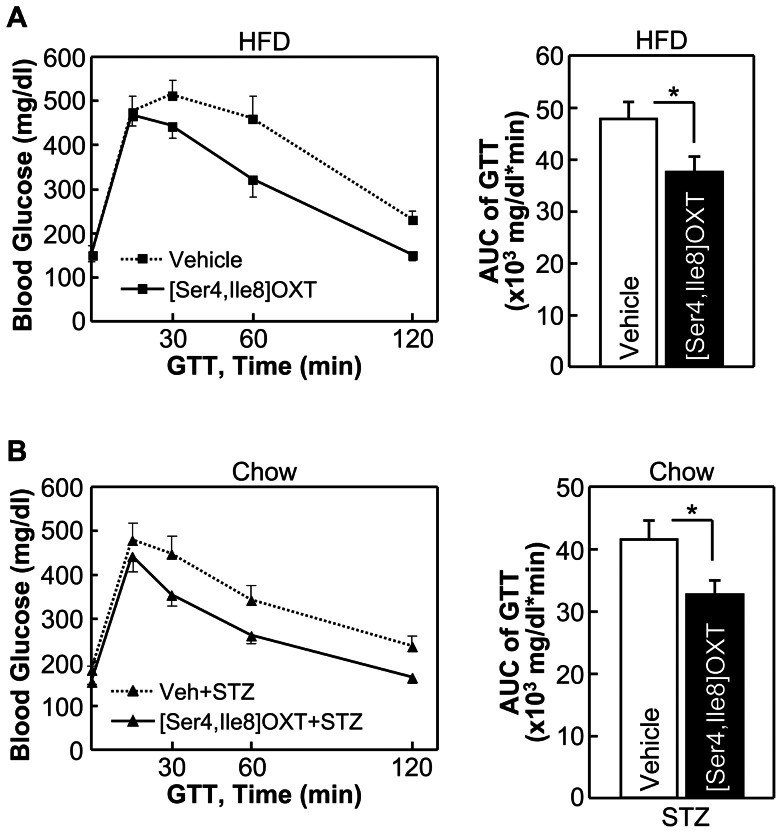
- In high-fat-diet-fed prediabetic mice, central oxytocin and analogs improved glucose intolerance and fasting insulin levels without body-weight change; [Ser4, Ile8]-oxytocin had more pronounced effects than native oxytocin, while [Asu1,6]-oxytocin was comparable to oxytocin but weaker than [Ser4, Ile8]-oxytocin.
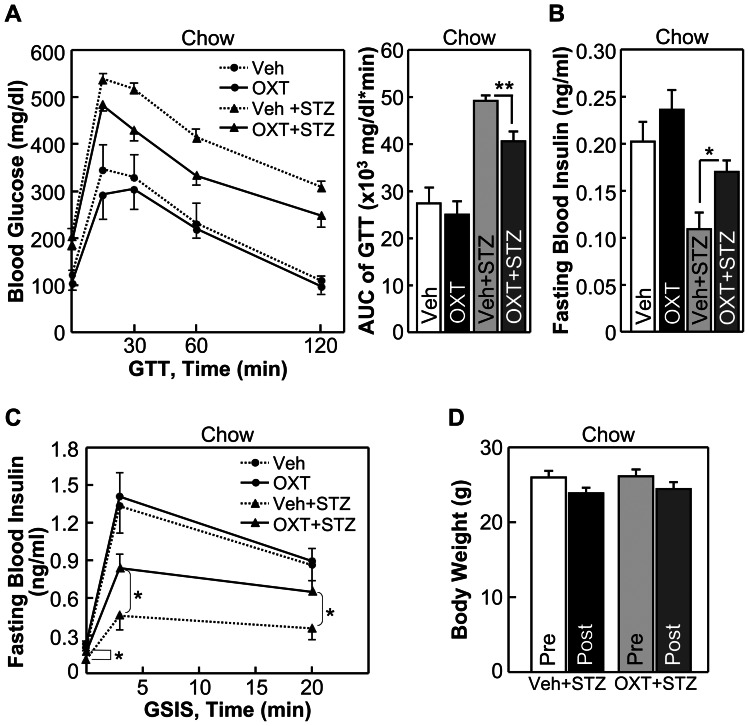
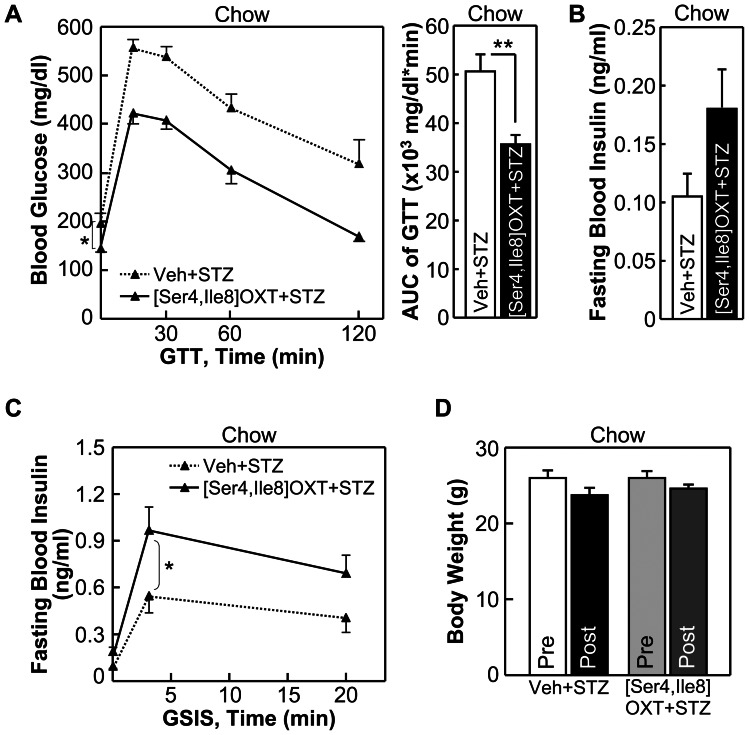
- In streptozotocin-induced diabetic mice, central oxytocin and analogs improved glucose tolerance and insulin secretion (first- and second-phase GSIS) without body-weight changes; peripheral i.p. [Ser4, Ile8]-oxytocin also improved glucose tolerance in both high-fat-diet and streptozotocin models.
Methods
- Randomized placebo-controlled pilot clinical trial (ChiCTR-TRC-12002884) in patients with obesity (BMI ≥28 kg/m²), ages 20–60, excluding diabetes; oxytocin nasal spray 24 units 4 times/day before three meals and sleep for 8 weeks versus saline placebo; outcomes included body weight, BMI, waist/hip circumference, glucose, insulin, lipids, and safety labs.
- Mouse studies used C57BL/6 mice: high-fat-diet-induced prediabetes (2 months) and streptozotocin-induced diabetes (40 mg/kg i.p. for 4 days); oxytocin or analogs [Ser4, Ile8]-oxytocin and [Asu1,6]-oxytocin were given centrally via third-ventricle cannula or peripherally i.p.; assessments included glucose tolerance tests, fasting insulin ELISA, and glucose-stimulated insulin secretion.
- Statistics used repeated measures, ANOVA with post hoc tests, and two-tailed Student’s t tests; clinical data are mean±SD, animal data mean±SEM, with P<0.05 considered significant.
Limitations
- The paper states that future studies with larger samples and longer duration are needed to fully evaluate efficacy and side-effect profiles of oxytocin nasal spray; the clinical trial excluded diabetic patients, so whether oxytocin treats diabetes in an obesity-independent manner in humans remains to be tested; and the mouse experiments did not address underlying signaling mechanisms.
- Evident from the text: the clinical sample was small (n=20 total) with baseline imbalances (oxytocin group younger, heavier, and with higher BMI/waist circumference than placebo), and animal groups were small (n=4–8) with short acute treatment periods.
Model-written summary. Check it against the paper before relying on it.
Integrity signals
Registry
Cites
Statistics
Figures
Verification
Claims the paper makes
41 Own result · 21 Own interpretation · 20 Not checked yet · 9 Own method · 1 Supported · 1 Partly supported · 1 No basis given · accuracy not yet measured
The cited sources support only part of this claim — read each source’s verdict below.
In the paper
“bariatric procedures can have immediate effects in lowering blood sugar levels in diabetes prior to evident changes of body weight [4], [5]”
§ Treatment of Obesity and Diabetes Using Oxytocin or Analogs in Patients and Mouse Models > Introduction
What the sources say
- Partly supportedcites [4] PR Schauer, 2012, Bariatric surgery versus intensive medical therapy in obese patients with diabetes, N Engl J Med sourceExperimental — accuracy not yet measured
The Results (Glycemic Control; page unavailable) report rapid improvement in blood sugar measures by three months after surgery. The Discussion (page unavailable) says diabetes medication use fell before maximal weight loss, but does not establish that blood sugar fell immediately or before any evident change in body weight. (LLM, conf=0.86)
- Not checked yetcites [5] G Mingrone, 2012, Bariatric surgery versus conventional medical therapy for type 2 diabetes, N Engl J Med source
plaindirect- Asserted: passes — The authors put it forward as true.
- Checkable: passes — It can be checked against evidence.
- Load-bearing: unclear — It is unclear whether the paper’s conclusions depend on it.
- Based: passes — The paper gives a reason why it holds.
- Partly supported
A result the paper reports from its own data — it cites no other source for it, so there is none to check. The quote shows it is in the paper.
In the paper
“The anti-diabetic effects of oxytocin and its analogs in these animal models can be produced similarly whether central or peripheral administration was used.”
§ Treatment of Obesity and Diabetes Using Oxytocin or Analogs in Patients and Mouse Models > Abstract
plain- Asserted: passes — The authors put it forward as true.
- Checkable: passes — It can be checked against evidence.
- Load-bearing: unclear — It is unclear whether the paper’s conclusions depend on it.
- Based: passes — The paper gives a reason why it holds.
A result the paper reports from its own data — it cites no other source for it, so there is none to check. The quote shows it is in the paper.
In the paper
“oxytocin and two analogs including [Ser4, Ile8]-oxytocin or [Asu1,6]-oxytocin worked in mice to reverse insulin resistance and glucose intolerance prior to reduction of obesity.”
§ Treatment of Obesity and Diabetes Using Oxytocin or Analogs in Patients and Mouse Models > Abstract
plaindirect- Asserted: passes — The authors put it forward as true.
- Checkable: passes — It can be checked against evidence.
- Load-bearing: passes — The paper’s conclusions depend on it.
- Based: passes — The paper gives a reason why it holds.
A result the paper reports from its own data — it cites no other source for it, so there is none to check. The quote shows it is in the paper.
In the paper
“using streptozotocin-induced diabetic mouse model, we found that treatment with oxytocin or its analogs reduced the magnitude of glucose intolerance through improving insulin secretion.”
§ Treatment of Obesity and Diabetes Using Oxytocin or Analogs in Patients and Mouse Models > Abstract
plaindirect- Asserted: passes — The authors put it forward as true.
- Checkable: passes — It can be checked against evidence.
- Load-bearing: passes — The paper’s conclusions depend on it.
- Based: passes — The paper gives a reason why it holds.
A result the paper reports from its own data — it cites no other source for it, so there is none to check. The quote shows it is in the paper.
In the paper
“intranasal oxytocin administration over an 8-week period led to effective reduction of obesity and reversal of related prediabetic changes in patients.”
§ Treatment of Obesity and Diabetes Using Oxytocin or Analogs in Patients and Mouse Models > Abstract
plaindirect- Asserted: passes — The authors put it forward as true.
- Checkable: passes — It can be checked against evidence.
- Load-bearing: passes — The paper’s conclusions depend on it.
- Based: passes — The paper gives a reason why it holds.
A result the paper reports from its own data — it cites no other source for it, so there is none to check. The quote shows it is in the paper.
In the paper
“while placebo did not lead to a therapeutic effect against obesity”
§ Treatment of Obesity and Diabetes Using Oxytocin or Analogs in Patients and Mouse Models > Results > Treatment of obesity by OXT nasal spray in patients
plain- Asserted: passes — The authors put it forward as true.
- Checkable: passes — It can be checked against evidence.
- Load-bearing: passes — The paper’s conclusions depend on it.
- Based: passes — The paper gives a reason why it holds.
A result the paper reports from its own data — it cites no other source for it, so there is none to check. The quote shows it is in the paper.
In the paper
“body weight of these patients dropped 8.9±5.4 kg (P<0.001)”
§ Treatment of Obesity and Diabetes Using Oxytocin or Analogs in Patients and Mouse Models > Results > Treatment of obesity by OXT nasal spray in patients
plaindirect- Asserted: passes — The authors put it forward as true.
- Checkable: passes — It can be checked against evidence.
- Load-bearing: passes — The paper’s conclusions depend on it.
- Based: passes — The paper gives a reason why it holds.
A result the paper reports from its own data — it cites no other source for it, so there is none to check. The quote shows it is in the paper.
In the paper
“4-week OXT treatment resulted in body weight reduction by 4.6±3.2 kg.”
§ Treatment of Obesity and Diabetes Using Oxytocin or Analogs in Patients and Mouse Models > Results > Treatment of obesity by OXT nasal spray in patients
plaindirect- Asserted: passes — The authors put it forward as true.
- Checkable: passes — It can be checked against evidence.
- Load-bearing: passes — The paper’s conclusions depend on it.
- Based: passes — The paper gives a reason why it holds.
A result the paper reports from its own data — it cites no other source for it, so there is none to check. The quote shows it is in the paper.
In the paper
“8-week OXT treatment reduced this parameter by 3.2±1.9 kg/m2 (P<0.001)”
§ Treatment of Obesity and Diabetes Using Oxytocin or Analogs in Patients and Mouse Models > Results > Treatment of obesity by OXT nasal spray in patients
plaindirect- Asserted: passes — The authors put it forward as true.
- Checkable: passes — It can be checked against evidence.
- Load-bearing: passes — The paper’s conclusions depend on it.
- Based: passes — The paper gives a reason why it holds.
A result the paper reports from its own data — it cites no other source for it, so there is none to check. The quote shows it is in the paper.
In the paper
“both effects were independent of body weight (Fig. 6C )”
§ Treatment of Obesity and Diabetes Using Oxytocin or Analogs in Patients and Mouse Models > Results > Reversal of insulin resistance in mice via central administration of OXT or analogs
plain- Asserted: passes — The authors put it forward as true.
- Checkable: passes — It can be checked against evidence.
- Load-bearing: unclear — It is unclear whether the paper’s conclusions depend on it.
- Based: passes — The paper gives a reason why it holds.
- Probably not a substantial claim. 16
- It may state two separate claims as one. 15
- The quote only partly states this claim. 1
Every source the paper cites for this claim was checked and supports it.
In the paper
“combinational release and actions of multiple peptides including GLP-1 may account for, at least partly, the profound effects of bariatric surgery in treating obesity and diabetes [3].”
§ Treatment of Obesity and Diabetes Using Oxytocin or Analogs in Patients and Mouse Models > Introduction
What the sources say
- Supportedcites [3] JQ Purnell, 2009, Bariatric surgery and diabetes: who should be offered the option of remission?, JAMA source
In “Bariatric Surgery and Diabetes,” the paper says gastric bypass alters several gut hormones, including ghrelin, peptide YY, and GLP-1, with effects on food intake and insulin secretion. It describes the mechanism as incompletely understood, consistent with the claim’s tentative wording. (LLM, conf=0.90)
hedgedconditional- Asserted: passes — The authors put it forward as true.
- Checkable: passes — It can be checked against evidence.
- Load-bearing: fails — The paper’s conclusions may not depend on it.
- Based: passes — The paper gives a reason why it holds.
Probably not a substantial claim. The paper’s conclusions may not depend on it.
- Supported
A result the paper reports from its own data — it cites no other source for it, so there is none to check. The quote shows it is in the paper.
In the paper
“OXT treatment did not cause any cardiovascular, liver or kidney dysfunctions”
§ Treatment of Obesity and Diabetes Using Oxytocin or Analogs in Patients and Mouse Models > Results > Treatment of obesity by OXT nasal spray in patients
plain- Asserted: passes — The authors put it forward as true.
- Checkable: passes — It can be checked against evidence.
- Load-bearing: passes — The paper’s conclusions depend on it.
- Based: passes — The paper gives a reason why it holds.
It may state two separate claims as one.
A result the paper reports from its own data — it cites no other source for it, so there is none to check. The quote shows it is in the paper.
In the paper
“and fasting blood insulin levels (Fig. 4B ) of mice”
§ Treatment of Obesity and Diabetes Using Oxytocin or Analogs in Patients and Mouse Models > Results > Reversal of insulin resistance in mice via central administration of OXT or analogs
plaindirect- Asserted: passes — The authors put it forward as true.
- Checkable: passes — It can be checked against evidence.
- Load-bearing: passes — The paper’s conclusions depend on it.
- Based: passes — The paper gives a reason why it holds.
The quote only partly states this claim.
A result the paper reports from its own data — it cites no other source for it, so there is none to check. The quote shows it is in the paper.
In the paper
“The therapeutic effects of [Asu1,6]-OXT seemed to be comparable with the effects of OXT (Fig. 4), but weaker than the effects of [Ser4, Ile8]-OXT (Fig. 5).”
§ Treatment of Obesity and Diabetes Using Oxytocin or Analogs in Patients and Mouse Models > Results > Reversal of insulin resistance in mice via central administration of OXT or analogs
hedged- Asserted: passes — The authors put it forward as true.
- Checkable: passes — It can be checked against evidence.
- Load-bearing: passes — The paper’s conclusions depend on it.
- Based: passes — The paper gives a reason why it holds.
It may state two separate claims as one.
A result the paper reports from its own data — it cites no other source for it, so there is none to check. The quote shows it is in the paper.
In the paper
“our results showed that OXT nasal spray effectively reversed obesity as well as obesity-related lipid disorders.”
§ Treatment of Obesity and Diabetes Using Oxytocin or Analogs in Patients and Mouse Models > Discussion > Multi-level therapeutic benefits of OXT and analogs in treating obesity and diabetes
plaindirect- Asserted: passes — The authors put it forward as true.
- Checkable: passes — It can be checked against evidence.
- Load-bearing: passes — The paper’s conclusions depend on it.
- Based: passes — The paper gives a reason why it holds.
It may state two separate claims as one.
A conclusion the paper draws from its own results — it cites no other source for it, so there is none to check. The quote shows it is in the paper.
In the paper
“oxytocin and its analogs have multi-level effects in improving weight control, insulin sensitivity and insulin secretion, and bear potentials for being developed as therapeutic peptides for obesity and diabetes.”
- Also stated in: § Introduction · plain
“OXT and its analogs have multiple therapeutic effects including weight control, lipid lowering, insulin sensitization and insulin secretion, and thus have druggable potentials of being developed as a new class of small peptides for treating obesity as well as diabetes that is related or unrelated to obesity.”
§ Treatment of Obesity and Diabetes Using Oxytocin or Analogs in Patients and Mouse Models > Abstract
plaindirect- Asserted: passes — The authors put it forward as true.
- Checkable: passes — It can be checked against evidence.
- Load-bearing: passes — The paper’s conclusions depend on it.
- Based: passes — The paper gives a reason why it holds.
It may state two separate claims as one.
- Also stated in: § Introduction · plain
In the paper
“dipeptidyl peptidase-4 (DPP-4) inhibitors were developed to stabilize endogenous GLP-1, an approach which is effective in treating obesity and diabetes [2].”
§ Treatment of Obesity and Diabetes Using Oxytocin or Analogs in Patients and Mouse Models > Introduction
What the sources say
- Not checked yetcites [2] RE Amori, 2007, Efficacy and safety of incretin therapy in type 2 diabetes: systematic review and meta-analysis, JAMA source
plaindirect- Asserted: passes — The authors put it forward as true.
- Checkable: passes — It can be checked against evidence.
- Load-bearing: fails — The paper’s conclusions may not depend on it.
- Based: passes — The paper gives a reason why it holds.
Probably not a substantial claim. The paper’s conclusions may not depend on it.
In the paper
“the clinical success of this concept has been evidenced by the usefulness of intestinal peptide glucagon-like peptide-1 (GLP-1) in controlling obesity as well as diabetes [1].”
§ Treatment of Obesity and Diabetes Using Oxytocin or Analogs in Patients and Mouse Models > Introduction
What the sources say
- Not checked yetcites [1] M Briones, 2006, Exenatide: a GLP-1 receptor agonist as novel therapy for Type 2 diabetes mellitus, Expert Opin Pharmacother source
boosteddirect- Asserted: passes — The authors put it forward as true.
- Checkable: passes — It can be checked against evidence.
- Load-bearing: fails — The paper’s conclusions may not depend on it.
- Based: passes — The paper gives a reason why it holds.
Probably not a substantial claim. The paper’s conclusions may not depend on it. It may state two separate claims as one.
None of the sources cited for this claim have been checked yet.
In the paper
“this obesity-independent hypoglycemic effect has been related to the action of GLP-1 in promoting insulin section [3], [6].”
§ Treatment of Obesity and Diabetes Using Oxytocin or Analogs in Patients and Mouse Models > Introduction
What the sources say
- Not checked yetcites [3] JQ Purnell, 2009, Bariatric surgery and diabetes: who should be offered the option of remission?, JAMA source
- Not checked yetcites [6] B Laferrere, 2008, Effect of weight loss by gastric bypass surgery versus hypocaloric diet on glucose and incretin levels in patients with type 2 diabetes, J Clin Endocrinol Metab source
plaincorrelational- Asserted: passes — The authors put it forward as true.
- Checkable: passes — It can be checked against evidence.
- Load-bearing: fails — The paper’s conclusions may not depend on it.
- Based: passes — The paper gives a reason why it holds.
Probably not a substantial claim. The paper’s conclusions may not depend on it.
What the paper did — it cites no source for this, so there is none to check. The quote shows it is in the paper.
In the paper
“All animal procedures were approved by the Institutional Animal Care and Use Committee (IACUC) at the Albert Einstein College of Medicine.”
§ Treatment of Obesity and Diabetes Using Oxytocin or Analogs in Patients and Mouse Models > Materials and Methods > Clinical study
plain- Asserted: passes — The authors put it forward as true.
- Checkable: passes — It can be checked against evidence.
- Load-bearing: fails — The paper’s conclusions may not depend on it.
- Based: passes — The paper gives a reason why it holds.
Probably not a substantial claim. The paper’s conclusions may not depend on it.
What the paper did — it cites no source for this, so there is none to check. The quote shows it is in the paper.
In the paper
“Written informed consent was given to each patient.”
§ Treatment of Obesity and Diabetes Using Oxytocin or Analogs in Patients and Mouse Models > Materials and Methods > Clinical study
plain- Asserted: passes — The authors put it forward as true.
- Checkable: passes — It can be checked against evidence.
- Load-bearing: fails — The paper’s conclusions may not depend on it.
- Based: passes — The paper gives a reason why it holds.
Probably not a substantial claim. The paper’s conclusions may not depend on it.
What the paper did — it cites no source for this, so there is none to check. The quote shows it is in the paper.
In the paper
“Estimate of sample size was determined using standard method and biomedical information. We predicted that the effect rate in OXT treatment group was greater than 50%, and the effect rate in placebo group was less than 15%. The settings of 80% power and α = 0.05 were used, and ∼25% dropout was estimated.”
§ Treatment of Obesity and Diabetes Using Oxytocin or Analogs in Patients and Mouse Models > Materials and Methods > Clinical study
hedged- Asserted: passes — The authors put it forward as true.
- Checkable: passes — It can be checked against evidence.
- Load-bearing: fails — The paper’s conclusions may not depend on it.
- Based: passes — The paper gives a reason why it holds.
Probably not a substantial claim. The paper’s conclusions may not depend on it. It may state two separate claims as one.
What the paper did — it cites no source for this, so there is none to check. The quote shows it is in the paper.
In the paper
“patients were recruited and randomly assigned into OXT vs. placebo (saline) treatment groups by clinicians/research assistants without being involved in study design or outcome/data analyses.”
§ Treatment of Obesity and Diabetes Using Oxytocin or Analogs in Patients and Mouse Models > Materials and Methods > Clinical study
plain- Asserted: passes — The authors put it forward as true.
- Checkable: passes — It can be checked against evidence.
- Load-bearing: fails — The paper’s conclusions may not depend on it.
- Based: passes — The paper gives a reason why it holds.
Probably not a substantial claim. The paper’s conclusions may not depend on it. It may state two separate claims as one.
What the paper did — it cites no source for this, so there is none to check. The quote shows it is in the paper.
In the paper
“conducted in accordance with the Declaration of Helsinki, Good Clinical Practice guidelines, and other relevant regulations by the People's Republic of China.”
§ Treatment of Obesity and Diabetes Using Oxytocin or Analogs in Patients and Mouse Models > Materials and Methods > Clinical study
plain- Asserted: passes — The authors put it forward as true.
- Checkable: passes — It can be checked against evidence.
- Load-bearing: fails — The paper’s conclusions may not depend on it.
- Based: passes — The paper gives a reason why it holds.
Probably not a substantial claim. The paper’s conclusions may not depend on it. It may state two separate claims as one.
What the paper did — it cites no source for this, so there is none to check. The quote shows it is in the paper.
In the paper
“This was a pilot clinical study registered through Chinese Clinical Trial Register (ChiCTR-TRC-12002884)”
§ Treatment of Obesity and Diabetes Using Oxytocin or Analogs in Patients and Mouse Models > Materials and Methods > Clinical study
plain- Asserted: passes — The authors put it forward as true.
- Checkable: passes — It can be checked against evidence.
- Load-bearing: fails — The paper’s conclusions may not depend on it.
- Based: passes — The paper gives a reason why it holds.
Probably not a substantial claim. The paper’s conclusions may not depend on it.
What the paper did — it cites no source for this, so there is none to check. The quote shows it is in the paper.
In the paper
“Statistical analyses were performed by investigators who did not have access to patients and were blind to the information during the entire course of the study.”
§ Treatment of Obesity and Diabetes Using Oxytocin or Analogs in Patients and Mouse Models > Materials and Methods > Clinical study
plain- Asserted: passes — The authors put it forward as true.
- Checkable: passes — It can be checked against evidence.
- Load-bearing: fails — The paper’s conclusions may not depend on it.
- Based: passes — The paper gives a reason why it holds.
Probably not a substantial claim. The paper’s conclusions may not depend on it.
What the paper did — it cites no source for this, so there is none to check. The quote shows it is in the paper.
In the paper
“Study protocol and informed consent form were approved by the Ethics Committee of the affiliated People’s Hospital of Jiangsu University.”
§ Treatment of Obesity and Diabetes Using Oxytocin or Analogs in Patients and Mouse Models > Materials and Methods > Clinical study
plain- Asserted: passes — The authors put it forward as true.
- Checkable: passes — It can be checked against evidence.
- Load-bearing: fails — The paper’s conclusions may not depend on it.
- Based: passes — The paper gives a reason why it holds.
Probably not a substantial claim. The paper’s conclusions may not depend on it.
In the paper
“it contains glutamine to serine substitution at amino acid position 4 which is predicted to strengthen α-helical structure and stabilize peptide conformation [20] and thus increase drug duration.”
§ Treatment of Obesity and Diabetes Using Oxytocin or Analogs in Patients and Mouse Models > Results > Reversal of insulin resistance in mice via central administration of OXT or analogs
What the sources say
- Not checked yetcites [20] B Forood, 1993, Stabilization of alpha-helical structures in short peptides via end capping, Proc Natl Acad Sci U S A source
hedgeddirect- Asserted: passes — The authors put it forward as true.
- Checkable: passes — It can be checked against evidence.
- Load-bearing: passes — The paper’s conclusions depend on it.
- Based: passes — The paper gives a reason why it holds.
It may state two separate claims as one.
In the paper
“an OXT analog which was reported to have 70% activity of native OXT [21].”
§ Treatment of Obesity and Diabetes Using Oxytocin or Analogs in Patients and Mouse Models > Results > Reversal of insulin resistance in mice via central administration of OXT or analogs
What the sources say
- Not checked yetcites [21] T Yamanaka, 1970, Crystalline deamino-dicarba-oxytocin. Preparation and some pharmacological properties, Mol Pharmacol source
plain- Asserted: passes — The authors put it forward as true.
- Checkable: passes — It can be checked against evidence.
- Load-bearing: fails — The paper’s conclusions may not depend on it.
- Based: passes — The paper gives a reason why it holds.
Probably not a substantial claim. The paper’s conclusions may not depend on it.
A conclusion the paper draws from its own results — it cites no other source for it, so there is none to check. The quote shows it is in the paper.
In the paper
“The above studies suggested that in addition to obesity control, OXT and its analogs can work in the brain to independently improve systemic insulin sensitivity and insulin secretion and thereof counteract against diabetes.”
§ Treatment of Obesity and Diabetes Using Oxytocin or Analogs in Patients and Mouse Models > Results > Anti-diabetic treatment in mice through peripheral injection of OXT
hedgeddirect- Asserted: passes — The authors put it forward as true.
- Checkable: passes — It can be checked against evidence.
- Load-bearing: passes — The paper’s conclusions depend on it.
- Based: passes — The paper gives a reason why it holds.
It may state two separate claims as one.
In the paper
“OXT has recently been found to be important for social recognition, pair bonding, love and care in mammals and for mental and emotional well-being in humans [8]-[13].”
§ Treatment of Obesity and Diabetes Using Oxytocin or Analogs in Patients and Mouse Models > Discussion > Potential off-target benefits of OXT and OXT analogs in treating obesity and diabetes
What the sources say
- Not checked yetcites [8]-[13]
plaincorrelational- Asserted: passes — The authors put it forward as true.
- Checkable: passes — It can be checked against evidence.
- Load-bearing: unclear — It is unclear whether the paper’s conclusions depend on it.
- Based: passes — The paper gives a reason why it holds.
It may state two separate claims as one.
A conclusion the paper draws from its own results — it cites no other source for it, so there is none to check. The quote shows it is in the paper.
In the paper
“the benefits of OXT in treating metabolic diseases are multi-faceted, range from obesity control to body weight-independent improvements of insulin sensitivity and insulin secretion.”
§ Treatment of Obesity and Diabetes Using Oxytocin or Analogs in Patients and Mouse Models > Discussion > Multi-level therapeutic benefits of OXT and analogs in treating obesity and diabetes
plaindirect- Asserted: passes — The authors put it forward as true.
- Checkable: passes — It can be checked against evidence.
- Load-bearing: passes — The paper’s conclusions depend on it.
- Based: passes — The paper gives a reason why it holds.
It may state two separate claims as one.
None of the sources cited for this claim have been checked yet.
In the paper
“OXT is currently under clinical trials for diseases such as autism, anxiety disorder, depression, drug abuse, and schizophrenia [33], [34].”
§ Treatment of Obesity and Diabetes Using Oxytocin or Analogs in Patients and Mouse Models > Discussion > Potential off-target benefits of OXT and OXT analogs in treating obesity and diabetes
What the sources say
- Not checked yetcites [33] A Meyer-Lindenberg, 2011, Oxytocin and vasopressin in the human brain: social neuropeptides for translational medicine, Nat Rev Neurosci source
- Not checked yetcites [34] D Feifel, 2012, Oxytocin as a potential therapeutic target for schizophrenia and other neuropsychiatric conditions, Neuropsychopharmacology source
plain- Asserted: passes — The authors put it forward as true.
- Checkable: passes — It can be checked against evidence.
- Load-bearing: fails — The paper’s conclusions may not depend on it.
- Based: passes — The paper gives a reason why it holds.
Probably not a substantial claim. The paper’s conclusions may not depend on it.
A conclusion the paper draws from its own results — it cites no other source for it, so there is none to check. The quote shows it is in the paper.
In the paper
“Our data proved that OXT and its analogs have the actions to reverse insulin resistance and improve insulin secretion in these mouse models.”
§ Treatment of Obesity and Diabetes Using Oxytocin or Analogs in Patients and Mouse Models > Discussion > Multi-level therapeutic benefits of OXT and analogs in treating obesity and diabetes
boosteddirect- Asserted: passes — The authors put it forward as true.
- Checkable: passes — It can be checked against evidence.
- Load-bearing: passes — The paper’s conclusions depend on it.
- Based: passes — The paper gives a reason why it holds.
It may state two separate claims as one.
What the paper did — it cites no source for this, so there is none to check. The quote shows it is in the paper.
In the paper
“our experiments in this work did not address the underlying signaling mechanisms”
§ Treatment of Obesity and Diabetes Using Oxytocin or Analogs in Patients and Mouse Models > Discussion > Multi-level therapeutic benefits of OXT and analogs in treating obesity and diabetes
plain- Asserted: passes — The authors put it forward as true.
- Checkable: passes — It can be checked against evidence.
- Load-bearing: fails — The paper’s conclusions may not depend on it.
- Based: passes — The paper gives a reason why it holds.
Probably not a substantial claim. The paper’s conclusions may not depend on it.
In the paper
“recent neurobiological research revealed that brain actions of OXT are crucial for a battery of neuropsychiatric activities in both genders such as sociality, pair bonding, emotion, trust, love and care [8]-[13].”
§ Treatment of Obesity and Diabetes Using Oxytocin or Analogs in Patients and Mouse Models > Discussion > Multi-level therapeutic benefits of OXT and analogs in treating obesity and diabetes
What the sources say
- Not checked yetcites [8]-[13]
plaindirect- Asserted: passes — The authors put it forward as true.
- Checkable: passes — It can be checked against evidence.
- Load-bearing: fails — The paper’s conclusions may not depend on it.
- Based: passes — The paper gives a reason why it holds.
Probably not a substantial claim. The paper’s conclusions may not depend on it.
In the paper
“mental dysfunctions represent a type of risk factors for the development of obesity and diabetes, which probably involves certain brain alterations of metabolic control in addition to the issues such as poor lifestyle and nutrition management [36]-[38].”
§ Treatment of Obesity and Diabetes Using Oxytocin or Analogs in Patients and Mouse Models > Discussion > Potential off-target benefits of OXT and OXT analogs in treating obesity and diabetes
What the sources say
- Not checked yetcites [36]-[38]
hedgedconditional- Asserted: passes — The authors put it forward as true.
- Checkable: passes — It can be checked against evidence.
- Load-bearing: unclear — It is unclear whether the paper’s conclusions depend on it.
- Based: passes — The paper gives a reason why it holds.
It may state two separate claims as one.
A conclusion the paper draws from its own results — it cites no other source for it, so there is none to check. The quote shows it is in the paper.
In the paper
“OXT has social-neuropsychiatric benefits which can possibly aid to control metabolic disease.”
§ Treatment of Obesity and Diabetes Using Oxytocin or Analogs in Patients and Mouse Models > Discussion > Potential off-target benefits of OXT and OXT analogs in treating obesity and diabetes
hedgedconditional- Asserted: passes — The authors put it forward as true.
- Checkable: passes — It can be checked against evidence.
- Load-bearing: unclear — It is unclear whether the paper’s conclusions depend on it.
- Based: passes — The paper gives a reason why it holds.
It may state two separate claims as one.
The paper relies on this without support.
Obesity in humans is associated with pre-type 2 diabetes changes such as glucose intolerance, insulin resistance and hyperlipidemia.
“Clinical epidemiology has established that obesity in humans is associated with pre-type 2 diabetes (T2D) changes such as glucose intolerance, insulin resistance and hyperlipidemia.”
The paper relies on this without support.
Drug delivery via brain injection is impractical in humans.
“given that drug delivery via brain injection is impractical in humans”
The paper relies on this without support.
Peripherally delivered peptides often cannot effectively reach the central sites due to the physical and biological blockade of the blood-brain barrier.
“peripherally delivered peptides often cannot effectively reach the central sites due to the physical and biological blockade of the BBB.”
The paper relies on this without support.
Type 2 diabetes develops when insulin secretion is impaired to a level that cannot compensate for systemic insulin resistance, and obesity can potentiate the progression of both insulin resistance and impaired insulin secretion.
“T2D develops when insulin secretion is impaired to a level that cannot compensate for systemic insulin resistance, and the presence of obesity can potentiate the progression of both insulin resistance and impaired insulin secretion.”
Claims other papers make about this one
Each is checked against this paper’s own text: does it say what the citing paper says it does?
In the citing paper
“Preclinical studies indicate that oxytocin has positive metabolic effects(11, 12).”
From Oxytocin reduces caloric intake in men (2015) · cites this paper as [12]
In the citing paper
“A small study of obese men and women found that intranasal oxytocin four times per day led to weight loss of nearly 20 lbs over eight weeks(12).”
From Oxytocin reduces caloric intake in men (2015) · cites this paper as [12]
In the citing paper
“In obese mice, oxytocin reduces fasting insulin secretion and insulin resistance and improves glucose tolerance prior to a change in weight(12).”
From Oxytocin reduces caloric intake in men (2015) · cites this paper as [12]
In the citing paper
“However, Zhang et al. did not show effects of sustained intranasal oxytocin on fasting insulin or glucose levels in a small study of nondiabetic obese men and women(12).”
From Oxytocin reduces caloric intake in men (2015) · cites this paper as [12]
Self-check
Percentages, sums and reported differences re-computed from the paper’s own numbers.
Each contradiction between two passages listed here was confirmed by an independent check.
Rated minor: it would not touch a result — a value no result rests on, a p-value that stays on the same side of the significance level, or a conflict that is clerical, resolved elsewhere in the paper, or outside its own findings.
In the paper
§ Treatment of Obesity and Diabetes Using Oxytocin or Analogs in Patients and Mouse Models > Results > Anti-diabetic treatment in mice through peripheral injection of OXT
“then received daily i.p. injections of [Ser4, Ile8]-OXT or vehicle.”
§ Treatment of Obesity and Diabetes Using Oxytocin or Analogs in Patients and Mouse Models > Materials and Methods > Clinical study
“HFD-fed mice were twice injected with OXT or OXT analog via third-ventricle cannula (4 μg per injection) or i.p. (2 mg/kg body weight per injection), once at the beginning of overnight fasting and once in the morning prior to GTT.”
Citations
Cites
Oxytocin increases trust in humans
Kosfeld, M., Heinrichs, M., Zak, P. J., Fischbacher, U., & Fehr, E. (2005) · Nature · doi:10.1038/nature03701 · Cited by 3,690
Bariatric Surgery versus Intensive Medical Therapy in Obese Patients with Diabetes
Schauer, P. R., Kashyap, S. R., Wolski, K., Brethauer, S. A., Kirwan, J. P., Pothier, C. E., Thomas, S., Abood, B., Nissen, S. E., & Bhatt, D. L. (2012) · New England Journal of Medicine · doi:10.1056/nejmoa1200225 · Cited by 2,164
Bariatric Surgery versus Conventional Medical Therapy for Type 2 Diabetes
Mingrone, G., Panunzi, S., De Gaetano, A., Guidone, C., Iaconelli, A., Leccesi, L., Nanni, G., Pomp, A., Castagneto, M., Ghirlanda, G., et al. (2012) · New England Journal of Medicine · doi:10.1056/nejmoa1200111 · Cited by 1,791
Oxytocin and vasopressin in the human brain: social neuropeptides for translational medicine
Meyer-Lindenberg, A., Domes, G., Kirsch, P., & Heinrichs, M. (2011) · Nature Reviews Neuroscience · doi:10.1038/nrn3044 · Cited by 1,688
Oxytocin, vasopressin, and the neurogenetics of sociality
Donaldson, Z. R., & Young, L. J. (2008) · Science · doi:10.1126/science.1158668 · Cited by 1,645
Hypothalamic IKKβ/NF-κB and ER Stress Link Overnutrition to Energy Imbalance and Obesity
Zhang, X., Zhang, G., Zhang, H., Karin, M., Bai, H., & Cai, D. (2008) · Cell · doi:10.1016/j.cell.2008.07.043 · Cited by 1,350
Self-citationSocial amnesia in mice lacking the oxytocin gene
Ferguson, J. N., Young, L. J., Hearn, E. F., Matzuk, M. M., Insel, T. R., & Winslow, J. T. (2000) · Nature Genetics · doi:10.1038/77040 · Cited by 1,130
Promoting social behavior with oxytocin in high-functioning autism spectrum disorders.
Andari, E., Duhamel, J.-R., Zalla, T., Herbrecht, E., Leboyer, M., & Sirigu, A. (2010) · Proceedings of the National Academy of Sciences · doi:10.1073/pnas.0910249107 · Cited by 941
Laferrère, B., Teixeira, J., McGinty, J., Tran, H., Egger, J. R., Colarusso, A., Kovack, B., Bawa, B., Koshy, N., Lee, H., et al. (2008) · The Journal of Clinical Endocrinology & Metabolism · doi:10.1210/jc.2007-2851 · Cited by 682 · cited 1×
“In addition, bariatric procedures can have immediate effects in lowering blood sugar levels in diabetes prior to evident changes of body weight [4,5], and this obesity-independent hypoglycemic effect has been related to the action of GLP-1 in promoting insulin section [3,6].”
Identifying hypothalamic pathways controlling food intake, body weight, and glucose homeostasis
Elmquist, J. K., Coppari, R., Balthasar, N., Ichinose, M., & Lowell, B. B. (2005) · The Journal of Comparative Neurology · doi:10.1002/cne.20786 · Cited by 406
Cited by
Sorted by citations
Successful aging: Advancing the science of physical independence in older adults
Anton, S. D., Woods, A. J., Ashizawa, T., Barb, D., Buford, T. W., Carter, C. S., Clark, D. J., Cohen, R. A., Corbett, D. B., Cruz-Almeida, Y., et al. (2015) · Ageing Research Reviews · doi:10.1016/j.arr.2015.09.005 · Cited by 292
“(Neogi and Zhang 2013) Chronic pain significantly contributes to functional decline and activity limitation, (Fletcher, Guthrie, Berg, and Hirdes 2010;Pisters, Veenhof, van Dijk, Heymans, Twisk, and Dekker 2012;Rossi, Pereira, Driusso, Rebelatto, and Ricci 2013;White, Felson, Niu, Nevitt, Lewis,…”
BackgroundPharmacotherapy of obesity: available medications and drugs under investigation.
Pilitsi, E., Farr, O. M., Polyzos, S. A., Perakakis, N., Nolen-Doerr, E., Papathanasiou, A.-E., & Mantzoros, C. S. (2019) · Metabolism · doi:10.1016/j.metabol.2018.10.010 · Cited by 248
Oxytocin Reduces Reward-Driven Food Intake in Humans
Ott, V., Finlayson, G., Lehnert, H., Heitmann, B., Heinrichs, M., Born, J., & Hallschmid, M. (2013) · Diabetes · doi:10.2337/db13-0663 · Cited by 226
Oxytocin reduces caloric intake in men
Lawson, E. A., Marengi, D. A., DeSanti, R. L., Holmes, T. M., Schoenfeld, D. A., & Tolley, C. J. (2015) · Obesity · doi:10.1002/oby.21069 · Cited by 208
The effects of oxytocin on eating behaviour and metabolism in humans
Lawson, E. A. (2017) · Nature Reviews Endocrinology · doi:10.1038/nrendo.2017.115 · Cited by 196
Metadata
- Authors
- Zhang, H., Wu, C., Chen, Q., Chen, X., Xu, Z., Wu, J., & Cai, D.
- Affiliations
- Jiangsu University (CN)
- Albert Einstein College of Medicine (US)
- Corresponding author
- Cai, Dongsheng
- Venue
- PLoS ONE
- Publisher
- Public Library of Science (PLoS)
- Published
- 2013-05-20
- Volume
- 8
- Issue
- 5
- Pages
- e61477
- ISSN
- 1932-6203 (ISSN-L)
- PMC
- PMC3658979
- OpenAlex
- W2076652575
- Semantic Scholar
- 2c3ca2d1baa04d2898bb99c3fbf361f269adcf93
- Cited by
- 224
- References
- 39
- Citations by year
- 2026: 7 · 2025: 7 · 2024: 9 · 2023: 14 · 2022: 14 · 2021: 24 · 2020: 17 · 2019: 23 · 2018: 30 · 2017: 27 · 2016: 23 · 2015: 13 · 2014: 14 · 2013: 2
- FWCI
- 17.07
- Type
- journal article
- Language
- en
- Open access
- gold
- doi.org
- Locations
- PLoS ONE (publishedVersion, cc-by)
- Europe PMC (PubMed Central) (publishedVersion, cc-by)
- PubMed Central (publishedVersion, cc-by)
- PubMed (publishedVersion)
- DOAJ (DOAJ: Directory of Open Access Journals) (submittedVersion, cc-by-sa)
- Figshare (submittedVersion, cc-by)
- Funders
- National Institutes of Health (DK078750)
- National Institute on Aging (R01AG031774)
- National Institute of Diabetes and Digestive and Kidney Diseases (R01DK078750)
- Topics
- Health Sciences › Medicine › Endocrinology, Diabetes and Metabolism › Pancreatic function and diabetes
- Health Sciences › Medicine › Endocrinology, Diabetes and Metabolism › Adipokines, Inflammation, and Metabolic Diseases
- Health Sciences › Medicine › Endocrinology, Diabetes and Metabolism › Diabetes Treatment and Management
- Keywords
- oxytocin, oxytocin analogues, obesity, type 2 diabetes, prediabetes, insulin resistance, insulin secretion, impaired glucose tolerance, intranasal administration, streptozotocin-induced diabetes, weight management, peptide therapeutics
- MeSH terms
- Insulin Secretion, Administration, Intranasal, Adult, Animals, Blood Glucose, Diabetes Mellitus, Experimental, Diabetes Mellitus, Type 2, Female, Humans, Hypoglycemic Agents, Insulin, Insulin Resistance, Male, Mice, Inbred C57BL, Middle Aged, Obesity, Oxytocin, Pilot Projects, Prediabetic State, Glucose Intolerance, Lipid Metabolism, Mice, Young Adult
About these checks
Registry, retraction, Cites and statistics results are computed, not judged, with one exception: a printed reference that no index lists is read once by a model before it counts as a citation error. Claims are extracted by a model and kept only when their quote appears verbatim in the text; each cited source is then checked, with a model’s help, for whether it says what the claim relies on. Those verdicts can be wrong — read the claim’s quote and the cited source before relying on one.
A language model drew the claims from the paper on 2026-10-09, under version 3 of the claim definition (model deepseek-v4.1-flash, prompt extract-v3).
A second model labelled each claim on 2026-10-09 (model jev-1.13-20260917, definition revision gold-guideline-v0.2).
Cited sources are checked with a language model’s help (gpt-6-sol).
Statistics and arithmetic are recomputed, not judged.
Confidence bands are shown only for fields calibrated on our annotated test set. None is calibrated yet, so no band is shown.
What counts as a claim ›How we measure confidence ›How we check this ›
Are you an author, or do you see a problem with this page? Request a review
