Cited by 129Adenosine and Purinergic SignalingTreatment of Major DepressionNeuroscience and Neuropharmacology Research

The DOI matches its Crossref record; 109 of the 109 references it cites were found in a registry or an index.

Neurochemical Changes in the Mouse Hippocampus Underlying the Antidepressant Effect of Genetic Deletion of P2X7 Receptors

Open access

Abstract

Recent investigations have revealed that the genetic deletion of P2X7 receptors (P2rx7) results in an antidepressant phenotype in mice. However, the link between the deficiency of P2rx7 and changes in behavior has not yet been explored. In the present study, we studied the effect of genetic deletion of P2rx7 on neurochemical changes in the hippocampus that might underlie the antidepressant phenotype. P2X7 receptor deficient mice (P2rx7-/-) displayed decreased immobility in the tail suspension test (TST) and an attenuated anhedonia response in the sucrose preference test (SPT) following bacterial endotoxin (LPS) challenge. The attenuated anhedonia was reproduced through systemic treatments with P2rx7 antagonists. The activation of P2rx7 resulted in the concentration-dependent release of [(3)H]glutamate in P2rx7+/+ but not P2rx7-/- mice, and the NR2B subunit mRNA and protein was upregulated in the hippocampus of P2rx7-/- mice. The brain-derived neurotrophic factor (BDNF) expression was higher in saline but not LPS-treated P2rx7-/- mice; the P2rx7 antagonist Brilliant blue G elevated and the P2rx7 agonist benzoylbenzoyl ATP (BzATP) reduced BDNF level. This effect was dependent on the activation of NMDA and non-NMDA receptors but not on Group I metabotropic glutamate receptors (mGluR1,5). An increased 5-bromo-2-deoxyuridine (BrdU) incorporation was also observed in the dentate gyrus derived from P2rx7-/- mice. Basal level of 5-HT was increased, whereas the 5HIAA/5-HT ratio was lower in the hippocampus of P2rx7-/- mice, which accompanied the increased uptake of [(3)H]5-HT and an elevated number of [(3)H]citalopram binding sites. The LPS-induced elevation of 5-HT level was absent in P2rx7-/- mice. In conclusion there are several potential mechanisms for the antidepressant phenotype of P2rx7-/- mice, such as the absence of P2rx7-mediated glutamate release, elevated basal BDNF production, enhanced neurogenesis and increased 5-HT bioavailability in the hippocampus.

Overview

The claims and statistics of this paper haven’t been checked yet.

Run the check — free, no account needed. It reads the open-access text and checks the sources it cites.

A few free checks a day · papers already verified open instantly · results are public

Integrity signals

Registry

Crossref · 10.1371/journal.pone.0066547

Cites

109 of 109 references verified0 citation errors · 0 not checkable

Statistics

Figures

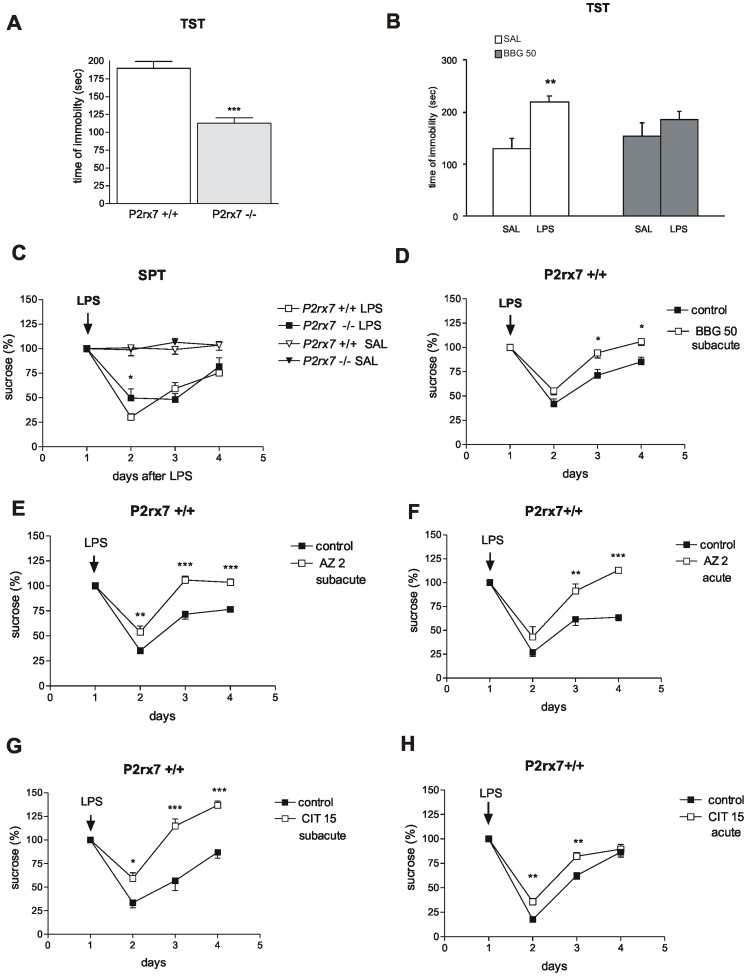
Figure 1 Genetic deletion and pharmacological inhibition of P2rx7 results in antidepressant phenotype in mice using the TST (A, B) and SPT (C–H) tests. A/Genetic disruption of P2rx7 expression decreases basal immobility in the TST (n = 6,10, ***P<0.001 vs. P2rx7+/+, Student t test). The immobility time is expressed in sec. The total test period was 360 sec. B/Effect of acute BBG treatment (50 mg/kg i.p.) on LPS-induced depressive behavior in TST. LPS was added at a dose of 1 mg/kg at 24 h before testing (n = 7–9, **P<0.01 vs. SAL, Student t test). BBG was administered intraperitoneally at 30 min before testing; saline-treated mice (SAL) were injected with equal volume of saline. C/LPS-induced decline in sucrose preference is attenuated in P2rx7−/− mice. Baseline sucrose intake was measured under a habituation period of 3–4 days before treatment, and the mean volume ingested over the last 3 training sessions was used as a baseline value. The mice were treated with LPS (0.2 mg/kg i.p.) or an equal volume of saline (SAL), indicated by an arrow, and the sucrose intake was monitored over subsequent days. LPS substantially decreased sucrose consumption as a sign of anhedonia (FLPS(1, 63) = 1193; P<0.0001). The sucrose consumption was expressed as a percentage of the baseline (%). N = 9–14, *P<0.05 vs. P2rx7+/+. Two-way ANOVA, followed by Fischer LSD test. D-H/The P2X7 receptor antagonists Brilliant blue G (BBG), AZ-10606120 (AZ), and the selective 5-HT re-uptake inhibitor citalopram (CIT) inhibit the development of LPS-induced anhedonia in P2rx7+/+ mice. D/The antidepressant effect of a subacute, 4-day treatment with BBG (50 mg/kg i.p./day, n = 8–20, *P<0.05, vs. control). E/The effect of subacute (AZ 2 subacute) AZ-10606120 treatment on LPS-induced anhedonia. Notably, in this protocol, AZ-10606120 significantly attenuated the decline in sucrose consumption at 24 h after LPS treatment. (FAZ (1,39) = 1179.4, P<0.00001; n = 5–9, **P<0.01, ***P<0.001 vs. control). F/The effect of acute AZ-10606120 (AZ 2, acute) treatment on LPS-induced anhedonia. When mice were pretreated with AZ-10606120 for 30 min before LPS injection at the doses indicated in the legend (mg/kg), sucrose consumption on the 2nd and 3rd day after LPS injection was significantly higher (n = 7–8, **P<0.01, ***P<0.001 vs. control). G and H/. Effect of 4-day subacute (CIT 15 subacute, G), and single acute treatment with citalopram (CIT 15, acute, H) on LPS-induced anhedonia. Citalopram elicited a comparable effect to AZ-10606120 using both application protocols (n = 5–10, **P<0.01, ***P<0.001 vs. control). The sucrose consumption in all experiments was evaluated at 0, 24, 48 and 72 h after LPS injection and expressed as a percentage of the baseline. Two-way ANOVA, followed by Fischer LSD test was performed as statistical analyses in SPT datasets. 2–3 months old drug- and test-naive male homozygous mice (P2rx7+/+ and P2rx7−/−), weighing approximately 30 g were used in the experiments.
Figure 1 Genetic deletion and pharmacological inhibition of P2rx7 results in antidepressant phenotype in mice using the TST (A, B) and SPT (C–H) tests. A/Genetic disruption of P2rx7 expression decreases basal immobility in the TST (n = 6,10, ***P<0.001 vs. P2rx7+/+, Student t test). The immobility time is expressed in sec. The total test period was 360 sec. B/Effect of acute BBG treatment (50 mg/kg i.p.) on LPS-induced depressive behavior in TST. LPS was added at a dose of 1 mg/kg at 24 h before testing (n = 7–9, **P<0.01 vs. SAL, Student t test). BBG was administered intraperitoneally at 30 min before testing; saline-treated mice (SAL) were injected with equal volume of saline. C/LPS-induced decline in sucrose preference is attenuated in P2rx7−/− mice. Baseline sucrose intake was measured under a habituation period of 3–4 days before treatment, and the mean volume ingested over the last 3 training sessions was used as a baseline value. The mice were treated with LPS (0.2 mg/kg i.p.) or an equal volume of saline (SAL), indicated by an arrow, and the sucrose intake was monitored over subsequent days. LPS substantially decreased sucrose consumption as a sign of anhedonia (FLPS(1, 63) = 1193; P<0.0001). The sucrose consumption was expressed as a percentage of the baseline (%). N = 9–14, *P<0.05 vs. P2rx7+/+. Two-way ANOVA, followed by Fischer LSD test. D-H/The P2X7 receptor antagonists Brilliant blue G (BBG), AZ-10606120 (AZ), and the selective 5-HT re-uptake inhibitor citalopram (CIT) inhibit the development of LPS-induced anhedonia in P2rx7+/+ mice. D/The antidepressant effect of a subacute, 4-day treatment with BBG (50 mg/kg i.p./day, n = 8–20, *P<0.05, vs. control). E/The effect of subacute (AZ 2 subacute) AZ-10606120 treatment on LPS-induced anhedonia. Notably, in this protocol, AZ-10606120 significantly attenuated the decline in sucrose consumption at 24 h after LPS treatment. (FAZ (1,39) = 1179.4, P<0.00001; n = 5–9, **P<0.01, ***P<0.001 vs. control). F/The effect of acute AZ-10606120 (AZ 2, acute) treatment on LPS-induced anhedonia. When mice were pretreated with AZ-10606120 for 30 min before LPS injection at the doses indicated in the legend (mg/kg), sucrose consumption on the 2nd and 3rd day after LPS injection was significantly higher (n = 7–8, **P<0.01, ***P<0.001 vs. control). G and H/. Effect of 4-day subacute (CIT 15 subacute, G), and single acute treatment with citalopram (CIT 15, acute, H) on LPS-induced anhedonia. Citalopram elicited a comparable effect to AZ-10606120 using both application protocols (n = 5–10, **P<0.01, ***P<0.001 vs. control). The sucrose consumption in all experiments was evaluated at 0, 24, 48 and 72 h after LPS injection and expressed as a percentage of the baseline. Two-way ANOVA, followed by Fischer LSD test was performed as statistical analyses in SPT datasets. 2–3 months old drug- and test-naive male homozygous mice (P2rx7+/+ and P2rx7−/−), weighing approximately 30 g were used in the experiments.CC BY · PubMed Central
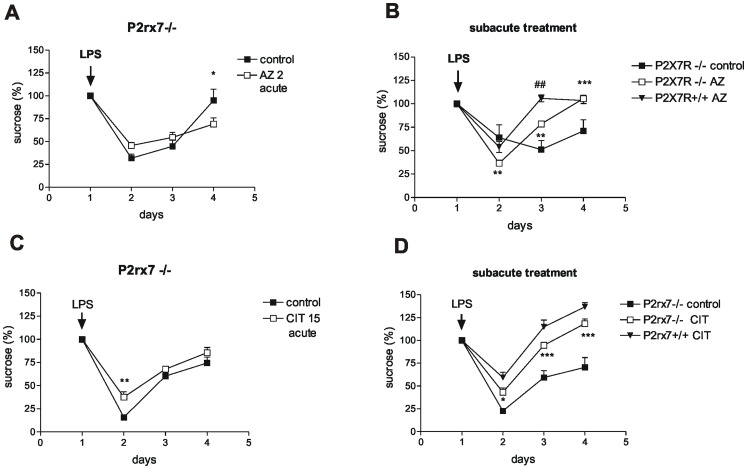
Figure 2 The effect of P2X7 receptor antagonist AZ-10606120 (AZ) and citalopram (CIT) on LPS-induced anhedonia in P2rx7−/− mice. A and C/The effect of acute AZ-10606120 (AZ 2 acute, A) and citalopram (CIT 15 acute, C) treatment on LPS-induced anhedonia. The protocols were identical to those depicted in Fig. 1 F and H, respectively. The inhibitory effect of AZ-10606120, but not citalopram, was abolished in P2rx7−/− mice (n = 4–11, *P<0.05, **P<0.01 vs. control). B/D/Effect of subacute, 4-day treatment with AZ-10606120 (AZ, B) and citalopram (CIT, D) on LPS-induced anhedonia. The protocol was identical to the experiments depicted in Fig. 1 E and G, respectively. Although both citalopram and AZ-10606120 alleviated anhedonia over subsequent days in these mice, the effect of AZ-10606120, but not citalopram, was significantly attenuated compared with the effect measured in P2rx7+/+ mice (n = 5–11, **P<0.01, ***P<0.001 vs. control, ##P<0.01 vs. subacute AZ in P2rx7+/+ mice, two-way ANOVA, followed by Fischer LSD test).
Figure 2 The effect of P2X7 receptor antagonist AZ-10606120 (AZ) and citalopram (CIT) on LPS-induced anhedonia in P2rx7−/− mice. A and C/The effect of acute AZ-10606120 (AZ 2 acute, A) and citalopram (CIT 15 acute, C) treatment on LPS-induced anhedonia. The protocols were identical to those depicted in Fig. 1 F and H, respectively. The inhibitory effect of AZ-10606120, but not citalopram, was abolished in P2rx7−/− mice (n = 4–11, *P<0.05, **P<0.01 vs. control). B/D/Effect of subacute, 4-day treatment with AZ-10606120 (AZ, B) and citalopram (CIT, D) on LPS-induced anhedonia. The protocol was identical to the experiments depicted in Fig. 1 E and G, respectively. Although both citalopram and AZ-10606120 alleviated anhedonia over subsequent days in these mice, the effect of AZ-10606120, but not citalopram, was significantly attenuated compared with the effect measured in P2rx7+/+ mice (n = 5–11, **P<0.01, ***P<0.001 vs. control, ##P<0.01 vs. subacute AZ in P2rx7+/+ mice, two-way ANOVA, followed by Fischer LSD test).CC BY · PubMed Central
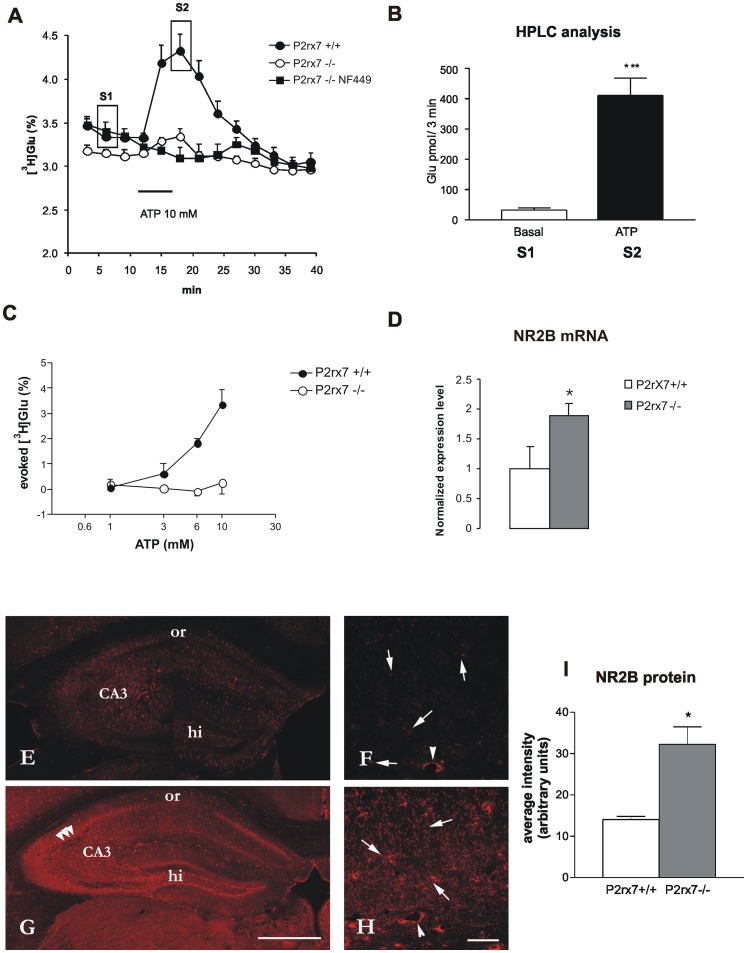
Figure 3 The effect of the genetic deletion of P2rx7 on ATP-evoked tritiated (A, C) and endogenous (B) glutamate efflux (D) mRNA expression and (E–I) immunofluorescence staining of the NR2B subunit of the NMDA receptors in acute hippocampal slices. A/10 mM ATP was used to induce [3H]Glu release from hippocampal slices of P2rx7+/+ and P2rx7−/− mice. After a 60-min preperfusion, the basal extracellular [3H]Glu efflux was lower in P2rx7−/− mice. 6-min perfusion of ATP (10 mM) resulted in a transient increase in the efflux of [3H]Glu in P2rx7+/+ mice, which peaked at 6 min after ATP administration and gradually decreased to baseline levels after 12 min. The ATP-evoked [3H]Glu efflux is substantially decreased in the hippocampus of P2rx7−/− mice, and the residual efflux is abolished by the selective P2X1 receptor antagonist NF449 (100 nM), which was applied at 15 min before ATP perfusion. [3H]Glu release is expressed as a percentage of the amount of radioactivity in the tissue at the sample collection time (fractional release). For the evaluation of the basal tritium outflow, the tritium content of the first four consecutive 3-min samples were taken into account. The curves represent the mean ± SEM of 8–12 identical experiments. B/HPLC analysis. Samples indicated in (A) as S1 and S2 were analyzed. ATP perfusion (10 mM) significantly increases the endogenous Glu level in the effluent. Results are expressed as pmol/3 min. N = 8, ***P<0.001. C/Concentration-response relationship of ATP-evoked [3H]Glu efflux in P2rx7+/+ and P2rx7−/− mice. Experiments were performed according to the protocol shown in (A), using different concentrations of ATP, as indicated in the abscissa. The net ATP-induced release was calculated and expressed as the fractional release (%). The curves represent the mean ± S.E.M. of 4–12 identical experiments. D/Changes in the mRNA expression levels of the NMDA-NR2B receptor in hippocampus obtained from P2rx7+/+ and P2rx7−/− mice. Immediately after the 60-min incubation, the brain slices were removed and total RNA was extracted from the hippocampus and reverse transcribed to cDNA. Quantitative SYBR Green real-time PCR was performed using specific primers, as described in Methods, and cDNA as a template. The experiments were repeated two times with similar results. The expression level of the NR2B receptor was normalized to that of the distinct housekeeping gene, 18S rRNA. The data are displayed as the mean ± SEM. Asterisk indicates significant difference from the P2rx7+/+ mice (*P<0.05, Student’s t-test). E-I/Immunofluorescence staining for NR2B on hippocampal sections of P2rx7+/+ and P2rx7−/− mice. Besides the typical dotted staining most likely presenting NR2B - immunolabelled terminals (arrows, F, H) some staining is observable around cell bodies especially in the pyramidal cell layer (three arrowheads G). The whole staining is more intense in the hippocampal section of P2rx7−/− mouse (G, I). The most intense staining is observed in the CA3 regions (CA3 on E, G and F, H), while stratum oriens (or) shows the least immunoreactivity either in P2rx7+/+ and P2rx7−/− sample. Contrary to P2rx7+/+ staining (E), intense immunofluorescence illustrates hilus region on P2rx7−/− (G) sample. Images acquired at higher magnification (F,H) also show blood vessels (arrowheads), stained at the same level in both sections (background staining). bars: 50 µm in F, H, 500 µm in E, G. I. Immunofluorescence staining intensity for NR2B in P2rx7+/+ and P2rx7−/− mice. Average intensity was quantified with NIH ImageJ program (U.S. National Institutes of Health, Bethesda, MD) and is expressed in arbitrary units. Asterisk indicates significant difference from the wild type mice (*P<0.05, Student’s t-test, n = 3).
Figure 3 The effect of the genetic deletion of P2rx7 on ATP-evoked tritiated (A, C) and endogenous (B) glutamate efflux (D) mRNA expression and (E–I) immunofluorescence staining of the NR2B subunit of the NMDA receptors in acute hippocampal slices. A/10 mM ATP was used to induce [3H]Glu release from hippocampal slices of P2rx7+/+ and P2rx7−/− mice. After a 60-min preperfusion, the basal extracellular [3H]Glu efflux was lower in P2rx7−/− mice. 6-min perfusion of ATP (10 mM) resulted in a transient increase in the efflux of [3H]Glu in P2rx7+/+ mice, which peaked at 6 min after ATP administration and gradually decreased to baseline levels after 12 min. The ATP-evoked [3H]Glu efflux is substantially decreased in the hippocampus of P2rx7−/− mice, and the residual efflux is abolished by the selective P2X1 receptor antagonist NF449 (100 nM), which was applied at 15 min before ATP perfusion. [3H]Glu release is expressed as a percentage of the amount of radioactivity in the tissue at the sample collection time (fractional release). For the evaluation of the basal tritium outflow, the tritium content of the first four consecutive 3-min samples were taken into account. The curves represent the mean ± SEM of 8–12 identical experiments. B/HPLC analysis. Samples indicated in (A) as S1 and S2 were analyzed. ATP perfusion (10 mM) significantly increases the endogenous Glu level in the effluent. Results are expressed as pmol/3 min. N = 8, ***P<0.001. C/Concentration-response relationship of ATP-evoked [3H]Glu efflux in P2rx7+/+ and P2rx7−/− mice. Experiments were performed according to the protocol shown in (A), using different concentrations of ATP, as indicated in the abscissa. The net ATP-induced release was calculated and expressed as the fractional release (%). The curves represent the mean ± S.E.M. of 4–12 identical experiments. D/Changes in the mRNA expression levels of the NMDA-NR2B receptor in hippocampus obtained from P2rx7+/+ and P2rx7−/− mice. Immediately after the 60-min incubation, the brain slices were removed and total RNA was extracted from the hippocampus and reverse transcribed to cDNA. Quantitative SYBR Green real-time PCR was performed using specific primers, as described in Methods, and cDNA as a template. The experiments were repeated two times with similar results. The expression level of the NR2B receptor was normalized to that of the distinct housekeeping gene, 18S rRNA. The data are displayed as the mean ± SEM. Asterisk indicates significant difference from the P2rx7+/+ mice (*P<0.05, Student’s t-test). E-I/Immunofluorescence staining for NR2B on hippocampal sections of P2rx7+/+ and P2rx7−/− mice. Besides the typical dotted staining most likely presenting NR2B - immunolabelled terminals (arrows, F, H) some staining is observable around cell bodies especially in the pyramidal cell layer (three arrowheads G). The whole staining is more intense in the hippocampal section of P2rx7−/− mouse (G, I). The most intense staining is observed in the CA3 regions (CA3 on E, G and F, H), while stratum oriens (or) shows the least immunoreactivity either in P2rx7+/+ and P2rx7−/− sample. Contrary to P2rx7+/+ staining (E), intense immunofluorescence illustrates hilus region on P2rx7−/− (G) sample. Images acquired at higher magnification (F,H) also show blood vessels (arrowheads), stained at the same level in both sections (background staining). bars: 50 µm in F, H, 500 µm in E, G. I. Immunofluorescence staining intensity for NR2B in P2rx7+/+ and P2rx7−/− mice. Average intensity was quantified with NIH ImageJ program (U.S. National Institutes of Health, Bethesda, MD) and is expressed in arbitrary units. Asterisk indicates significant difference from the wild type mice (*P<0.05, Student’s t-test, n = 3).CC BY · PubMed Central
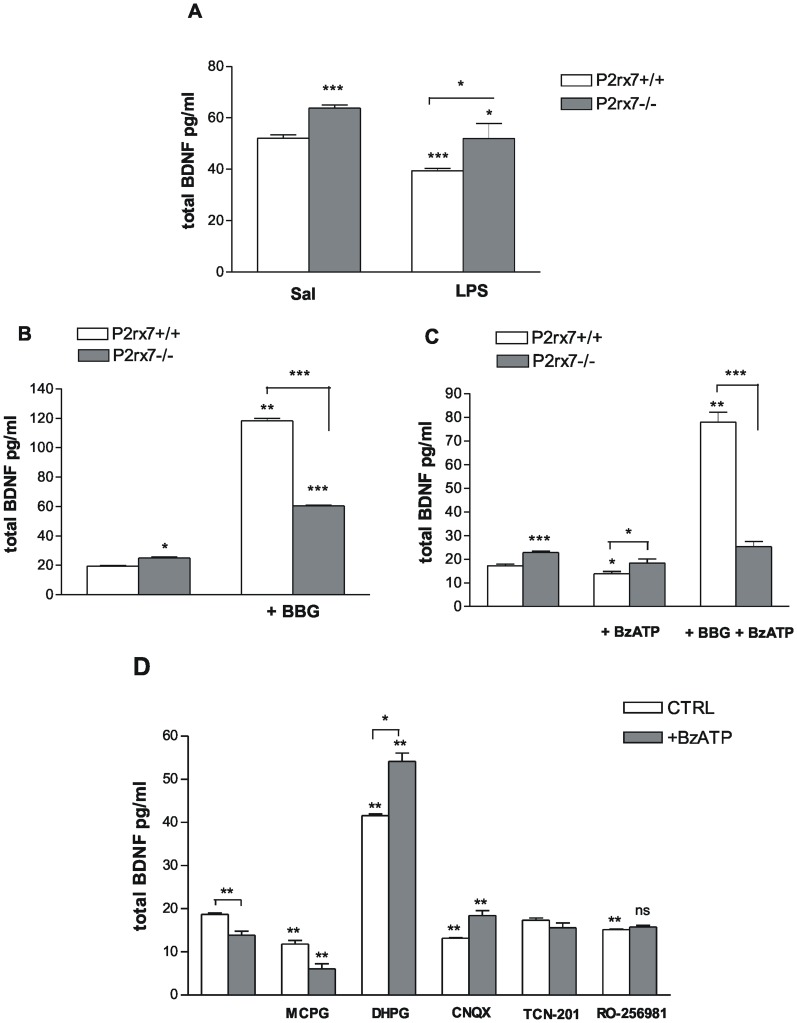
Figure 4 P2rx7 participates in the regulation of the basal BDNF expression in the mouse hippocampus. A/BDNF protein expression in the hippocampus of P2rx7+/+ and P2rx7−/− mice after saline (Sal) and LPS (1 mg/kg i.p.) treatment. Intraperitoneal injection of LPS significantly decreased the level of BDNF expression in the hippocampus of P2rx7+/+ mice at 24 h after treatment compared with saline treatment (Sal). The BDNF protein level was significantly higher in the hippocampus of saline treated P2rx7−/− mice. The animals were sacrificed at 24 h after the injection of LPS/saline. The data are given as the mean level of neurotrophin ± SEM. Asterisks indicate significant differences between the saline and LPS-treated groups and between the WT and P2rx7−/− groups (n = 4–6, *P<0.05, *** P<0.001). B, C Effect of the P2X7 receptor antagonist BBG (B) and the P2X agonist BzATP (C) on the basal level of BDNF in the hippocampus of P2rx7+/+ and P2rx7−/− mice. The P2rx7 antagonist Brilliant Blue G (BBG, 100 nM) was applied 15 min before the start of BzATP incubation, and BzATP (100 µM) was added for 30 min. Notably, in the experiments with BzATP (C), Mg2+ was omitted from the incubation solution (see Methods). The data are given as the mean level of neurotrophin ± SEM. Asterisks indicate significant differences calculated by one-way ANOVA followed by Dunnett’s test (multiple comparisons) and Student’s t-test (pairwise comparisons) (*P<0.05, **P<0.01,***P<0.001). D/Effect of glutamate receptor antagonists and agonist on the basal and BzATP-induced decrease in BDNF expression in hippocampal slices of P2rx7+/+ mice. The inhibitory effect of BzATP (100 µM) could be counteracted using CNQX (10 µM), the non-NMDA-type glutamate receptor antagonist, TCN-201 (10 µM), the NMDA-NR1/NR2A glutamate receptor antagonist and RO-256981 (3 µM) the NMDA-NR2B glutamate receptor antagonist but not using MCPG (200 µM), the group I mGluR antagonist. CNQX, TCN-201 and RO-256981 was added for 15 min, MCPG was applied for 30 min, and the group I mGluR agonist, DHPG (100 µM), was administered for 10 min. Data are given as the mean level of neurotrophin ± SEM with and without (first columns) the indicated antagonists in the presence (BzATP) or absence (CTRL) of BzATP. Asterisks indicate significant differences calculated using one-way ANOVA followed by Dunnett’s test and Student’s t-test (ns P>0.05, **P<0.01), as appropriate, indicated by the horizontal bars.
Figure 4 P2rx7 participates in the regulation of the basal BDNF expression in the mouse hippocampus. A/BDNF protein expression in the hippocampus of P2rx7+/+ and P2rx7−/− mice after saline (Sal) and LPS (1 mg/kg i.p.) treatment. Intraperitoneal injection of LPS significantly decreased the level of BDNF expression in the hippocampus of P2rx7+/+ mice at 24 h after treatment compared with saline treatment (Sal). The BDNF protein level was significantly higher in the hippocampus of saline treated P2rx7−/− mice. The animals were sacrificed at 24 h after the injection of LPS/saline. The data are given as the mean level of neurotrophin ± SEM. Asterisks indicate significant differences between the saline and LPS-treated groups and between the WT and P2rx7−/− groups (n = 4–6, *P<0.05, *** P<0.001). B, C Effect of the P2X7 receptor antagonist BBG (B) and the P2X agonist BzATP (C) on the basal level of BDNF in the hippocampus of P2rx7+/+ and P2rx7−/− mice. The P2rx7 antagonist Brilliant Blue G (BBG, 100 nM) was applied 15 min before the start of BzATP incubation, and BzATP (100 µM) was added for 30 min. Notably, in the experiments with BzATP (C), Mg2+ was omitted from the incubation solution (see Methods). The data are given as the mean level of neurotrophin ± SEM. Asterisks indicate significant differences calculated by one-way ANOVA followed by Dunnett’s test (multiple comparisons) and Student’s t-test (pairwise comparisons) (*P<0.05, **P<0.01,***P<0.001). D/Effect of glutamate receptor antagonists and agonist on the basal and BzATP-induced decrease in BDNF expression in hippocampal slices of P2rx7+/+ mice. The inhibitory effect of BzATP (100 µM) could be counteracted using CNQX (10 µM), the non-NMDA-type glutamate receptor antagonist, TCN-201 (10 µM), the NMDA-NR1/NR2A glutamate receptor antagonist and RO-256981 (3 µM) the NMDA-NR2B glutamate receptor antagonist but not using MCPG (200 µM), the group I mGluR antagonist. CNQX, TCN-201 and RO-256981 was added for 15 min, MCPG was applied for 30 min, and the group I mGluR agonist, DHPG (100 µM), was administered for 10 min. Data are given as the mean level of neurotrophin ± SEM with and without (first columns) the indicated antagonists in the presence (BzATP) or absence (CTRL) of BzATP. Asterisks indicate significant differences calculated using one-way ANOVA followed by Dunnett’s test and Student’s t-test (ns P>0.05, **P<0.01), as appropriate, indicated by the horizontal bars.CC BY · PubMed Central
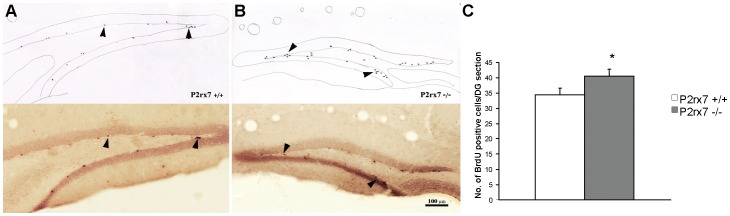
Figure 5 Summary of BrdU staining in P2rx7+/+ (A) and P2rx7−/− (B) mice. A, B/Representative sections show rostral hippocampal DG areas in 1×1 sections of male wild type and P2rx7 knock out mice. Dark dots (arrowheads) represent the BrdU-positive cells (ImmPress-DAB-Ni staining). Camera lucida drawings of the same sections where the newly formed BrdU-labeled cells are indicated. The microscopic picture and drawing were taken at the same magnification (20X), and the bar indicates 100 µm. Histogram showing the average number of BrdU-positive cells in a rostral hippocampal DG area in the granule cell layer and in the 50-µm zone adjacent to its inner edge. C/We observed a significant difference (n = 5, p = 0.046) in the average number of labeled cells in the sections of P2rx7+/+ and P2rx7−/− mice.
Figure 5 Summary of BrdU staining in P2rx7+/+ (A) and P2rx7−/− (B) mice. A, B/Representative sections show rostral hippocampal DG areas in 1×1 sections of male wild type and P2rx7 knock out mice. Dark dots (arrowheads) represent the BrdU-positive cells (ImmPress-DAB-Ni staining). Camera lucida drawings of the same sections where the newly formed BrdU-labeled cells are indicated. The microscopic picture and drawing were taken at the same magnification (20X), and the bar indicates 100 µm. Histogram showing the average number of BrdU-positive cells in a rostral hippocampal DG area in the granule cell layer and in the 50-µm zone adjacent to its inner edge. C/We observed a significant difference (n = 5, p = 0.046) in the average number of labeled cells in the sections of P2rx7+/+ and P2rx7−/− mice.CC BY · PubMed Central
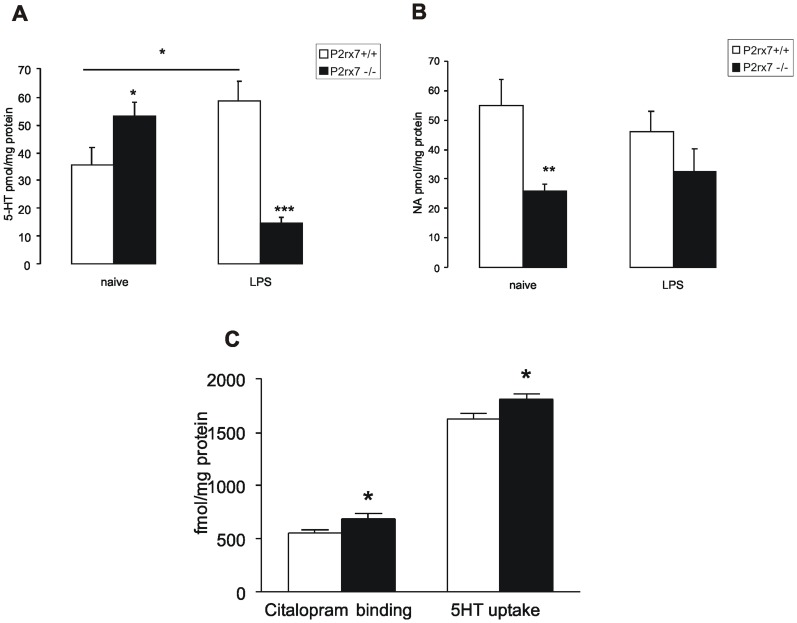
Figure 6 Genetic deletion of P2rx7 leads to the alteration of NA and 5-HT levels (A, B), elevation of3H-Citalopram binding sites and 5-HT uptake (C) in the mouse hippocampus. A, B/NA and 5-HT levels were analyzed using HPLC in the hippocampus of naive and LPS (1 mg/kg)-treated P2rx7+/+ and P2rx7−/− mice. A/5-HT levels are significantly elevated in the hippocampus of untreated P2rx7−/− mice. LPS treatment increases 5-HT levels in the hippocampus of P2rx7+/+ mice. This elevation is absent in P2rx7−/− mice. B/NA levels are significantly decreased in the hippocampus of untreated, but not in LPS-treated P2rx7−/− mice. NA and 5-HT levels are expressed as pmol/mg protein. Data are given as the mean ± SEM of 13–22 experiments. Asterisks denote significant differences related to genotype or LPS treatment (*P<0.05, **P<0.01, ***P<0.001). C/The number (Bmax) of [3H]Citalopram recognition sites was increased in the membrane preparation, and the synaptosomal 5-HT uptake was enhanced in the hippocampus of P2rx7−/− mice (black bars) compared with their P2rx7+/+ littermates (clear bars). Citalopram binding was expressed as fmol/mg protein, and the 5-HT uptake was expressed as fmol/mg protein/10 minutes. Experiments in P2rx7+/+ and P2rx7−/− mice were performed in the same assay. Binding parameters were calculated using Prism3 software. For experimental procedures, see Methods section. Data are given as the mean ± SEM of four independent experiments, * P<0.05.
Figure 6 Genetic deletion of P2rx7 leads to the alteration of NA and 5-HT levels (A, B), elevation of3H-Citalopram binding sites and 5-HT uptake (C) in the mouse hippocampus. A, B/NA and 5-HT levels were analyzed using HPLC in the hippocampus of naive and LPS (1 mg/kg)-treated P2rx7+/+ and P2rx7−/− mice. A/5-HT levels are significantly elevated in the hippocampus of untreated P2rx7−/− mice. LPS treatment increases 5-HT levels in the hippocampus of P2rx7+/+ mice. This elevation is absent in P2rx7−/− mice. B/NA levels are significantly decreased in the hippocampus of untreated, but not in LPS-treated P2rx7−/− mice. NA and 5-HT levels are expressed as pmol/mg protein. Data are given as the mean ± SEM of 13–22 experiments. Asterisks denote significant differences related to genotype or LPS treatment (*P<0.05, **P<0.01, ***P<0.001). C/The number (Bmax) of [3H]Citalopram recognition sites was increased in the membrane preparation, and the synaptosomal 5-HT uptake was enhanced in the hippocampus of P2rx7−/− mice (black bars) compared with their P2rx7+/+ littermates (clear bars). Citalopram binding was expressed as fmol/mg protein, and the 5-HT uptake was expressed as fmol/mg protein/10 minutes. Experiments in P2rx7+/+ and P2rx7−/− mice were performed in the same assay. Binding parameters were calculated using Prism3 software. For experimental procedures, see Methods section. Data are given as the mean ± SEM of four independent experiments, * P<0.05.CC BY · PubMed Central

Verification

Claims the paper makes

The claims and statistics of this paper haven’t been checked yet.

Run the check — free, no account needed. It reads the open-access text and checks the sources it cites.

A few free checks a day · papers already verified open instantly · results are public

Claims other papers make about this one

Each is checked against this paper’s own text: does it say what the citing paper says it does?

Self-check

Percentages, sums and reported differences re-computed from the paper’s own numbers.

The self-check needs the paper’s full text.

Citations

Cites

Show all 109 references

Research works printed but not linked: 1

  1. G Sanacora, 2008, New understanding of mechanisms of action of bipolar medications, J Clin Psychiatry, 69, 22

Cited by

Sorted by citations

See all 129

Metadata

Authors
Csölle, C., Baranyi, M., Zsilla, G., Kittel, Á., Gölöncsér, F., Illes, P., Papp, E., Vizi, E. S., & Sperlágh, B.
Affiliations
  • HUN-REN Institute of Experimental Medicine (HU)
  • Semmelweis University (HU)
Corresponding author
Sperlágh, Beáta
Venue
PLoS ONE
Published
2013-06-21
Volume
8
Issue
6
Pages
e66547
ISSN
1932-6203 (ISSN-L)
OpenAlex
W2089887997
Cited by
128
References
109
Citations by year
2026: 6 · 2025: 6 · 2024: 10 · 2023: 10 · 2022: 19 · 2021: 7 · 2020: 8 · 2019: 13 · 2018: 12 · 2017: 11 · 2016: 9 · 2015: 8 · 2014: 7 · 2013: 1
FWCI
6.92
Type
journal article
Language
en
Open access
Locations
  • PLoS ONE (publishedVersion, cc-by)
  • Europe PMC (PubMed Central) (publishedVersion, other-oa)
  • PubMed Central (publishedVersion, cc-by)
  • PubMed (publishedVersion)
  • Repository of the Academy's Library (Library of the Hungarian Academy of Sciences) (acceptedVersion)
  • DOAJ (DOAJ: Directory of Open Access Journals) (submittedVersion, cc-by-sa)
  • Semmelweis University Repository (Semmelweis University) (submittedVersion)
Funders
  • Egészségügyi Tudományos Tanács
  • Gedeon Richter
  • National Institutes of Health
  • Directorate for Biological Sciences
  • University of California, Davis (95616, CA 95616)
  • Medical Research Council
  • National Cancer Institute (P01CA095616)
  • National Institute of Neurological Disorders and Stroke (U24NS050606)
Topics
  • Life Sciences › Biochemistry, Genetics and Molecular Biology › Physiology › Adenosine and Purinergic Signaling
  • Health Sciences › Medicine › Pharmacology (medical) › Treatment of Major Depression
  • Life Sciences › Neuroscience › Cellular and Molecular Neuroscience › Neuroscience and Neuropharmacology Research
Keywords
P2X7 receptor, gene deletion, hippocampus, brain-derived neurotrophic factor, glutamate release, NR2B subunit, anhedonia, endotoxin, serotonin, neurogenesis, dentate gyrus, NMDA receptor, non-NMDA receptors
MeSH terms
Adenosine Triphosphate, Animals, Lipopolysaccharides, Serotonin, Gene Deletion, Mice, Knockout, Glutamic Acid, Dentate Gyrus, Brain-Derived Neurotrophic Factor, Mice, Neurogenesis, Receptors, Purinergic P2X7, Anhedonia

About these checks

Registry, retraction, Cites and statistics results are computed, not judged, with one exception: a printed reference that no index lists is read once by a model before it counts as a citation error. Claims are extracted by a model and kept only when their quote appears verbatim in the text; each cited source is then checked, with a model’s help, for whether it says what the claim relies on. Those verdicts can be wrong — read the claim’s quote and the cited source before relying on one.

Statistics and arithmetic are recomputed, not judged.

Confidence bands are shown only for fields calibrated on our annotated test set. None is calibrated yet, so no band is shown.

What counts as a claim ›How we measure confidence ›How we check this ›

Are you an author, or do you see a problem with this page? Request a review