

The DOI matches its Crossref record; 3 of the 3 references it cites were found in a registry or an index.
TBCK Influences Cell Proliferation, Cell Size and mTOR Signaling Pathway
Overview
The claims and statistics of this paper haven’t been checked yet.
Run the check — free, no account needed. It reads the open-access text and checks the sources it cites.
Integrity signals
Registry
Cites
Statistics
Figures
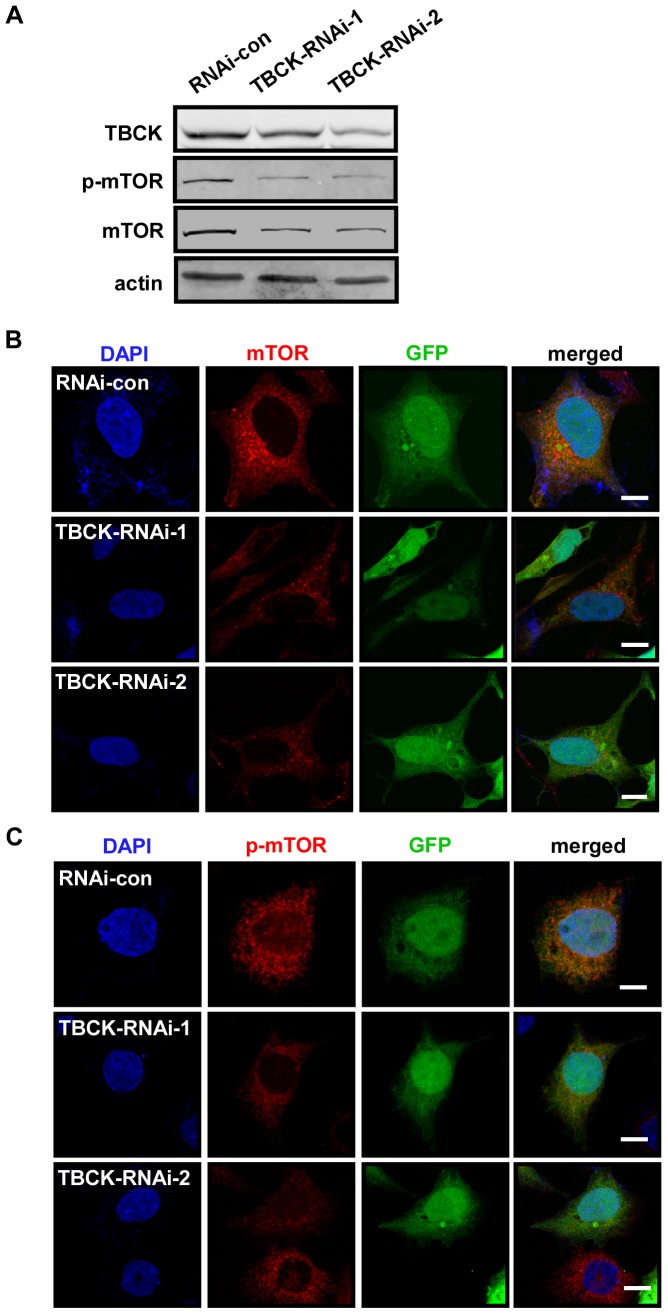
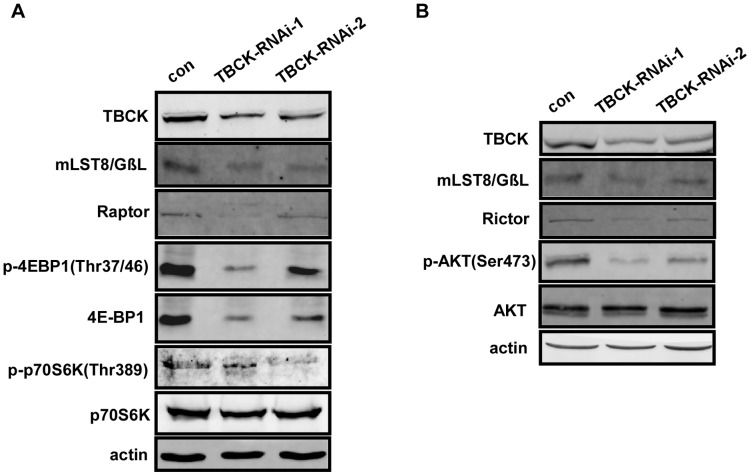
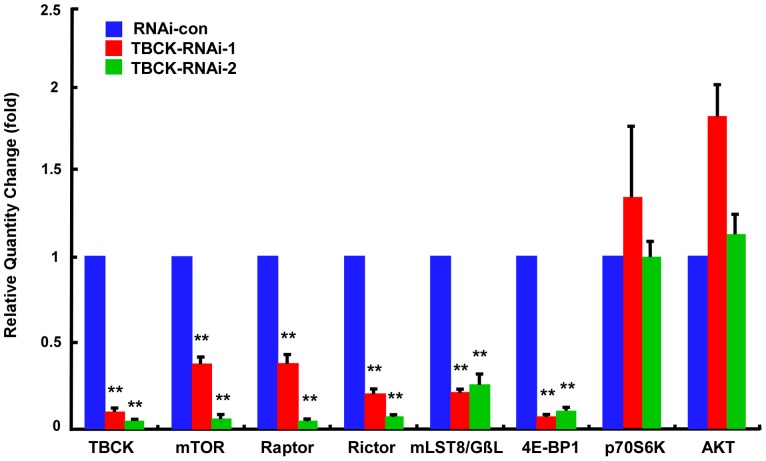
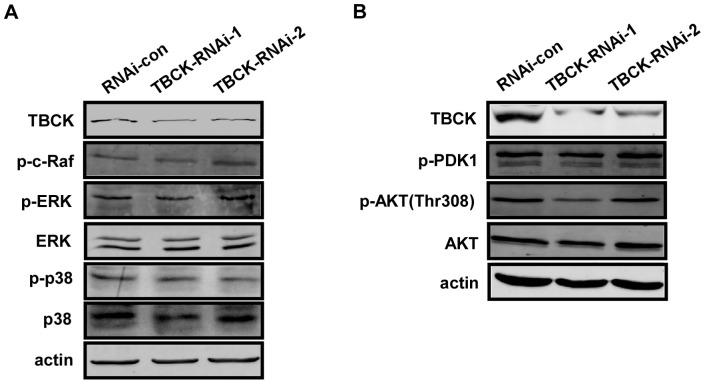
Verification
Claims the paper makes
The claims and statistics of this paper haven’t been checked yet.
Run the check — free, no account needed. It reads the open-access text and checks the sources it cites.
Claims other papers make about this one
Each is checked against this paper’s own text: does it say what the citing paper says it does?
The check wasn’t confident either way, so it gives no verdict — never disputed.
In the citing paper
“MTORC1-mediated autophagy is negatively regulated by SHOC2, a scaffold protein that activates the RAS-RAF-MAPK signaling pathway [682, 683].”
From Guidelines for the use and interpretation of assays for monitoring autophagy (4th edition) 1 (2021) · cites this paper as [683]
Experimental — accuracy not yet measured
Self-check
Percentages, sums and reported differences re-computed from the paper’s own numbers.
The self-check needs the paper’s full text.
Citations
Cites
Rab GTPases as coordinators of vesicle traffic
Stenmark, H. (2009) · Nature Reviews Molecular Cell Biology · doi:10.1038/nrm2728 · Cited by 3,413
The TSC1–TSC2 complex: a molecular switchboard controlling cell growth
Huang, J., & Manning, B. D. (2008) · Biochemical Journal · doi:10.1042/bj20080281 · Cited by 1,237 · cited 1×
“TSC1 and TSC2 are the tumor-suppressor genes mutated in the tumor syndrome TSC (tuberous sclerosis complex) and their gene products form a complex (TSC1–TSC2) that integrates signals upstream of mTOR signaling pathway through its GAP activity towards the small Gprotein Rheb [42].”
PRAS40 is an insulin-regulated inhibitor of the mTORC1 protein kinase
Sancak, Y., Thoreen, C. C., Peterson, T. R., Lindquist, R. A., Kang, S. A., Spooner, E., Carr, S. A., & Sabatini, D. M. (2007) · Molecular Cell · doi:10.1016/j.molcel.2007.03.003 · Cited by 1,236
Research works printed but not linked: 49
- T Schmelzle, 2000, TOR, a central controller of cell growth, Cell, 103, 253, 10.1016/S0092-8674(00)00117-3 · DOI
- S Wullschleger, 2006, TOR signaling in growth and metabolism, Cell, 124, 471, 10.1016/j.cell.2006.01.016 · DOI · Paper page
- N Hay, 2004, Upstream and downstream of mTOR, Genes Dev, 18, 1926, 10.1101/gad.1212704 · DOI · Paper page
- R Loewith, 2011, Target of rapamycin (TOR) in nutrient signaling and growth control, Genetics, 189, 1177, 10.1534/genetics.111.133363 · DOI
- J Kim, 2011, Amino acid signaling in TOR activation, Annu Rev Biochem, 80, 1001, 10.1146/annurev-biochem-062209-094414 · DOI
- M Laplante, 2012, mTOR signaling in growth control and disease, Cell, 149, 274, 10.1016/j.cell.2012.03.017 · DOI · Paper page
- DH Kim, 2003, GbetaL, a positive regulator of the rapamycin-sensitive pathway required for the nutrient-sensitive interaction between raptor and mTOR, Mol Cell, 11, 895, 10.1016/S1097-2765(03)00114-X · DOI
- TR Peterson, 2009, DEPTOR is an mTOR inhibitor frequently overexpressed in multiple myeloma cells and required for their survival, Cell, 137, 873, 10.1016/j.cell.2009.03.046 · DOI · Paper page
- T Kaizuka, 2010, Tti1 and Tel2 are critical factors in mammalian target of rapamycin complex assembly, J Biol Chem, 285, 20109, 10.1074/jbc.M110.121699 · DOI
- K Hara, 2002, Raptor, a binding partner of target of rapamycin (TOR), mediates TOR action, Cell, 110, 177, 10.1016/S0092-8674(02)00833-4 · DOI
- DH Kim, 2002, mTOR interacts with raptor to form a nutrient-sensitive complex that signals to the cell growth machinery, Cell, 110, 163, 10.1016/S0092-8674(02)00808-5 · DOI
- L Wang, 2007, PRAS40 regulates mTORC1 kinase activity by functioning as a direct inhibitor of substrate binding, J Biol Chem, 282, 20036, 10.1074/jbc.M702376200 · DOI
- K Thedieck, 2007, PRAS40 and PRR5-like protein are new mTOR interactors that regulate apoptosis, PLoS One, 2, e1217, 10.1371/journal.pone.0001217 · DOI
- E Vander Haar, 2007, Insulin signalling to mTOR mediated by the Akt/PKB substrate PRAS40, Nat Cell Biol, 9, 316, 10.1038/ncb1547 · DOI
- E Jacinto, 2004, Mammalian TOR complex 2 controls the actin cytoskeleton and is rapamycin insensitive, Nat Cell Biol, 6, 1122, 10.1038/ncb1183 · DOI
- DD Sarbassov, 2004, Rictor, a novel binding partner of mTOR, defines a rapamycin-insensitive and raptor-independent pathway that regulates the cytoskeleton, Curr Biol, 14, 1296, 10.1016/j.cub.2004.06.054 · DOI · Paper page
- MA Frias, 2006, mSin1 is necessary for Akt/PKB phosphorylation, and its isoforms define three distinct mTORC2s, Curr Biol, 16, 1865, 10.1016/j.cub.2006.08.001 · DOI
- E Jacinto, 2006, SIN1/MIP1 maintains rictor-mTOR complex integrity and regulates Akt phosphorylation and substrate specificity, Cell, 127, 125, 10.1016/j.cell.2006.08.033 · DOI
- LR Pearce, 2007, Identification of Protor as a novel Rictor-binding component of mTOR complex-2, Biochem J, 405, 513, 10.1042/BJ20070540 · DOI
- LR Pearce, 2011, Protor-1 is required for efficient mTORC2-mediated activation of SGK1 in the kidney, Biochem J, 436, 169, 10.1042/BJ20102103 · DOI
- C Oneyama, 2011, MicroRNA-mediated downregulation of mTOR/FGFR3 controls tumor growth induced by Src-related oncogenic pathways, Oncogene, 30, 3489, 10.1038/onc.2011.63 · DOI
- D Li, 2011, MicroRNA-99a inhibits hepatocellular carcinoma growth and correlates with prognosis of patients with hepatocellular carcinoma, J Biol Chem, 286, 36677, 10.1074/jbc.M111.270561 · DOI
- Y Fang, 2012, MicroRNA-7 inhibits tumor growth and metastasis by targeting the phosphoinositide 3-kinase/Akt pathway in hepatocellular carcinoma, Hepatology, 55, 1852, 10.1002/hep.25576 · DOI
- J Hou, 2011, Identification of miRNomes in human liver and hepatocellular carcinoma reveals miR-199a/b-3p as therapeutic target for hepatocellular carcinoma, Cancer Cell, 19, 232, 10.1016/j.ccr.2011.01.001 · DOI
- G Liu, 2012, Exercise modulates microRNAs that affect the PTEN/mTOR pathway in rats after spinal cord injury, Exp Neurol, 233, 447, 10.1016/j.expneurol.2011.11.018 · DOI
- F Fornari, 2010, MiR-199a-3p regulates mTOR and c-Met to influence the doxorubicin sensitivity of human hepatocarcinoma cells, Cancer Res, 70, 5184, 10.1158/0008-5472.CAN-10-0145 · DOI
- KR Leite, 2011, MicroRNA-100 expression is independently related to biochemical recurrence of prostate cancer, J Urol, 185, 1118, 10.1016/j.juro.2010.10.035 · DOI
- T Iwaya, 2012, Downregulation of miR-144 is associated with colorectal cancer progression via activation of mTOR signaling pathway, Carcinogenesis, 33, 2391, 10.1093/carcin/bgs288 · DOI
- J Faridi, 2003, Akt promotes increased mammalian cell size by stimulating protein synthesis and inhibiting protein degradation, Am J Physiol Endocrinol Metab, 285, E964, 10.1152/ajpendo.00239.2003 · DOI
- G Manning, 2002, The protein kinase complement of the human genome, Science, 298, 1912, 10.1126/science.1075762 · DOI · Paper page
- C Greenman, 2007, Patterns of somatic mutation in human cancer genomes, Nature, 446, 153, 10.1038/nature05610 · DOI
- SK Hanks, 1995, Protein kinases 6. The eukaryotic protein kinase superfamily: kinase (catalytic) domain structure and classification, FASEB J, 9, 576, 10.1096/fasebj.9.8.7768349 · DOI
- J Boudeau, 2006, Emerging roles of pseudokinases, Trends Cell Biol, 16, 443, 10.1016/j.tcb.2006.07.003 · DOI
- ED Scheeff, 2009, Structure of the pseudokinase VRK3 reveals a degraded catalytic site, a highly conserved kinase fold, and a putative regulatory binding site, Structure, 17, 128, 10.1016/j.str.2008.10.018 · DOI
- AH Hutagalung, 2011, Role of Rab GTPases in membrane traffic and cell physiology, Physiol Rev, 91, 119, 10.1152/physrev.00059.2009 · DOI · Paper page
- MA Frasa, 2012, Illuminating the functional and structural repertoire of human TBC/RABGAPs, Nat Rev Mol Cell Biol, 13, 67, 10.1038/nrm3364 · DOI
- F Barr, 2010, Rab GEFs and GAPs, Curr Opin Cell Biol, 22, 461, 10.1016/j.ceb.2010.04.007 · DOI
- X Pan, 2006, TBC-domain GAPs for Rab GTPases accelerate GTP hydrolysis by a dual-finger mechanism, Nature, 442, 303, 10.1038/nature04847 · DOI
- T Itoh, 2006, Screening for target Rabs of TBC (Tre-2/Bub2/Cdc16) domain-containing proteins based on their Rab-binding activity, Genes Cells, 11, 1023, 10.1111/j.1365-2443.2006.00997.x · DOI
- CC Dibble, 2012, TBC1D7 is a third subunit of the TSC1-TSC2 complex upstream of mTORC1, Mol Cell, 47, 535, 10.1016/j.molcel.2012.06.009 · DOI · Paper page
- N Sato, 2010, Activation of an oncogenic TBC1D7 (TBC1 domain family, member 7) protein in pulmonary carcinogenesis, Genes Chromosomes Cancer, 49, 353, 10.1002/gcc.20747 · DOI
- A Nakashima, 2007, Identification of TBC7 having TBC domain as a novel binding protein to TSC1–TSC2 complex, Biochem Biophys Res Commun, 361, 218, 10.1016/j.bbrc.2007.07.011 · DOI
- G Robertson, 2006, cisRED: a database system for genome-scale computational discovery of regulatory elements, Nucleic Acids Res, 34, D68, 10.1093/nar/gkj075 · DOI
- J Kong, 2012, Translational control in cellular and developmental processes, Nat Rev Genet, 13, 383, 10.1038/nrg3184 · DOI
- G Grillo, 2010, UTRdb and UTRsite (RELEASE 2010): a collection of sequences and regulatory motifs of the untranslated regions of eukaryotic mRNAs, Nucleic Acids Res, 38, D75, 10.1093/nar/gkp902 · DOI
- S Sakakibara, 1996, Mouse-Musashi-1, a neural RNA-binding protein highly enriched in the mammalian CNS stem cell, Dev Biol, 176, 230, 10.1006/dbio.1996.0130 · DOI
- H Okano, 2002, Musashi: a translational regulator of cell fate, J Cell Sci, 115, 1355, 10.1242/jcs.115.7.1355 · DOI
- D Bordo, 2002, The rhodanese/Cdc25 phosphatase superfamily. Sequence-structure-function relations, EMBO Rep, 3, 741, 10.1093/embo-reports/kvf150 · DOI
- K Hofmann, 1998, A model of Cdc25 phosphatase catalytic domain and Cdk-interaction surface based on the presence of a rhodanese homology domain, J Mol Biol, 282, 195, 10.1006/jmbi.1998.1998 · DOI
Cited by
Sorted by citations
Guidelines for the use and interpretation of assays for monitoring autophagy (4th edition) 1
Klionsky, D. J., Abdel-Aziz, A. K., Abdelfatah, S., Abdellatif, M., Abdoli, A., Abel, S., Abeliovich, H., Abildgaard, M. H., Abudu, Y. P., Acevedo-Arozena, A., et al. (2021) · Autophagy · doi:10.1080/15548627.2020.1797280 · Cited by 2,897
Self-citation
Metadata
- Authors
- Liu, Y., Yan, X., & Zhou, T.
- Venue
- PLoS ONE
- Publisher
- Public Library of Science (PLoS)
- Published
- 2013-08-19
- Volume
- 8
- Issue
- 8
- Pages
- e71349
- ISSN
- 1932-6203
- PMC
- PMC3747267
- Cited by
- 51
- References
- 3
- Language
- en
About these checks
Registry, retraction, Cites and statistics results are computed, not judged, with one exception: a printed reference that no index lists is read once by a model before it counts as a citation error. Claims are extracted by a model and kept only when their quote appears verbatim in the text; each cited source is then checked, with a model’s help, for whether it says what the claim relies on. Those verdicts can be wrong — read the claim’s quote and the cited source before relying on one.
Statistics and arithmetic are recomputed, not judged.
Confidence bands are shown only for fields calibrated on our annotated test set. None is calibrated yet, so no band is shown.
What counts as a claim ›How we measure confidence ›How we check this ›
Are you an author, or do you see a problem with this page? Request a review
