

Extreme Learning Machine-Based Classification of ADHD Using Brain Structural MRI Data
Open accessThe DOI matches its Crossref record; 56 of the 56 references it cites were found in a registry or an index.
Abstract
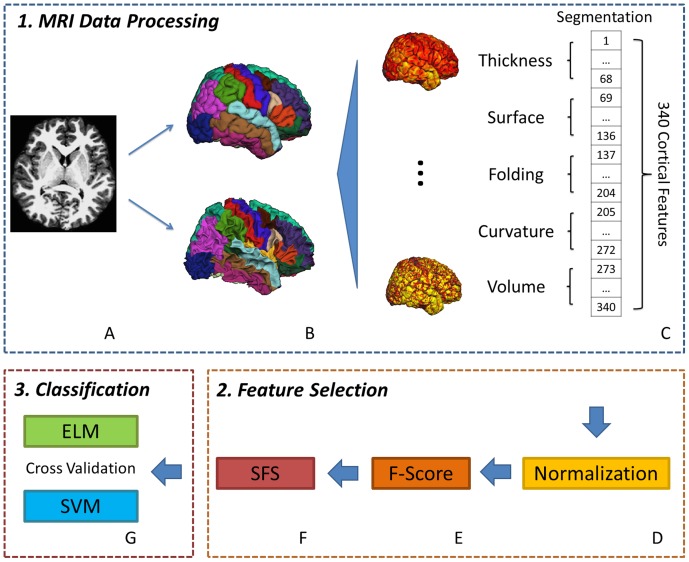
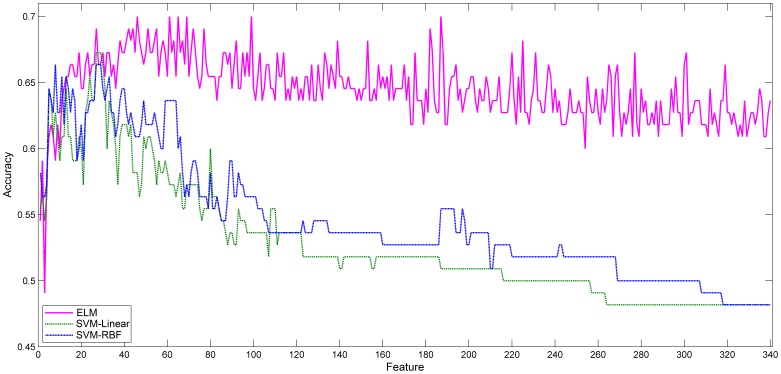
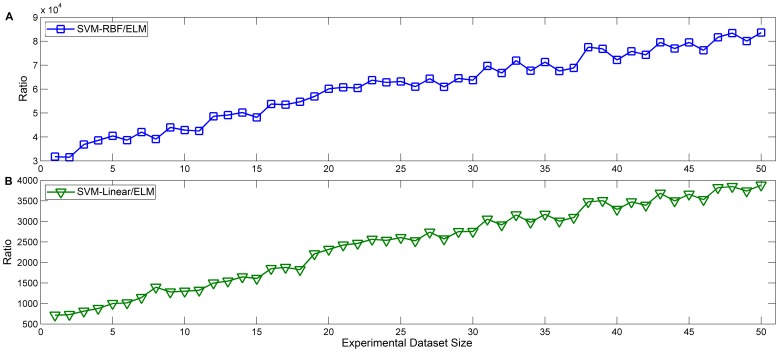
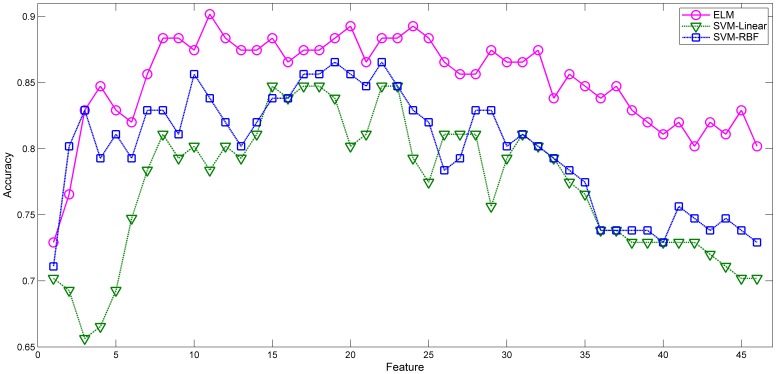
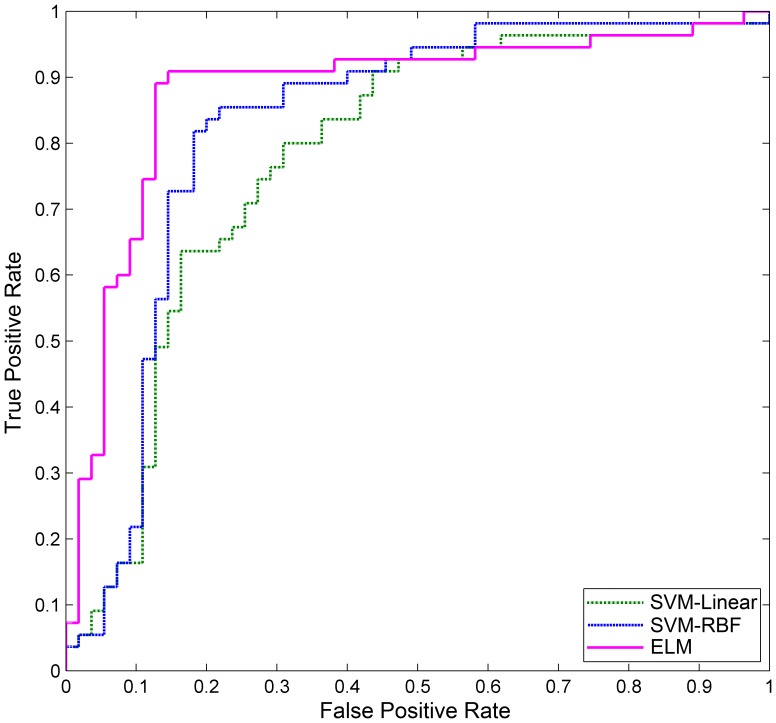
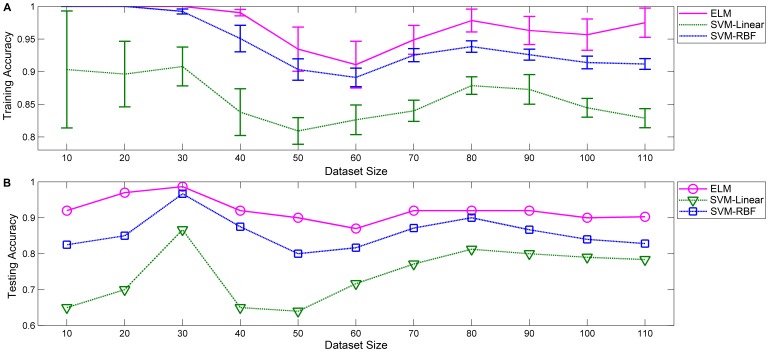
BACKGROUND: Effective and accurate diagnosis of attention-deficit/hyperactivity disorder (ADHD) is currently of significant interest. ADHD has been associated with multiple cortical features from structural MRI data. However, most existing learning algorithms for ADHD identification contain obvious defects, such as time-consuming training, parameters selection, etc. The aims of this study were as follows: (1) Propose an ADHD classification model using the extreme learning machine (ELM) algorithm for automatic, efficient and objective clinical ADHD diagnosis. (2) Assess the computational efficiency and the effect of sample size on both ELM and support vector machine (SVM) methods and analyze which brain segments are involved in ADHD. METHODS: High-resolution three-dimensional MR images were acquired from 55 ADHD subjects and 55 healthy controls. Multiple brain measures (cortical thickness, etc.) were calculated using a fully automated procedure in the FreeSurfer software package. In total, 340 cortical features were automatically extracted from 68 brain segments with 5 basic cortical features. F-score and SFS methods were adopted to select the optimal features for ADHD classification. Both ELM and SVM were evaluated for classification accuracy using leave-one-out cross-validation. RESULTS: We achieved ADHD prediction accuracies of 90.18% for ELM using eleven combined features, 84.73% for SVM-Linear and 86.55% for SVM-RBF. Our results show that ELM has better computational efficiency and is more robust as sample size changes than is SVM for ADHD classification. The most pronounced differences between ADHD and healthy subjects were observed in the frontal lobe, temporal lobe, occipital lobe and insular. CONCLUSION: Our ELM-based algorithm for ADHD diagnosis performs considerably better than the traditional SVM algorithm. This result suggests that ELM may be used for the clinical diagnosis of ADHD and the investigation of different brain diseases.
Overview
The claims and statistics of this paper haven’t been checked yet.
Free: it reads the open-access text and checks the first 5 claims that cite a source we can check. Create a free account to check every claim.
Integrity signals
Registry
Cites
Statistics
Figures
Verification
Claims the paper makes
The claims and statistics of this paper haven’t been checked yet.
Free: it reads the open-access text and checks the first 5 claims that cite a source we can check. Create a free account to check every claim.
Claims other papers make about this one
Each is checked against this paper’s own text: does it say what the citing paper says it does?
In the citing paper
“Discriminative brain regions included inferior frontal, temporal, occipital and insular cortices.”
From Progress and roadblocks in the search for brain-based biomarkers of autism and attention-deficit/hyperactivity disorder (2017) · cites this paper as [55]
In the citing paper
“Similarly, Peng et al.55 reported high classification accuracy (90.18%) using an extreme learning machine (ELM) algorithm with multiple cortical features.”
From Progress and roadblocks in the search for brain-based biomarkers of autism and attention-deficit/hyperactivity disorder (2017) · cites this paper as [55]
Self-check
Percentages, sums and reported differences re-computed from the paper’s own numbers.
The self-check needs the paper’s full text.
Citations
Cites
Cortes, C., & Vapnik, V. (1995) · Machine Learning · doi:10.1007/bf00994018 · Cited by 59,421
Cortes, C., & Vapnik, V. (1995) · Machine-mediated learning · doi:10.1023/a:1022627411411 · Cited by 48,445 · cited 1×
“According to Theorem 1 and Theorem 2 shown in the Appendix S1, the input weight w i and the hidden layer biases b i of SLFNs for ELM can be randomly assigned if the activation functions in the hidden layer are infinitely differentiable [37,38].”
MethodA default mode of brain function
Raichle, M. E., MacLeod, A. M., Snyder, A. Z., Powers, W. J., Gusnard, D. A., & Shulman, G. L. (2001) · Proceedings of the National Academy of Sciences · doi:10.1073/pnas.98.2.676 · Cited by 12,190
Feature selection: evaluation, application, and small sample performance
Jain, A., & Zongker, D. (1997) · IEEE Transactions on Pattern Analysis and Machine Intelligence · doi:10.1109/34.574797 · Cited by 2,171 · cited 1×
“Sequential forward selection (SFS) is a simple efficient feature selection approach [34].”
The Prevalence of DSM-IV Attention-Deficit/Hyperactivity Disorder: A Meta-Analytic Review
Willcutt, E. G. (2012) · Neurotherapeutics · doi:10.1007/s13311-012-0135-8 · Cited by 2,160 · cited 1×
“For instance, approximately 20% of children are misdiagnosed because they are younger than their classmates [2,3].”
BackgroundSmall sample size effects in statistical pattern recognition: Recommendations for practitioners
Raudys, S. J., & Jain, A. K. (1991) · IEEE Transactions on Pattern Analysis and Machine Intelligence · doi:10.1109/34.75512 · Cited by 1,384 · cited 2×
“One of the common practices in these previous studies is the utilization of hundreds of training samples to achieve better classification accuracy [44– 47].”
MethodSmall-World Anatomical Networks in the Human Brain Revealed by Cortical Thickness from MRI
He, Y., Chen, Z. J., & Evans, A. C. (2007) · Cerebral Cortex · doi:10.1093/cercor/bhl149 · Cited by 1,353 · cited 1×
“Anatomical MRI showed that the maturation of cortical thickness and the surface area developmental trajectory of the right prefrontal cortex is delayed in ADHD children relative to typically developing children [7].”
BackgroundMultimodal classification of Alzheimer's disease and mild cognitive impairment
Zhang, D., Wang, Y., Zhou, L., Yuan, H., & Shen, D. (2011) · NeuroImage · doi:10.1016/j.neuroimage.2011.01.008 · Cited by 1,314 · cited 1×
“One of the common practices in these previous studies is the utilization of hundreds of training samples to achieve better classification accuracy [44– 47].”
MethodMultiplexed echo planar imaging for sub-second whole brain FMRI and fast diffusion imaging
Feinberg, D. A., Moeller, S., Smith, S. M., Auerbach, E., Ramanna, S., Glasser, M. F., Miller, K. L., Ugurbil, K., & Yacoub, E. (2010) · PLoS ONE · doi:10.1371/journal.pone.0015710 · Cited by 1,296 · cited 1×
“Several studies using structural MRI have demonstrated anatomical differences be-tween ADHD and normal children [23–25].”
BackgroundZeng, L.-L., Shen, H., Liu, L., Wang, L., Li, B., Fang, P., Zhou, Z., Li, Y., & Hu, D. (2012) · Brain · doi:10.1093/brain/aws059 · Cited by 748 · cited 1×
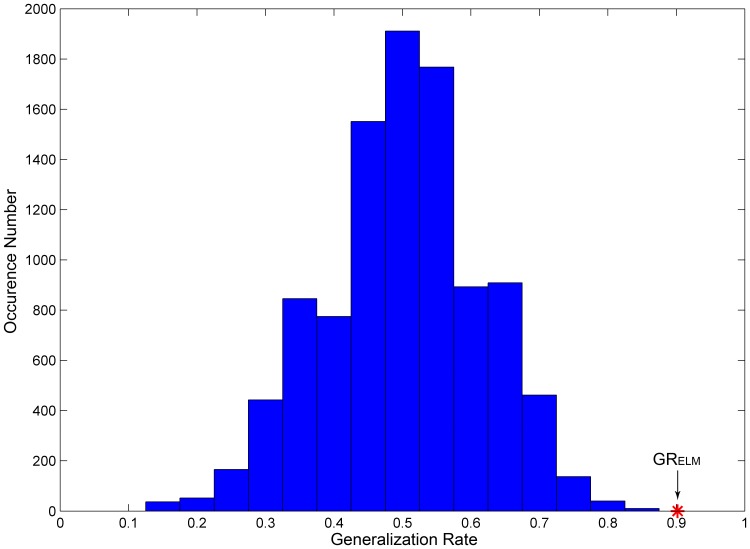
“The permutation tests have been adapted to assess statistical significance of the classifier and its performance in many research fields [39,40].”
Cited by
Attention-deficit/hyperactivity disorder
Faraone, S. V., Asherson, P., Banaschewski, T., Biederman, J., Buitelaar, J. K., Ramos-Quiroga, J. A., Rohde, L. A., Sonuga-Barke, E. J. S., Tannock, R., & Franke, B. (2015) · Nature Reviews Disease Primers · doi:10.1038/nrdp.2015.20 · Cited by 1,479
Computational psychiatry as a bridge from neuroscience to clinical applications
Huys, Q. J. M., Maia, T. V., & Frank, M. J. (2016) · Nature Neuroscience · doi:10.1038/nn.4238 · Cited by 1,002
“There is nevertheless scope for further improvement through the integration of more modalities 36 , or from algorithmic advances, for example, with deep belief networks 37 or other methods 38 that outperform more standard approaches on a variety of ML benchmarks 35,39,40 .”
BackgroundSingle subject prediction of brain disorders in neuroimaging: Promises and pitfalls
Arbabshirani, M. R., Plis, S., Sui, J., & Calhoun, V. D. (2017) · NeuroImage · doi:10.1016/j.neuroimage.2016.02.079 · Cited by 912
“…= 10, Total = 30 60.0–87%% Semrud-Clikeman et al. (1996) t6:16 sMRI ADHD Cortical thickness measures 340 ELM HC = 55, ADHD = 55, Total = 110 90.2% Peng et al. (2013) t6:17 sMRI ADHD Voxel-wise GM volumetric measures N/A Gaussian process classifier HC = 19, ASD = 19, ADHD = 20, Total = 58…”
BackgroundInfluentialA review on extreme learning machine
Wang, J., Lu, S., Wang, S.-H., & Zhang, Y.-D. (2022) · Multimedia Tools and Applications · doi:10.1007/s11042-021-11007-7 · Cited by 572
“Peng and Lin [136] proposed an attention-deficit/hyperactivity disorder detection method based on ELM and structural MRI.”
MethodSelf-citationASD-DiagNet: A Hybrid Learning Approach for Detection of Autism Spectrum Disorder Using fMRI Data
Eslami, T., Mirjalili, V., Fong, A., Laird, A. R., & Saeed, F. (2019) · Frontiers in Neuroinformatics · doi:10.3389/fninf.2019.00070 · Cited by 379
Metadata
- Authors
- Peng, X., Lin, P., Zhang, T., & Wang, J.
- Affiliations
- Xi'an Jiaotong University (CN)
- University of New Mexico (US)
- Corresponding author
- Lin, Pan
- Wang, Jue
- Venue
- PLoS ONE
- Publisher
- Public Library of Science (PLoS)
- Published
- 2013-11-19
- Volume
- 8
- Issue
- 11
- Pages
- e79476
- ISSN
- 1932-6203 (ISSN-L)
- PMC
- PMC3834213
- OpenAlex
- W2075529349
- Cited by
- 194
- References
- 55
- Citations by year
- 2026: 3 · 2025: 11 · 2024: 16 · 2023: 17 · 2022: 22 · 2021: 22 · 2020: 27 · 2019: 17 · 2018: 16 · 2017: 16 · 2016: 12 · 2015: 11 · 2014: 3 · 2013: 1
- FWCI
- 6.38
- Type
- journal article
- Language
- en
- Open access
- gold
- doi.org
- Licence
- Locations
- PLoS ONE (publishedVersion, cc-by)
- Europe PMC (PubMed Central) (publishedVersion, cc-by)
- PubMed Central (publishedVersion, cc-by)
- PubMed (publishedVersion)
- RePEc: Research Papers in Economics (submittedVersion)
- DOAJ (DOAJ: Directory of Open Access Journals) (submittedVersion, cc-by-sa)
- Funders
- Ministry of Education of the People's Republic of China
- Peking University
- Fundamental Research Funds for the Central Universities (20120201120071)
- Topics
- Health Sciences › Medicine › Psychiatry and Mental health › Attention Deficit Hyperactivity Disorder
- Physical Sciences › Computer Science › Artificial Intelligence › Machine Learning and ELM
- Life Sciences › Neuroscience › Cognitive Neuroscience › Autism Spectrum Disorder Research
- Keywords
- attention deficit hyperactivity disorder, ADHD diagnosis, extreme learning machine, support vector machine, structural MRI, cortical thickness, brain segmentation, feature selection, frontal lobe, temporal lobe, occipital lobe, insula, computational efficiency
- MeSH terms
- Adolescent, Artificial Intelligence, Attention Deficit Disorder with Hyperactivity, Brain, Child, Female, Humans, Magnetic Resonance Imaging, Male, Software, Support Vector Machine
About these checks
Registry, retraction, Cites and statistics results are computed, not judged, with one exception: a printed reference that no index lists is read once by a model before it counts as a citation error. Claims are extracted by a model and kept only when their quote appears verbatim in the text; each cited source is then checked, with a model’s help, for whether it says what the claim relies on. Those verdicts can be wrong — read the claim’s quote and the cited source before relying on one.
Statistics and arithmetic are recomputed, not judged.
Confidence bands are shown only for fields calibrated on our annotated test set. None is calibrated yet, so no band is shown.
What counts as a claim ›How we measure confidence ›How we check this ›
Are you an author, or do you see a problem with this page? Request a review
How to cite
Cite CoChat for the checks on this page, and the paper for its own findings.
- This page
- CoChat. (2026). Citation check: Extreme Learning Machine-Based Classification of ADHD Using Brain Structural MRI Data. https://app.cochat.ai/papers/10.1371/journal.pone.0079476
- The paper
- Peng, X., Lin, P., Zhang, T., & Wang, J. (2013). Extreme Learning Machine-Based Classification of ADHD Using Brain Structural MRI Data. PLoS ONE. https://doi.org/10.1371/journal.pone.0079476
Data sources
Bibliographic data: Semantic Scholar, OpenAlex, Crossref.
Contains information from the Semantic Scholar Academic Graph Datasets, made available under the ODC Attribution License (ODC-BY 1.0).
Semantic Scholar’s data is described in: Kinney, R., et al. (2023). The Semantic Scholar Open Data Platform. arXiv:2301.10140.
