

The DOI matches its Crossref record; 44 of the 44 references it cites were found in a registry or an index.
Interleukin-6 Modulation of Intestinal Epithelial Tight Junction Permeability Is Mediated by JNK Pathway Activation of Claudin-2 Gene
Open accessAbstract
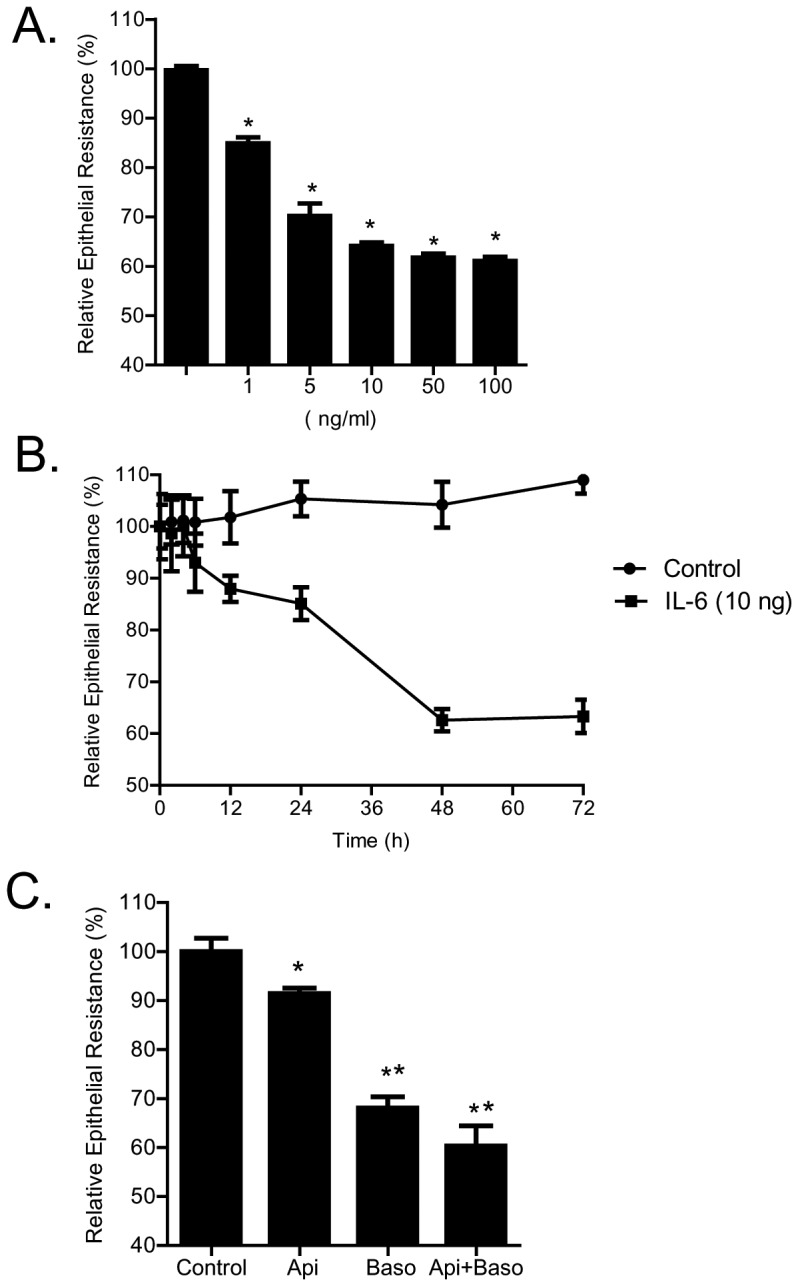
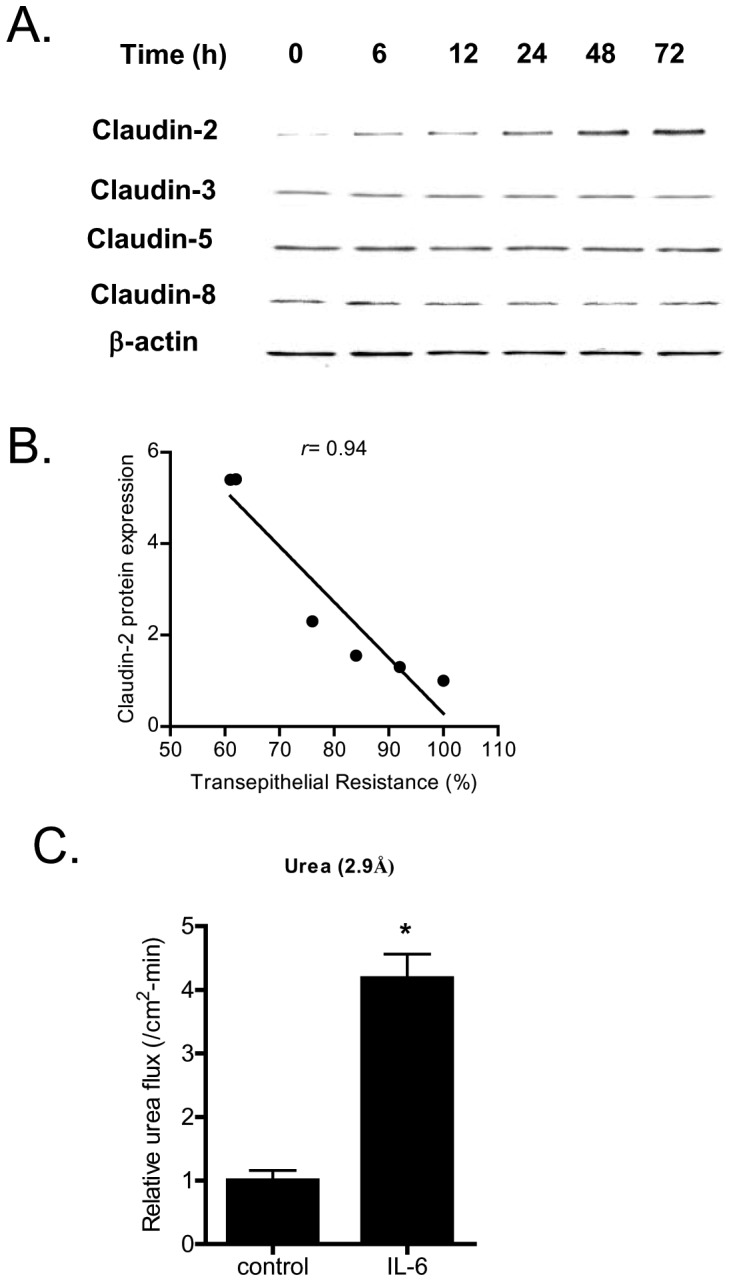
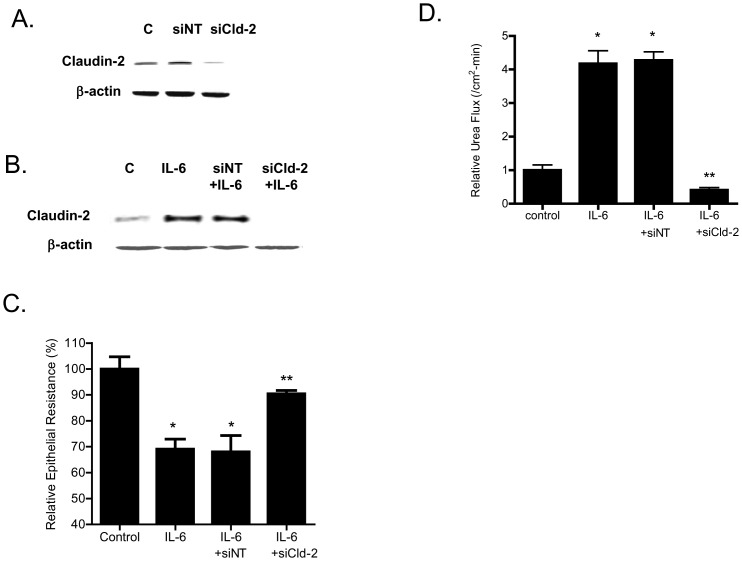
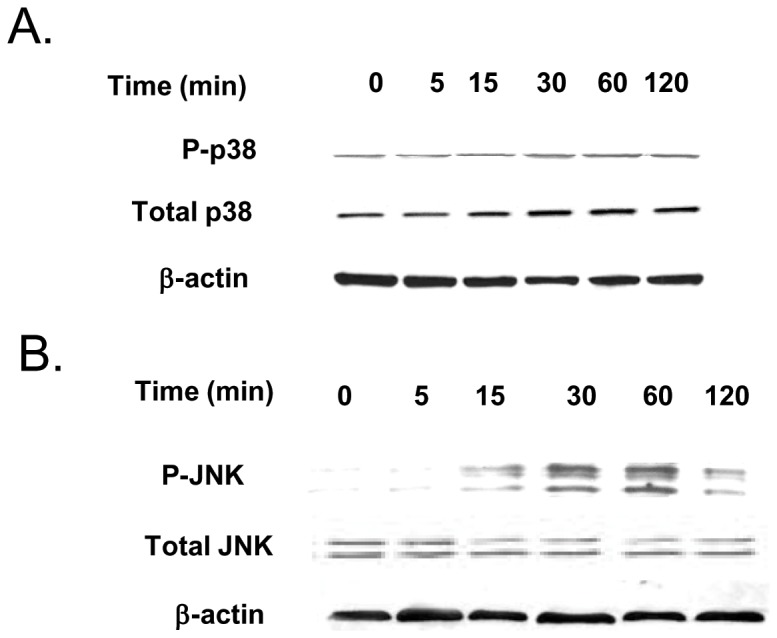
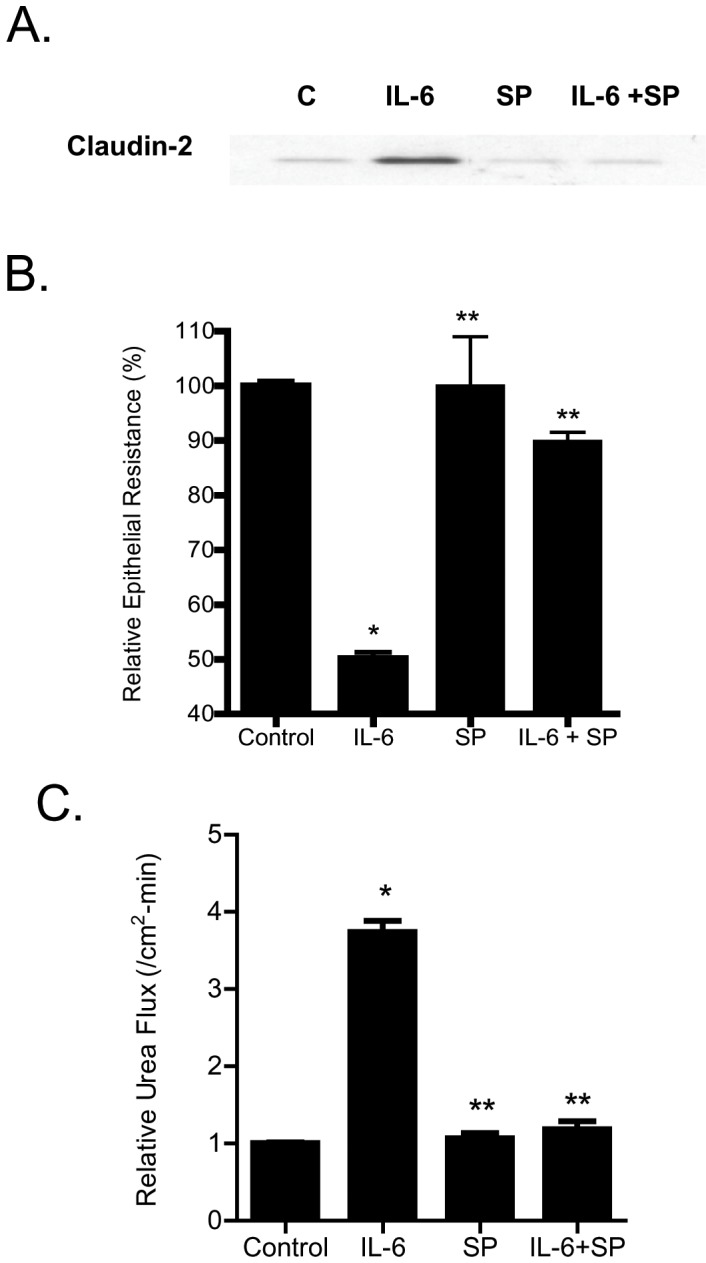
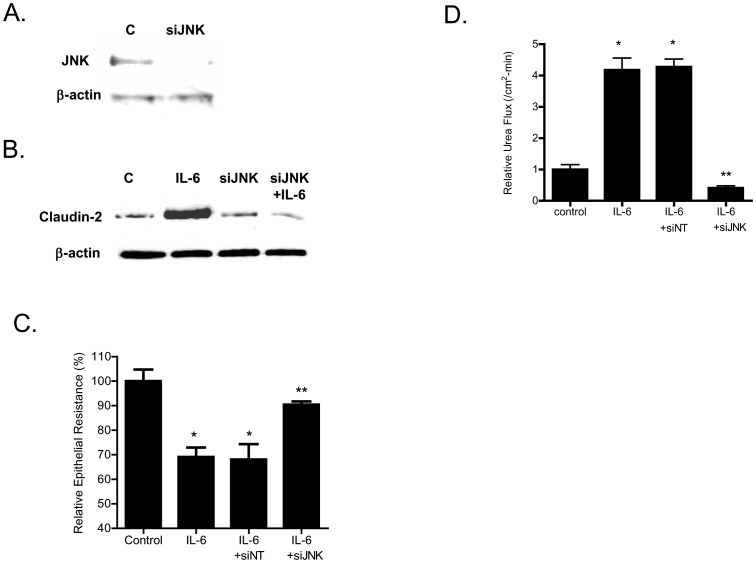
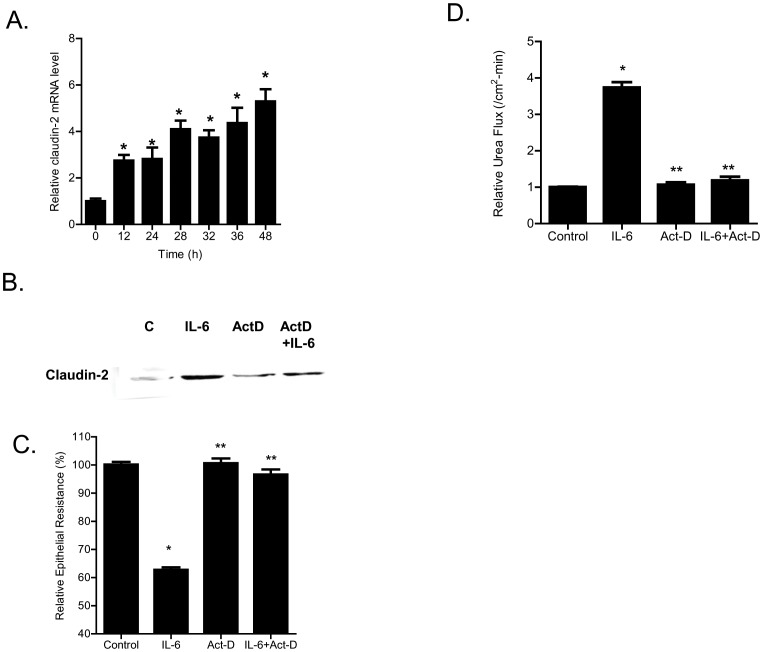
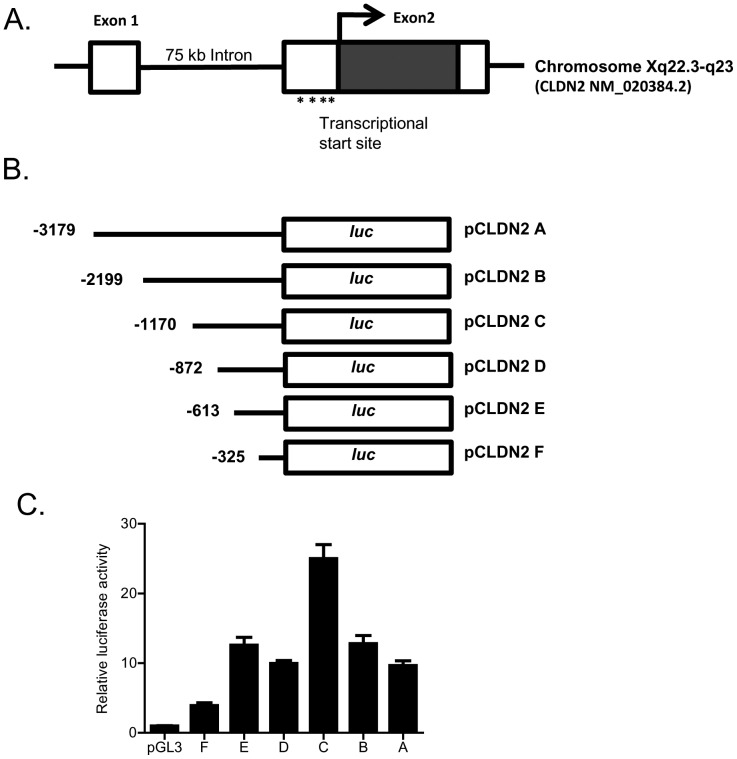
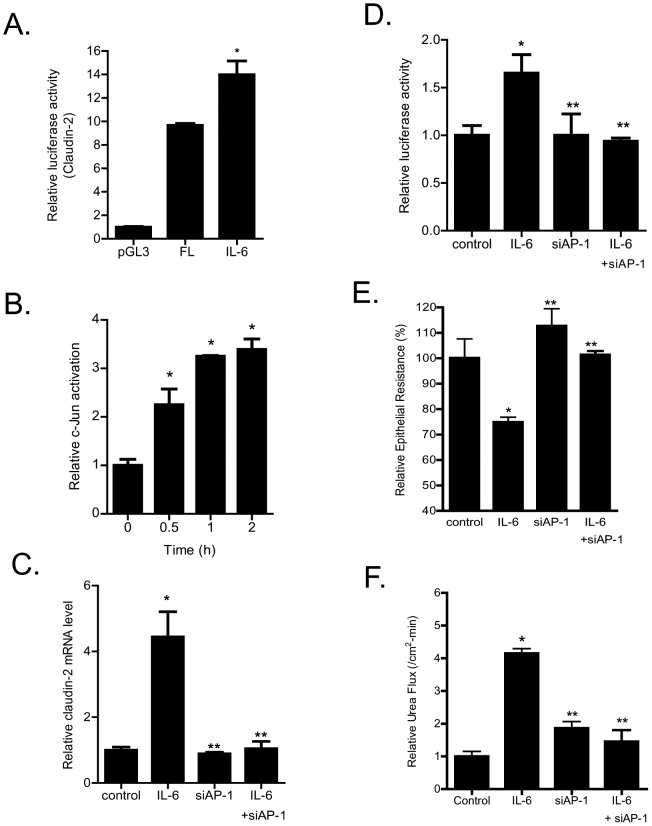
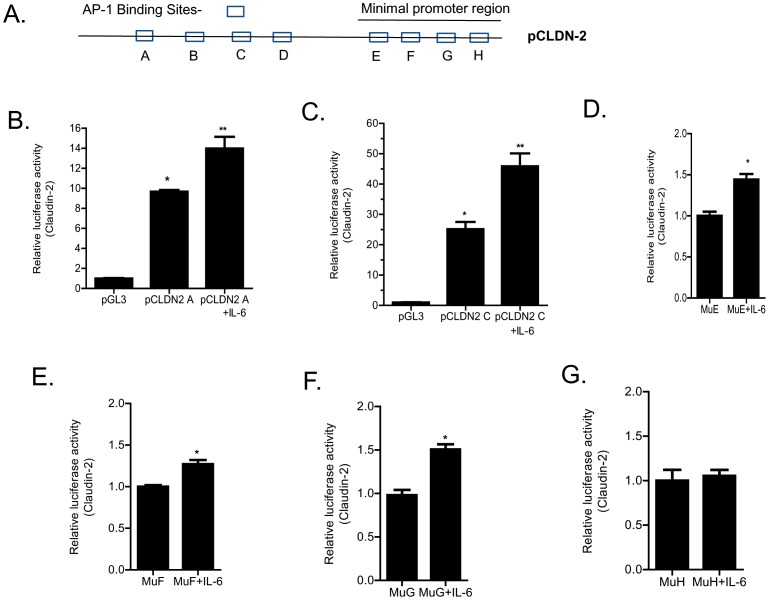
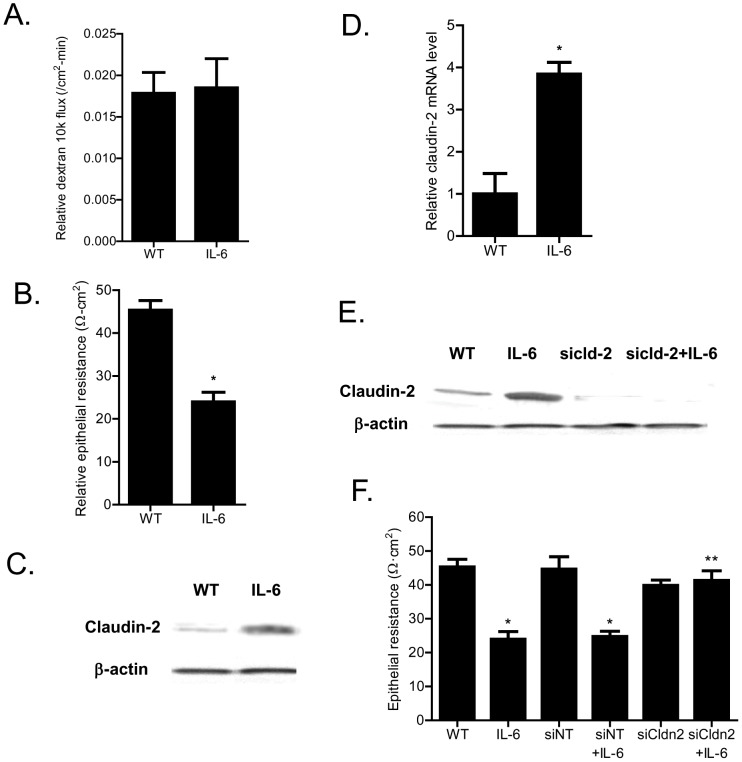
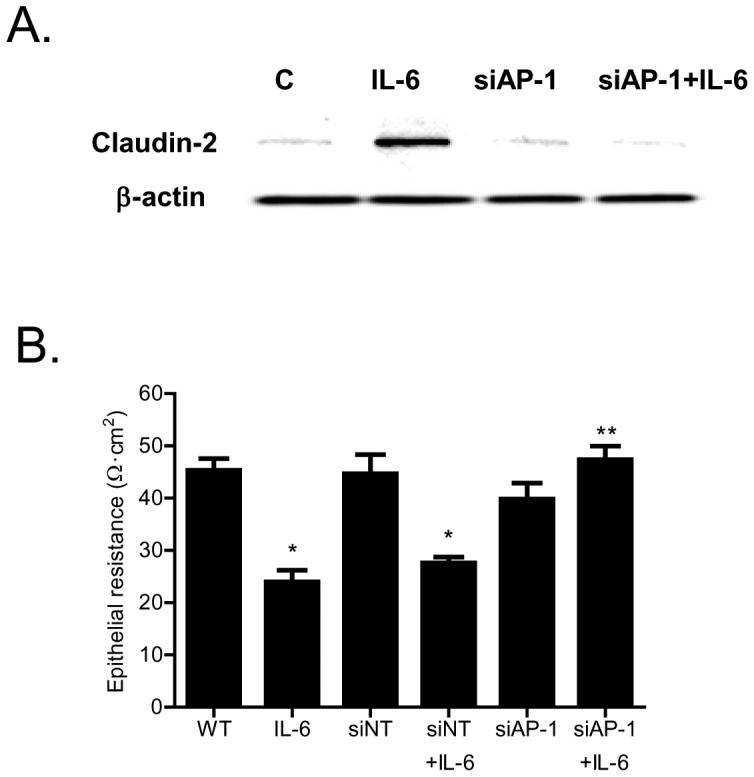
Defective intestinal epithelial tight junction (TJ) barrier has been shown to be a pathogenic factor in the development of intestinal inflammation. Interleukin-6 (IL-6) is a pleiotropic, pro-inflammatory cytokine which plays an important role in promoting inflammatory response in the gut and in the systemic circulation. Despite its key role in mediating variety inflammatory response, the effect of IL-6 on intestinal epithelial barrier remains unclear. The purpose of this study was to investigate the effect of IL-6 on intestinal epithelial TJ barrier and to delineate the intracellular mechanisms involved using in-vitro (filter-grown Caco-2 monolayers) and in-vivo model (mouse intestinal perfusion) systems. Our results indicated that IL-6 causes a site-selective increase in Caco-2 intestinal epithelia TJ permeability, causing an increase in flux of small-sized molecules having molecular radius <4 Å. The size-selective increase in Caco-2 TJ permeability was regulated by protein-specific increase in claudin-2 expression. The IL-6 increase in TJ permeability required activation of JNK signaling cascade. The JNK pathway activation of AP-1 resulted in AP-1 binding to its binding sequence on the claudin-2 promoter region, leading to promoter activation and subsequent increase in claudin-2 gene transcription and protein synthesis and TJ permeability. Our in-vivo mouse perfusion showed that IL-6 modulation of mouse intestinal permeability was also mediated by AP-1 dependent increase in claudin-2 expression. In conclusion, our studies show for the first time that the IL-6 modulation of intestinal TJ permeability was regulated by JNK activation of AP-1 and AP-1 activation of claudin-2 gene.
Overview
The claims and statistics of this paper haven’t been checked yet.
Run the check — free, no account needed. It reads the open-access text and checks the sources it cites.
Integrity signals
Registry
Cites
Statistics
Figures
Verification
Claims the paper makes
The claims and statistics of this paper haven’t been checked yet.
Run the check — free, no account needed. It reads the open-access text and checks the sources it cites.
Claims other papers make about this one
Each is checked against this paper’s own text: does it say what the citing paper says it does?
In the citing paper
“Increased serum concentrations of TNF, IL-1β, and IL-6 have also been shown to be potent inducers of intestinal permeability50–53.”
From Dietary metabolism, the gut microbiome, and heart failure (2019) · cites this paper as [50]
Self-check
Percentages, sums and reported differences re-computed from the paper’s own numbers.
The self-check needs the paper’s full text.
Citations
Cites
Intestinal mucosal barrier function in health and disease
Turner, J. R. (2009) · Nature reviews. Immunology · doi:10.1038/nri2653 · Cited by 3,952
Heller, F., Florian, P., Bojarski, C., Richter, J. F., Christ, M., Hillenbrand, B., Mankertz, J., Gitter, A. H., Bürgel, N., Fromm, M., et al. (2005) · Gastroenterology · doi:10.1016/j.gastro.2005.05.002 · Cited by 1,232
Heller, F., Florian, P., Bojarski, C., et al. (2005) · Gastroenterology · doi:10.1053/j.gastro.2005.05.002 · Cited by 1,016
Ma, T., Iwamoto, G. K., Hoa, N., Akotia, V., Pedram, A., Boivin, M., & Said, H. (2004) · American Journal of Physiology-Gastrointestinal and Liver Physiology · doi:10.1152/ajpgi.00173.2003 · Cited by 811
Self-citationCytokine Serum Level During Severe Sepsis in Human IL-6 as a Marker of Severity
DAMA, P., Ledoux, D., Nys, M., Vrindts, Y., Groote, D. D., Franchimont, P., & Lamy, M. (1992) · Annals of Surgery · doi:10.1097/00000658-199204000-00009 · Cited by 808
Mechanism of cytokine modulation of epithelial tight junction barrier
Al–Sadi, R. (2009) · Frontiers in bioscience · doi:10.2741/3413 · Cited by 649
Self-citationIL-1β Causes an Increase in Intestinal Epithelial Tight Junction Permeability
Al-Sadi, R. M., & Ma, T. Y. (2007) · The Journal of Immunology · doi:10.4049/jimmunol.178.7.4641 · Cited by 601
Self-citationTurner, J. R., Rill, B. K., Carlson, S. L., Carnes, D., Kerner, R., Mrsny, R. J., & Madara, J. (1997) · American Journal of Physiology-Cell Physiology · doi:10.1152/ajpcell.1997.273.4.c1378 · Cited by 553
Suzuki, T., Yoshinaga, N., & Tanabe, S. (2011) · Journal of Biological Chemistry · doi:10.1074/jbc.m111.238147 · Cited by 527
Choy, E. H. S., Isenberg, D. A., Garrood, T., Farrow, S., Ioannou, Y., Bird, H., Cheung, N., Williams, B., Hazleman, B., Price, R., et al. (2002) · Arthritis & Rheumatism · doi:10.1002/art.10623 · Cited by 526
Cited by
Sorted by citations
Dietary metabolism, the gut microbiome, and heart failure
Tang, W. H. W., Li, D. Y., & Hazen, S. L. (2019) · Nature Reviews Cardiology · doi:10.1038/s41569-018-0108-7 · Cited by 789
Fibroblasts as immune regulators in infection, inflammation and cancer
Davidson, S., Coles, M. C., Thomas, T. R., Kollias, G. A., Ludewig, B., Turley, S. J., Brenner, M. B., & Buckley, C. D. (2021) · Nature reviews. Immunology · doi:10.1038/s41577-021-00540-z · Cited by 639
Salvi, P. S., & Cowles, R. A. (2021) · Cells · doi:10.3390/cells10071775 · Cited by 574
Intestinal epithelial claudins: expression and regulation in homeostasis and inflammation
García‐Hernández, V., Quirós, M., & Nusrat, A. (2017) · Annals of the New York Academy of Sciences · doi:10.1111/nyas.13360 · Cited by 443
Inflammatory and Microbiota-Related Regulation of the Intestinal Epithelial Barrier
Barbara, G., Barbaro, M. R., Fuschi, D., Palombo, M., Falangone, F., Cremon, C., Marasco, G., & Stanghellini, V. (2021) · Frontiers in Nutrition · doi:10.3389/fnut.2021.718356 · Cited by 446
Intestinal epithelial barrier function and tight junction proteins with heat and exercise
Dokładny, K., Zuhl, M., & Moseley, P. L. (2015) · Journal of Applied Physiology · doi:10.1152/japplphysiol.00536.2015 · Cited by 328
Jang, Y. J., Kim, W.-K., Han, D. H., Lee, K., & Ko, G. (2019) · Gut Microbes · doi:10.1080/19490976.2019.1589281 · Cited by 301
Claudin-2 as a mediator of leaky gut barrier during intestinal inflammation
Luettig, J., Rosenthal, R., Barmeyer, C., & Jd, S. (2015) · Tissue Barriers · doi:10.4161/21688370.2014.977176 · Cited by 281
Golebski, K., Layhadi, J. A., Şahiner, Ü. M., Steveling, E. H., Lenormand, M. M., Li, R. C. Y., Bal, S. M., Heesters, B. A., Vilà-Nadal, G., Hunewald, O. E., et al. (2021) · Immunity · doi:10.1016/j.immuni.2020.12.013 · Cited by 250
Nighot, P. K., Hu, C.-A. A., & Ma, T. Y. (2015) · Journal of Biological Chemistry · doi:10.1074/jbc.m114.597492 · Cited by 251
Self-citationFan, L., Qi, Y., Qu, S., Chen, X., Li, A., Maher, H., Xu, C., Wang, L., Hou, T., Si, J., et al. (2021) · Gut Microbes · doi:10.1080/19490976.2020.1826746 · Cited by 244
Gut permeability and mucosal inflammation: bad, good or context dependent
Ahmad, R., Sorrell, M. F., Batra, S. K., Dhawan, P., & Singh, A. B. (2017) · Mucosal Immunology · doi:10.1038/mi.2016.128 · Cited by 243
Gut–liver axis, cirrhosis and portal hypertension: the chicken and the egg
Arab, J. P., Martín‐Mateos, R., & Shah, V. H. (2017) · Hepatology International · doi:10.1007/s12072-017-9798-x · Cited by 233
Intestinal Mucosal Mast Cells: Key Modulators of Barrier Function and Homeostasis
Albert-Bayo, M., Paracuellos, I., González-Castro, A. M., Rodríguez‐Urrutia, A., Rodríguez-Lagunas, M. J., Alonso, C., Santos, J., & Vicario, M. (2019) · Cells · doi:10.3390/cells8020135 · Cited by 220
Man, A., Bertelli, E., Rentini, S., Regoli, M., Briars, G., Marini, M., Watson, A., & Nicoletti, C. (2015) · Clinical science · doi:10.1042/cs20150046 · Cited by 189
Neutralization of IL-6 and TNF-α ameliorates intestinal permeability in DSS-induced colitis
Xiao, Y., Yan, W., Cao, Y. L., Yan, J., & Cai, W. (2016) · Cytokine · doi:10.1016/j.cyto.2016.04.012 · Cited by 191
The gut microbiota and its interactions with cardiovascular disease
Xu, H., Wang, X., Feng, W., Liu, Q., Zhou, S., Liu, Q., & Cai, L. (2020) · Microbial Biotechnology · doi:10.1111/1751-7915.13524 · Cited by 196
Leigh, S., Uhlig, F., Wilmes, L., Sánchez-Díaz, P., Gheorghe, C. E., Goodson, M. S., Kelley‐Loughnane, N., Hyland, N. P., Cryan, J. F., & Clarke, G. A. (2023) · The Journal of Physiology · doi:10.1113/jp281951 · Cited by 201
The link between inflammation, bugs, the intestine and the brain in alcohol dependence
Leclercq, S., de Timary, P., Delzenne, N. M., & Stärkel, P. (2017) · Translational Psychiatry · doi:10.1038/tp.2017.15 · Cited by 174
Kuhn, K. A., Schulz, H. M., Regner, E. H., Severs, E., Hendrickson, J. D., Mehta, G., Whitney, A. K., Ir, D., Ohri, N., Robertson, C. E., et al. (2017) · Mucosal Immunology · doi:10.1038/mi.2017.55 · Cited by 173
Nová, Z., Škovierová, H., & Čalkovská, A. (2019) · International Journal of Molecular Sciences · doi:10.3390/ijms20040831 · Cited by 168
Intestinal epithelial barrier functions in ageing
Branca, J. J. V., Gulisano, M., & Nicoletti, C. (2019) · Ageing Research Reviews · doi:10.1016/j.arr.2019.100938 · Cited by 165
Ling, K. H., Wan, M. L. Y., El-Nezami, H. S., & Wang, M. (2016) · Chemical Research in Toxicology · doi:10.1021/acs.chemrestox.6b00001 · Cited by 135
Mechanisms of Intestinal Epithelial Barrier Dysfunction by Adherent-Invasive Escherichia coli
Shawki, A., & McCole, D. F. (2016) · Cellular and Molecular Gastroenterology and Hepatology · doi:10.1016/j.jcmgh.2016.10.004 · Cited by 142
Claudin-2: Roles beyond Permeability Functions
Venugopal, S., Anwer, S., & Szászi, K. (2019) · International Journal of Molecular Sciences · doi:10.3390/ijms20225655 · Cited by 132
Yan, Y., Yu, L., Qu, Y., Fan, Z., Zhang, T., Xu, Y., Du, Q., Brügger, D., Chen, Y., Zhang, K., et al. (2023) · npj Biofilms and Microbiomes · doi:10.1038/s41522-023-00420-5 · Cited by 136
Neuroimmune, metabolic and oxidative stress pathways in major depressive disorder
Maes, M. H. J., Almulla, A. F., You, Z., & Zhang, Y. (2025) · Nature Reviews Neurology · doi:10.1038/s41582-025-01116-4 · Cited by 140
Wang, Y., Mumm, J. B., Herbst, R., Kolbeck, R., & Wang, Y. (2017) · The Journal of Immunology · doi:10.4049/jimmunol.1700152 · Cited by 125
Cytokines and intestinal epithelial permeability: A systematic review
Meyer, F., Wendling, D., Demougeot, C., Prati, C., & Verhoeven, F. (2023) · Autoimmunity Reviews · doi:10.1016/j.autrev.2023.103331 · Cited by 125
Stärkel, P., Leclercq, S., de Timary, P., & Schnabl, B. (2018) · Clinical Science · doi:10.1042/cs20171055 · Cited by 127
Lowe, P., Gyöngyösi, B., Satishchandran, A., Iracheta‐Vellve, A., Cho, Y., Ambade, A., & Szabó, G. (2018) · Journal of Neuroinflammation · doi:10.1186/s12974-018-1328-9 · Cited by 126
Gut-liver axis signaling in portal hypertension
Simbrunner, B., Mandorfer, M., Trauner, M., & Reiberger, T. (2019) · World Journal of Gastroenterology · doi:10.3748/wjg.v25.i39.5897 · Cited by 113
Replication of CMV in the gut of HIV-infected individuals and epithelial barrier dysfunction
Maidji, E., Somsouk, M., Rivera, J. M., Hunt, P. W., & Stoddart, C. A. (2017) · PLoS Pathogens · doi:10.1371/journal.ppat.1006202 · Cited by 102
Puzan, M. L., Hosic, S., Ghio, C., & Koppes, A. N. (2018) · Scientific Reports · doi:10.1038/s41598-018-24768-3 · Cited by 100
Sugita, K., & Kabashima, K. (2020) · Journal of Leukocyte Biology · doi:10.1002/jlb.5mr0120-230r · Cited by 103
The dual role of interleukin-6 in Crohn’s disease pathophysiology
Alhendi, A., & Naser, S. (2023) · Frontiers in Immunology · doi:10.3389/fimmu.2023.1295230 · Cited by 98
Yu, H., Ding, X., Shang, L., Zeng, X., Liu, H., Li, N., Huang, S., Wang, Y., Wang, G., Cai, S., et al. (2018) · Frontiers in Cellular and Infection Microbiology · doi:10.3389/fcimb.2018.00242 · Cited by 98
Al-Sadi, R., Engers, J., Haque, M., King, S., Al-Omari, D., & Ma, T. Y. (2021) · PLOS ONE · doi:10.1371/journal.pone.0249544 · Cited by 93
Self-citationde Sire, R., Rizzatti, G., Ingravalle, F., Pizzoferrato, M., Petito, V., Lopetuso, L. R., Graziani, C., Alessandro de, S. I. R. E., Mentella, M. C., Mele, M. C., et al. (2018) · Minerva Gastroenterologica e Dietologica · doi:10.23736/s1121-421x.18.02511-4 · Cited by 93
Maes, M. H. J., Sirivichayakul, S., Kanchanatawan, B., & Vojdani, A. (2019) · Neurotoxicity Research · doi:10.1007/s12640-019-00054-6 · Cited by 93
Siddiqui, S. H., Kang, D., Park, J., Khan, M., & Shim, K. S. (2020) · Scientific Reports · doi:10.1038/s41598-020-75885-x · Cited by 84
The Implication of the Gut Microbiome in Heart Failure
Lupu, V. V., Răileanu, A. A., Mihai, C. M., Morariu, I. D., Lupu, A., Stârcea, I. M., Frăsinariu, O. E., Mocanu, A., Dragan, F., & Fotea, S. (2023) · Cells · doi:10.3390/cells12081158 · Cited by 89
Terciolo, C., Dapoigny, M. C., & André, F. (2019) · Clinical and Experimental Gastroenterology · doi:10.2147/ceg.s181590 · Cited by 94
A role for the peripheral immune system in the development of alcohol use disorders?
de Timary, P., Stärkel, P., Delzenne, N. M., & Leclercq, S. (2017) · Neuropharmacology · doi:10.1016/j.neuropharm.2017.04.013 · Cited by 82
Yu, H., Wang, Y., Zeng, X., Cai, S., Wang, G., Liu, L., Huang, S., Li, N., Liu, H., Ding, X., et al. (2019) · The FASEB Journal · doi:10.1096/fj.201901717r · Cited by 79
Cytokine responses and epithelial function in the intestinal mucosa
Onyiah, J. C., & Colgan, S. P. (2016) · Cellular and Molecular Life Sciences · doi:10.1007/s00018-016-2289-8 · Cited by 86
Lechuga, S., Neto, M. B. B., Naydenov, N. G., Rieder, F., & Ivanov, A. I. (2023) · Frontiers in Immunology · doi:10.3389/fimmu.2023.1108289 · Cited by 83
Ogden, H. B., Child, R. B., Fallowfield, J. L., Delves, S. K., Westwood, C. S., & Layden, J. D. (2020) · Nutrients · doi:10.3390/nu12020537 · Cited by 78
Zhao, S., Chen, Z., Zheng, J., Dai, J., Ou, W., Xu, W., Ai, Q., Zhang, W., Niu, J., Mai, K., et al. (2019) · Fish & Shellfish Immunology · doi:10.1016/j.fsi.2019.06.004 · Cited by 75
The gut reaction to traumatic brain injury
Katzenberger, R. J., Ganetzky, B., & Wassarman, D. A. (2015) · Fly · doi:10.1080/19336934.2015.1085623 · Cited by 77
Arab, J. P., Arrese, M. A., & Shah, V. H. (2019) · Hepatology Research · doi:10.1111/hepr.13473 · Cited by 76
The role of barrier function, autophagy, and cytokines in maintaining intestinal homeostasis
Elshaer, D., & Begun, J. (2016) · Seminars in Cell and Developmental Biology · doi:10.1016/j.semcdb.2016.08.018 · Cited by 72
Zhi, T., Hong, D., Zhang, Z., Li, S., Xia, J., Wang, C., Wu, Y.-L., Jia, Y., & Ma, A. (2021) · Food Research International · doi:10.1016/j.foodres.2021.110875 · Cited by 70
Alcohol-associated bowel disease: new insights into pathogenesis
Maccioni, L., Fu, Y., Horsmans, Y., Leclercq, I., Stärkel, P., Kunos, G., & Gao, B. (2023) · eGastroenterology · doi:10.1136/egastro-2023-100013 · Cited by 69
Shen, Y., Zhou, M., Yan, J., Gong, Z., Xiao, Y., Zhang, C., Du, P., & Chen, Y. (2016) · American Journal of Physiology-Gastrointestinal and Liver Physiology · doi:10.1152/ajpgi.00316.2016 · Cited by 68
The Impact of Microbiota-Gut-Brain Axis on Diabetic Cognition Impairment
Xu, Y., Zhou, H., & Zhu, Q. (2017) · Frontiers in Aging Neuroscience · doi:10.3389/fnagi.2017.00106 · Cited by 67
The Role of Gut-Derived Microbial Antigens on Liver Fibrosis Initiation and Progression
Chen, D., Le, T. H., Shahidipour, H., Read, S. A., & Ahlenstiel, G. (2019) · Cells · doi:10.3390/cells8111324 · Cited by 71
Lack of Vitamin D Receptor Leads to Hyperfunction of Claudin-2 in Intestinal Inflammatory Responses
Zhang, Y., Lu, R., Xia, Y., Zhou, D., Petrof, E. O., Claud, E. C., & Sun, J. (2018) · Inflammatory Bowel Diseases · doi:10.1093/ibd/izy292 · Cited by 66
Staat, C., Coisne, C., Dabrowski, S., Stamatovic, S. M., Andjelkovic, A. V., Wolburg, H., Engelhardt, B., & Blasig, I. E. (2015) · Biomaterials · doi:10.1016/j.biomaterials.2015.03.007 · Cited by 66
CD36 Deficiency Impairs the Small Intestinal Barrier and Induces Subclinical Inflammation in Mice
Cifarelli, V., Ivanov, S., Xie, Y., Son, N.-H., Saunders, B. T., Pietka, T., Shew, T. M., Yoshino, J., Sundaresan, S., Davidson, N., et al. (2016) · Cellular and Molecular Gastroenterology and Hepatology · doi:10.1016/j.jcmgh.2016.09.001 · Cited by 65
Karimi, S., Jonsson, H., Lundh, T., & Roos, S. (2018) · Physiological Reports · doi:10.14814/phy2.13514 · Cited by 63
Tugizov, S. M. (2016) · Tissue Barriers · doi:10.1080/21688370.2016.1159276 · Cited by 62
Choi, J., Wang, L. L., Liu, S., Lu, P., Zhao, X., Liu, H., Lahaye, L., Santín, E., Liu, S., Nyachoti, C. M., et al. (2020) · Journal of Animal Science · doi:10.1093/jas/skaa259 · Cited by 60
Wang, D., Chadha, G., Feygin, A., & Ivanov, A. I. (2015) · Cellular and Molecular Life Sciences · doi:10.1007/s00018-015-1890-6 · Cited by 58
Audo, R., Sanchez, P., Rivière, B., Mielle, J., Tan, J., Lukas, C., Macia, L., Morel, J., & Daïen, C. (2022) · Lara D. Veeken · doi:10.1093/rheumatology/keac454 · Cited by 59
Maes, M. H. J., Sirivichayakul, S., Kanchanatawan, B., & Vojdani, A. (2019) · Molecular Neurobiology · doi:10.1007/s12035-019-1578-2 · Cited by 59
TYK2 as a Therapeutic Target in the Treatment of Autoimmune and Inflammatory Diseases
Gonciarz, M., Pawlak-Buś, K. K., Leszczyński, P., & Owczarek, W. D. (2021) · Immunotherapy · doi:10.2217/imt-2021-0096 · Cited by 58
Tu, A., Wang, X. C., Chen, H., Jia, X., Wang, T., Yi, Y., Liu, B., Xin, W., Lü, X., & Shan, Y. (2021) · Journal of Agricultural and Food Chemistry · doi:10.1021/acs.jafc.1c00865 · Cited by 55
Jang, H., Kim, J.-K., Joo, M.-K., Shin, Y.-J., Lee, K., Lee, C. K., Kim, H. J., & Kim, D. (2022) · Scientific Reports · doi:10.1038/s41598-022-13629-9 · Cited by 59
Megyeri, K., Dernovics, Á., Al-Luhaibi, Z. I. I., & Rosztoczy, A. I. (2021) · World Journal of Gastroenterology · doi:10.3748/wjg.v27.i23.3208 · Cited by 57
Mitrović, M., Stanković-Popović, V., Tolinački, M., Golić, N., Bajić, S. S., Veljović, K., Nastasijević, B. J., Soldatović, I., Svorcan, P., & Dimkovic, N. B. (2022) · Journal of Renal Nutrition · doi:10.1053/j.jrn.2022.07.008 · Cited by 56
Shukla, P. K., Meena, A. S., Manda, B., Gomes-Solecki, M. J. C., Dietrich, P., Dragatsis, I., & Rao, R. (2018) · The FASEB Journal · doi:10.1096/fj.201800351r · Cited by 54
Glycine regulates mucosal immunity and the intestinal microbial composition in weaned piglets
Ji, Y. S., Fan, X., Zhang, Y., Li, J., Dai, Z., & Wu, Z. (2021) · Amino Acids · doi:10.1007/s00726-021-02976-y · Cited by 57
The role of polymorphonuclear neutrophils during HIV-1 infection
Yaseen, M. M., Abuharfeil, N. M., Yaseen, M. M., & Shabsoug, B. M. (2017) · Archives of Virology · doi:10.1007/s00705-017-3569-9 · Cited by 55
Making sense of gut feelings in the traumatic brain injury pathogenesis
Royes, L. F. F., & Gómez‐Pinilla, F. (2019) · Neuroscience & Biobehavioral Reviews · doi:10.1016/j.neubiorev.2019.05.012 · Cited by 55
Bifidobacterium adolescentis supplementation attenuates fracture-induced systemic sequelae
Roberts, J. L., Liu, G., Darby, T. M., Fernandes, L. M., Díaz‐Hernández, M. E., Jones, R. M., & Drissi, H. (2020) · Biomedicine & Pharmacotherapy · doi:10.1016/j.biopha.2020.110831 · Cited by 53
Exploring the lung-gut direction of the gut-lung axis in patients with ARDS
Ziaka, M., & Exadaktylos, A. K. (2024) · Critical Care · doi:10.1186/s13054-024-04966-4 · Cited by 52
Effects of Aluminum on the Integrity of the Intestinal Epithelium: An in Vitro and in Vivo Study
Jeong, C. H., Kwon, H.-C., Kim, D. H., Cheng, W. N., Kang, S., Shin, D., Yune, J. H., Yoon, J. E., Chang, Y. H., Sohn, H., et al. (2020) · Environmental Health Perspectives · doi:10.1289/ehp5701 · Cited by 53
Psychosocial stress-induced intestinal permeability in healthy humans: What is the evidence?
Torre, D. L., Oudenhove, L. V., Vanuytsel, T., & Verbeke, K. (2023) · Neurobiology of Stress · doi:10.1016/j.ynstr.2023.100579 · Cited by 52
Rho-A prenylation and signaling link epithelial homeostasis to intestinal inflammation
López-Posadas, R., Becker, C., Günther, C., Tenzer, S., Amann, K., Billmeier, U., Atreya, R. N., Fiorino, G., Vetrano, S., Danese, S., et al. (2016) · Journal of Clinical Investigation · doi:10.1172/jci80997 · Cited by 49
Dose-dependent effects of lead induced gut injuries: An in vitro and in vivo study
Yu, L., Yu, Y., Yin, R., Duan, H., Qu, D., Tian, F., Narbad, A., Chen, W., & Zhai, Q. (2020) · Chemosphere · doi:10.1016/j.chemosphere.2020.129130 · Cited by 48
Chen, Z., Long, Y., Pan, Y., Long, X., Mu, J., Yi, R., & Zhao, X. (2021) · Frontiers in Pharmacology · doi:10.3389/fphar.2021.700217 · Cited by 47
Stachyose modulates gut microbiota and alleviates DSS-induced ulcerative colitis in mice
Wang, C., Bai, J., Wang, B., Yu, L., Tian, F., Zhao, J., Zhang, H., Suo, H., Chen, W., & Zhai, Q. (2023) · Food Science and Human Wellness · doi:10.1016/j.fshw.2023.03.041 · Cited by 48
Interplay of GTPases and Cytoskeleton in Cellular Barrier Defects during Gut Inflammation
López-Posadas, R., Stürzl, M., Atreya, I., Neurath, M. F., & Britzen‐Laurent, N. (2017) · Frontiers in Immunology · doi:10.3389/fimmu.2017.01240 · Cited by 46
Nieman, D. C., Kay, C. D., Rathore, A., Grace, M. H., Strauch, R. C., Stephan, E. H., Sakaguchi, C. A., & Lila, M. A. (2018) · Nutrients · doi:10.3390/nu10111718 · Cited by 46
Ma, Y., Wang, Q., Yu, K., Fan, X., Xiao, W., Cai, Y., Xu, P., Yu, M., & Yang, H. (2018) · Chemico-Biological Interactions · doi:10.1016/j.cbi.2018.04.020 · Cited by 44
Governa, P., Marchi, M., Cocetta, V., Leo, B. D., Saunders, P. T. K., Catanzaro, D., Miraldi, E., Montopoli, M., & Biagi, M. (2018) · Pharmaceuticals · doi:10.3390/ph11040126 · Cited by 43
Wang, X., Zhang, Y., Cao, L., Zhu, L., Huang, Y., Chen, X., Chu, X.-Y., Zhu, D., Rahman, S. U., Feng, S., et al. (2019) · Toxins · doi:10.3390/toxins11110663 · Cited by 43
Tight Junctions and the Intestinal Barrier
Ma, T. Y., Nighot, P. K., & Al–Sadi, R. (2018) · Elsevier eBooks · doi:10.1016/b978-0-12-809954-4.00025-6 · Cited by 42
Self-citationWang, N., Wang, S., Xu, B., Liu, F., Huo, G., & Li, B. (2021) · Microorganisms · doi:10.3390/microorganisms9102093 · Cited by 41
Banerjee, S., Fu, Q., Shah, S. K., Melnyk, S. B., Sterneck, E., Hauer‐Jensen, M., & Pawar, S. A. (2019) · Scientific Reports · doi:10.1038/s41598-019-49437-x · Cited by 38
Gu, M., Pan, S., Li, Q., Qi, Z., Deng, W., & Bai, N. (2021) · Fish & Shellfish Immunology · doi:10.1016/j.fsi.2021.04.013 · Cited by 40
Mechanisms underlying reduced weight gain in intestinal fatty acid-binding protein (IFABP) null mice
Lackey, A. I., Chen, T., Zhou, Y. X., Arias, N. M. B., Doran, J. M., Zacharisen, S. M., Gajda, A. M., Jonsson, W. O., Córsico, B., Anthony, T. G., et al. (2020) · American Journal of Physiology-Gastrointestinal and Liver Physiology · doi:10.1152/ajpgi.00120.2019 · Cited by 40
Bifidobacterium longum supplementation improves age‐related delays in fracture repair
Roberts, J. L., Golloshi, M., Harding, D. B., Conduah, M., Liu, G., & Drissi, H. (2023) · Aging Cell · doi:10.1111/acel.13786 · Cited by 38
Janga, H., Cassidy, L., Wang, F., Spengler, D., Oestern‐Fitschen, S., Krause, M., Seekamp, A., Tholey, A., & Fuchs, S. (2017) · Journal of Cellular and Molecular Medicine · doi:10.1111/jcmm.13421 · Cited by 38
Rodrigues, L., Donado-Pestana, C. M., Moura, M. H. C., Silva, R. R. E., Pessoa, É. V. M., & Genovese, M. I. (2021) · Food Research International · doi:10.1016/j.foodres.2021.110139 · Cited by 42
Flamant, M., Rigaill, J., Paul, S., & Roblin, X. (2017) · Drugs · doi:10.1007/s40265-017-0755-8 · Cited by 37
Wang, X., Wang, H., Zhang, R., Li, D., & Gao, M. (2019) · International Journal of Biological Sciences · doi:10.7150/ijbs.38214 · Cited by 36
Xun, W., Ji, M., Ma, Z., Deng, T., Yang, W., Hou, G., Shi, L., & Cao, T. (2023) · Animal nutrition · doi:10.1016/j.aninu.2023.05.004 · Cited by 34
Corrigendum: Inflammatory and Microbiota-Related Regulation of the Intestinal Epithelial Barrier
Barbara, G., Barbaro, M. R., Fuschi, D., Palombo, M., Falangone, F., Cremon, C., Marasco, G., & Stanghellini, V. (2021) · Frontiers in Nutrition · doi:10.3389/fnut.2021.790387 · Cited by 41
Metadata
- Authors
- Al-Sadi, R., Ye, D., Boivin, M., Guo, S., Hashimi, M., Ereifej, L., & Ma, T. Y.
- Affiliations
- University of New Mexico (US)
- Corresponding author
- Ye, Dongmei
- Boivin, Michel
- Guo, Shuhong
- Hashimi, Mariam
- Ereifej, Lisa
- Ma, Thomas Y.
- Venue
- PLoS ONE
- Publisher
- Public Library of Science (PLoS)
- Published
- 2014-03-24
- Volume
- 9
- Issue
- 3
- Pages
- e85345
- ISSN
- 1932-6203 (ISSN-L)
- PMC
- PMC3963839
- OpenAlex
- W2126506597
- Cited by
- 280
- References
- 43
- Citations by year
- 2026: 22 · 2025: 24 · 2024: 26 · 2023: 31 · 2022: 29 · 2021: 35 · 2020: 17 · 2019: 26 · 2018: 21 · 2017: 19 · 2016: 18 · 2015: 12
- FWCI
- 8.48
- Type
- journal article
- Language
- en
- Open access
- gold
- doi.org
- Licence
- Locations
- PLoS ONE (publishedVersion, public-domain)
- Europe PMC (PubMed Central) (publishedVersion, other-oa)
- PubMed Central (publishedVersion, public-domain)
- PubMed (publishedVersion)
- DOAJ (DOAJ: Directory of Open Access Journals) (submittedVersion, cc-by-sa)
- Funders
- U.S. Department of Veterans Affairs
- National Institute of Diabetes and Digestive and Kidney Diseases (R0 1-DK-81429-03, R01DK081429, RO 1-DK-81429)
- Topics
- Life Sciences › Neuroscience › Neurology › Barrier Structure and Function Studies
- Health Sciences › Medicine › Gastroenterology › Gastrointestinal motility and disorders
- Health Sciences › Medicine › Immunology and Allergy › Cell Adhesion Molecules Research
- Keywords
- interleukin-6, claudin-2, JNK signaling, AP-1 transcription factor, intestinal epithelial barrier, intestinal inflammation, Caco-2 cell monolayers, intestinal permeability, size-selective permeability
- MeSH terms
- Animals, Humans, Intestinal Mucosa, Permeability, Transcriptional Activation, Interleukin-6, Transcription Factor AP-1, Caco-2 Cells, Tight Junctions, MAP Kinase Signaling System, Intracellular Space, JNK Mitogen-Activated Protein Kinases, Mice, Claudin-2
About these checks
Registry, retraction, Cites and statistics results are computed, not judged, with one exception: a printed reference that no index lists is read once by a model before it counts as a citation error. Claims are extracted by a model and kept only when their quote appears verbatim in the text; each cited source is then checked, with a model’s help, for whether it says what the claim relies on. Those verdicts can be wrong — read the claim’s quote and the cited source before relying on one.
Statistics and arithmetic are recomputed, not judged.
Confidence bands are shown only for fields calibrated on our annotated test set. None is calibrated yet, so no band is shown.
What counts as a claim ›How we measure confidence ›How we check this ›
Are you an author, or do you see a problem with this page? Request a review
