

The DOI matches its Crossref record; 30 of the 30 references it cites were found in a registry or an index.
Motor Effort Alters Changes of Mind in Sensorimotor Decision Making
Open accessAbstract
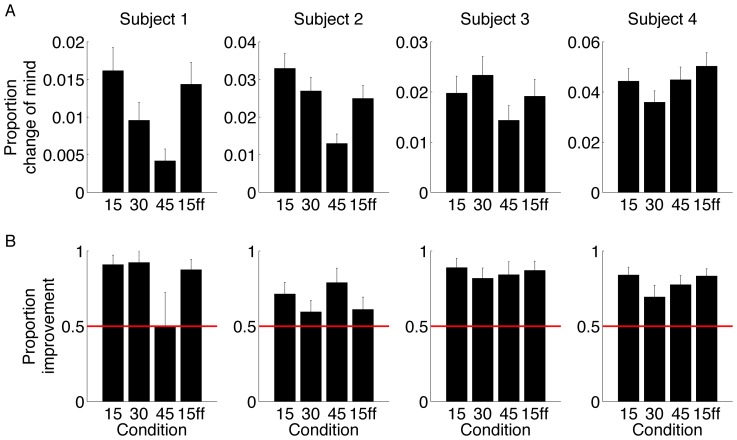
After committing to an action, a decision-maker can change their mind to revise the action. Such changes of mind can even occur when the stream of information that led to the action is curtailed at movement onset. This is explained by the time delays in sensory processing and motor planning which lead to a component at the end of the sensory stream that can only be processed after initiation. Such post-initiation processing can explain the pattern of changes of mind by asserting an accumulation of additional evidence to a criterion level, termed change-of-mind bound. Here we test the hypothesis that physical effort associated with the movement required to change one's mind affects the level of the change-of-mind bound and the time for post-initiation deliberation. We varied the effort required to change from one choice target to another in a reaching movement by varying the geometry of the choice targets or by applying a force field between the targets. We show that there is a reduction in the frequency of change of mind when the separation of the choice targets would require a larger excursion of the hand from the initial to the opposite choice. The reduction is best explained by an increase in the evidence required for changes of mind and a reduced time period of integration after the initial decision. Thus the criteria to revise an initial choice is sensitive to energetic costs.
Overview
The claims and statistics of this paper haven’t been checked yet.
Run the check — free, no account needed. It reads the open-access text and checks the sources it cites.
Integrity signals
Registry
Cites
Statistics
Figures
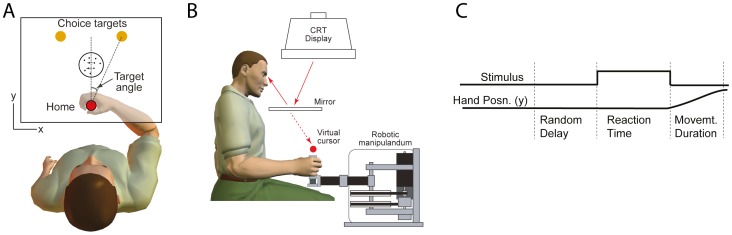
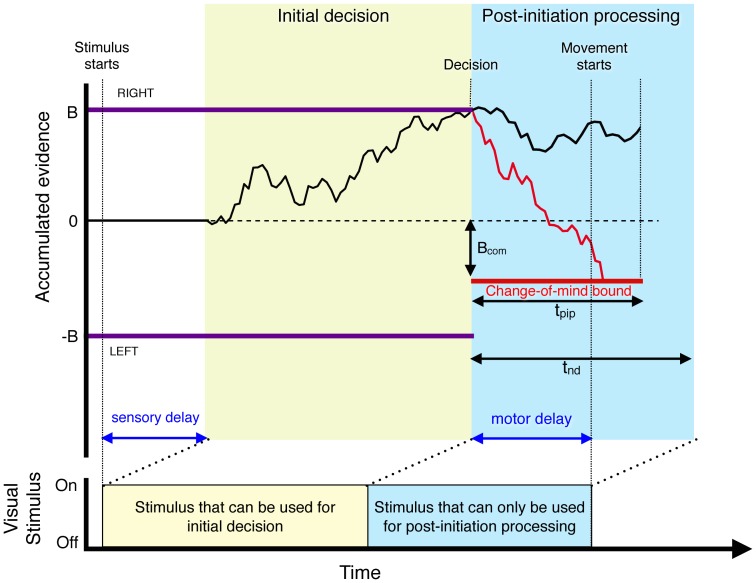
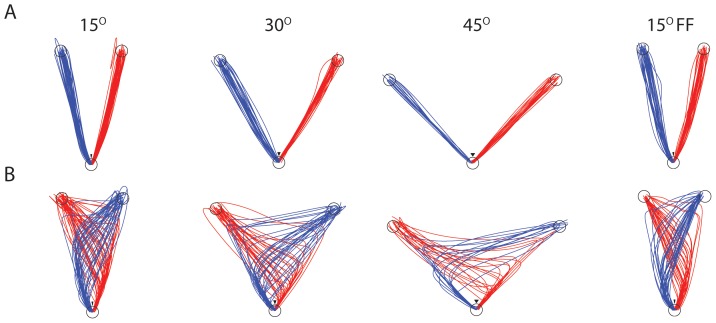
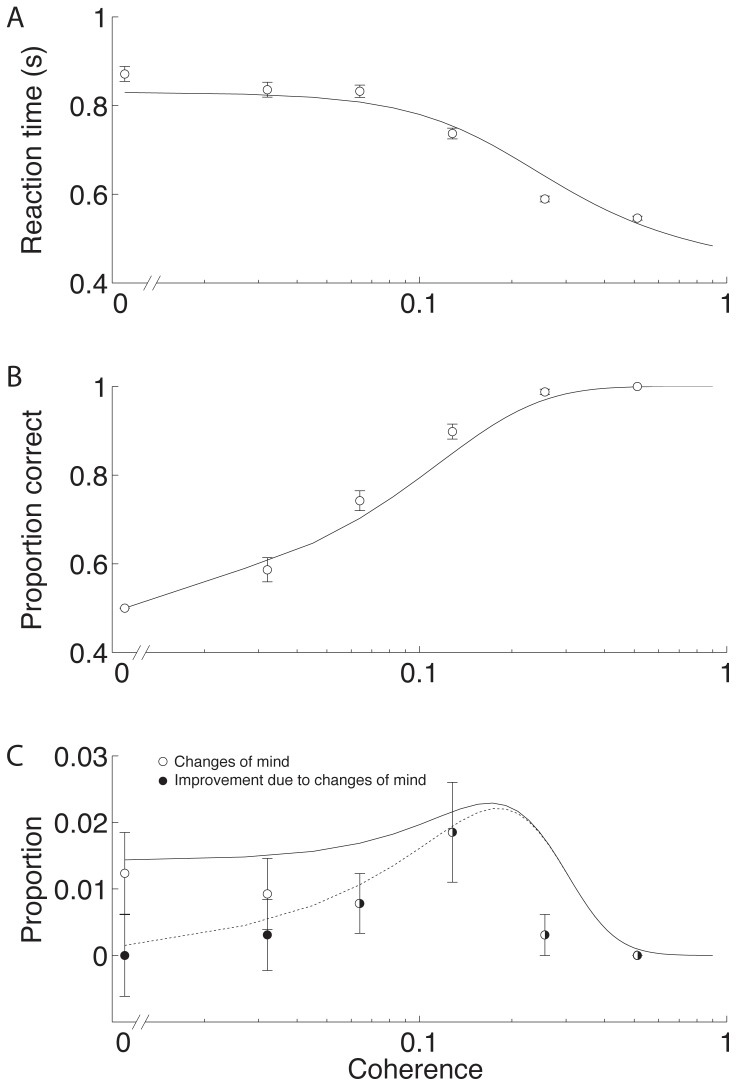
Verification
Claims the paper makes
The claims and statistics of this paper haven’t been checked yet.
Run the check — free, no account needed. It reads the open-access text and checks the sources it cites.
Claims other papers make about this one
Each is checked against this paper’s own text: does it say what the citing paper says it does?
In the citing paper
“For three of the four subjects, changes of decision corrected an initial error more often than they spoiled an initially correct choice (P<0.001, P<0.001, P = 0.084, P<0.001), consistent with previous reports (Resulaj et al., 2009; Burk et al., 2014).”
From A common mechanism underlies changes of mind about decisions and confidence (2016) · cites this paper as Burk et al., 2014
In the citing paper
“In previous studies, we showed that the motor system receives a continuous updating of the state of the evidence leading to a choice (Gold and Shadlen, 2000; Selen et al., 2012) and can utilize the late arriving information to revise an initial choice by continuing the process of deliberation (Resulaj et al., 2009; Burk et al., 2014).”
From A common mechanism underlies changes of mind about decisions and confidence (2016) · cites this paper as Burk et al., 2014
In the citing paper
“To further reduce the degrees of freedom of the model to four we fixed both the covariance ρ to -0.5 ≈ -0.71 and non-decision time standard deviation σtnd to 60 ms (within the normal range from a previous study (Burk et al., 2014) and supported by an analysis of motion energy; see Figure 1—figure supplement 1).”
From A common mechanism underlies changes of mind about decisions and confidence (2016) · cites this paper as Burk et al., 2014
Self-check
Percentages, sums and reported differences re-computed from the paper’s own numbers.
The self-check needs the paper’s full text.
Citations
Cites
(2005) · Springer eBooks · doi:10.1007/0-387-27255-0_9 · Cited by 20,333
McCullagh, P., & Nelder, J. A. (1989) · doi:10.1007/978-1-4899-3242-6 · Cited by 16,836
Ratcliff, R. (1978) · Psychological Review · doi:10.1037/0033-295x.85.2.59 · Cited by 4,513
The Neural Basis of Decision Making
Gold, J. I., & Shadlen, M. N. (2007) · Annual Review of Neuroscience · doi:10.1146/annurev.neuro.29.051605.113038 · Cited by 3,764
Self-citationOptimal feedback control as a theory of motor coordination
Todorov, E., & Jordan, M. I. (2002) · Nature Neuroscience · doi:10.1038/nn963 · Cited by 3,081 · cited 1×
“Minimizing these costs provides a rich framework for choosing among possible trajectories and online control of movement [20,21].”
BackgroundRoitman, J. D., & Shadlen, M. N. (2002) · The Journal of Neuroscience · doi:10.1523/jneurosci.22-21-09475.2002 · Cited by 1,589 · cited 3×
“In monkeys, the decision variable is represented in structures that are associated with planning the motor response [14,23] and the motor system of both human and nonhuman primates are affected by partial informa tion leading to a decision [15,19,24–27].”
BackgroundMethodModeling Response Times for Two-Choice Decisions
Ratcliff, R., & Rouder, J. N. (1998) · Psychological Science · doi:10.1111/1467-9280.00067 · Cited by 1,478
Information theory of choice-reaction times
Laming, D. (1968) · Medical Entomology and Zoology · Cited by 945
Decision Making as a Window on Cognition
Shadlen, M. N., & Kiani, R. (2013) · Neuron · doi:10.1016/j.neuron.2013.10.047 · Cited by 694
Hidden cognitive states revealed in choice reaching tasks
Song, J., & Nakayama, K. (2009) · Trends in Cognitive Sciences · doi:10.1016/j.tics.2009.04.009 · Cited by 691
Cited by
Sorted by citations
Decision-making in sensorimotor control
Gallivan, J. P., Chapman, C. S., Wolpert, D. M., & Flanagan, J. R. (2018) · Nature reviews. Neuroscience · doi:10.1038/s41583-018-0045-9 · Cited by 332
A common mechanism underlies changes of mind about decisions and confidence
van den Berg, R., Anandalingam, K., Zylberberg, A., Kiani, R., Shadlen, M. N., & Wolpert, D. M. (2016) · eLife · doi:10.7554/elife.12192 · Cited by 270
Self-citationEmbodied choice: how action influences perceptual decision making
Lepora, N. F., & Pezzulo, G. (2015) · PLOS Computational Biology · doi:10.1371/journal.pcbi.1004110 · Cited by 209
Confidence Is the Bridge between Multi-stage Decisions
van den Berg, R., Zylberberg, A., Kiani, R., Shadlen, M. N., & Wolpert, D. M. (2016) · Current Biology · doi:10.1016/j.cub.2016.10.021 · Cited by 125
Process-Tracing Methods in Decision Making: On Growing Up in the 70s
Schulte‐Mecklenbeck, M., Johnson, J. G., Böckenholt, U., Goldstein, D. G., Russo, J. E., Sullivan, N. J., & Willemsen, M. C. (2017) · Current Directions in Psychological Science · doi:10.1177/0963721417708229 · Cited by 137
Perceptual decisions are biased by the cost to act
Hagura, N., Haggard, P., & Diedrichsen, J. (2017) · eLife · doi:10.7554/elife.18422 · Cited by 135
Siedlecka, M., Paulewicz, B., & Wierzchoń, M. (2016) · Frontiers in Psychology · doi:10.3389/fpsyg.2016.00218 · Cited by 109
Models, movements, and minds: bridging the gap between decision making and action
Wispinski, N. J., Gallivan, J. P., & Chapman, C. S. (2018) · Annals of the New York Academy of Sciences · doi:10.1111/nyas.13973 · Cited by 112
Coallier, É., Michelet, T., & Kalaska, J. F. (2015) · Journal of Neurophysiology · doi:10.1152/jn.00166.2014 · Cited by 88
Piercing of Consciousness as a Threshold-Crossing Operation
Kang, Y. H., Petzschner, F. H., Wolpert, D. M., & Shadlen, M. N. (2017) · Current Biology · doi:10.1016/j.cub.2017.06.047 · Cited by 90
The road towards understanding embodied decisions
Gordon, J. R., Maselli, A., Lancia, G. L., Thiery, T., Cisek, P., & Pezzulo, G. (2021) · Neuroscience & Biobehavioral Reviews · doi:10.1016/j.neubiorev.2021.09.034 · Cited by 102
Psychophysical reverse correlation reflects both sensory and decision-making processes
Okazawa, G., Sha, L., Purcell, B. A., & Kiani, R. (2018) · Nature Communications · doi:10.1038/s41467-018-05797-y · Cited by 84
Rapid target foraging with reach or gaze: The hand looks further ahead than the eye
Diamond, J. S., Wolpert, D. M., & Flanagan, J. R. (2017) · PLoS Computational Biology · doi:10.1371/journal.pcbi.1005504 · Cited by 62
Effort, success, and nonuse determine arm choice
Schweighofer, N., Xiao, Y., Kim, S., Yoshioka, T., Gordon, J., & Osu, R. (2015) · Journal of Neurophysiology · doi:10.1152/jn.00593.2014 · Cited by 66
Motor Cost Influences Perceptual Decisions
Marcos, E., Cos, I., Girard, B., & Verschure, P. F. M. J. (2015) · PLoS ONE · doi:10.1371/journal.pone.0144841 · Cited by 61
On second thoughts: changes of mind in decision-making
Stone, C., Mattingley, J. B., & Rangelov, D. (2022) · Trends in Cognitive Sciences · doi:10.1016/j.tics.2022.02.004 · Cited by 65
Design choices: Empirical recommendations for designing two-dimensional finger-tracking experiments
Wirth, R., Foerster, A., Kunde, W., & Pfister, R. (2020) · Behavior Research Methods · doi:10.3758/s13428-020-01409-0 · Cited by 49
Movement tracking of psychological processes: A tutorial using mousetrapPreprint
Wulff, D. U., Kieslich, P. J., Henninger, F., Haslbeck, J. M. B., & Schulte‐Mecklenbeck, M. (2021) · doi:10.31234/osf.io/v685r · Cited by 41
Reynaud, A. J., Saleri, C., & Thura, D. (2020) · Journal of Neurophysiology · doi:10.1152/jn.00220.2020 · Cited by 38
Schoemann, M., Lüken, M., Grage, T., Kieslich, P. J., & Scherbaum, S. (2019) · Behavior Research Methods · doi:10.3758/s13428-018-1179-4 · Cited by 41
O’Hora, D. P., Carey, R., Kervick, A. A., Crowley, D. N., & Dabrowski, M. (2016) · Scientific Reports · doi:10.1038/srep20740 · Cited by 37
Lux, V., Non, A. L., Pexman, P. M., Stadler, W., Weber, L. A. E., & Krüger, M. (2021) · Frontiers in Systems Neuroscience · doi:10.3389/fnsys.2021.672740 · Cited by 45
Abandoning and modifying one action plan for alternatives
Song, J. (2017) · Philosophical Transactions of the Royal Society B Biological Sciences · doi:10.1098/rstb.2016.0195 · Cited by 36
Harris, A. M., & Lim, S.-L. (2016) · Journal of Neuroscience · doi:10.1523/jneurosci.4016-15.2016 · Cited by 36
Slowing the body slows down time perception
Kock, R. D., Zhou, W., Joiner, W. M., & Wiener, M. (2021) · eLife · doi:10.7554/elife.63607 · Cited by 39
Embodied decisions during walking
Grießbach, E., Raßbach, P., Herbort, O., & Cañal‐Bruland, R. (2022) · Journal of Neurophysiology · doi:10.1152/jn.00149.2022 · Cited by 29
Movement characteristics impact decision-making and vice versa
Carsten, T., Fievez, F., & Duqué, J. (2023) · Scientific Reports · doi:10.1038/s41598-023-30325-4 · Cited by 29
Changes of Mind after Movement Onset Depend on the State of the Motor System
Cos, I., Pezzulo, G., & Cisek, P. (2021) · eNeuro · doi:10.1523/eneuro.0174-21.2021 · Cited by 28
Wulff, D. U., Haslbeck, J. M. B., Kieslich, P. J., Henninger, F., & Schulte‐Mecklenbeck, M. (2019) · Routledge eBooks · doi:10.4324/9781315160559-10 · Cited by 28
Perceptual decision confidence is sensitive to forgone physical effort expenditure
Turner, W., Angdias, R., Feuerriegel, D., Chong, T. T. ‐., Hester, R., & Bode, S. (2020) · Cognition · doi:10.1016/j.cognition.2020.104525 · Cited by 25
Tracking continuities in the flanker task: From continuous flow to movement trajectories
Erb, C. D., Smith, K., & Moher, J. (2020) · Attention Perception & Psychophysics · doi:10.3758/s13414-020-02154-4 · Cited by 26
Body dynamics of gait affect value-based decisions
Grießbach, E., Incagli, F., Herbort, O., & Cañal‐Bruland, R. (2021) · Scientific Reports · doi:10.1038/s41598-021-91285-1 · Cited by 24
Mouse-tracking: Detecting Types in Movement TrajectoriesPreprint
Wulff, D. U., Haslbeck, J. M. B., Kieslich, P. J., Henninger, F., & Schulte‐Mecklenbeck, M. (2018) · doi:10.31234/osf.io/6edca · Cited by 24
Embodied decisions as active inference
Priorelli, M., Stoianov, I. P., & Pezzulo, G. (2025) · PLoS Computational Biology · doi:10.1371/journal.pcbi.1013180 · Cited by 23
Barany, D. A., Gómez-Granados, A., Schrayer, M., Cutts, S. A., & Singh, T. (2020) · Journal of Neurophysiology · doi:10.1152/jn.00098.2020 · Cited by 23
Saleri, C., Reynaud, A. J., & Thura, D. (2021) · Frontiers in Human Neuroscience · doi:10.3389/fnhum.2021.715212 · Cited by 19
Perceptual change-of-mind decisions are sensitive to absolute evidence magnitude
Turner, W., Feuerriegel, D., Andrejević, M., Hester, R., & Bode, S. (2020) · Cognitive Psychology · doi:10.1016/j.cogpsych.2020.101358 · Cited by 22
Hinz, M., Lehmann, N., Aye, N., Melcher, K., Tolentino-Castro, J. W., Wagner, H., & Taubert, M. (2022) · Frontiers in Psychology · doi:10.3389/fpsyg.2022.854208 · Cited by 20
The validity and consistency of continuous joystick response in perceptual decision-making
Szul, M. J., Bompas, A., Sumner, P., & Zhang, J. (2019) · Behavior Research Methods · doi:10.3758/s13428-019-01269-3 · Cited by 16
Reach Trajectories Characterize Tactile Localization for Sensorimotor Decision Making
Brandes, J., & Heed, T. (2015) · Journal of Neuroscience · doi:10.1523/jneurosci.1873-14.2015 · Cited by 15
A comparison of simple movement behaviors across three different devices
Moher, J., & Song, J. (2019) · Attention Perception & Psychophysics · doi:10.3758/s13414-019-01856-8 · Cited by 15
Action Fluency Facilitates Perceptual Discrimination
Guo, J., & Song, J. (2019) · Psychological Science · doi:10.1177/0956797619859361 · Cited by 15
Embodied decision making in athletes and other animals
Maselli, A., Iodice, P., Cisek, P., & Pezzulo, G. (2025) · Psychology of sport and exercise · doi:10.1016/j.psychsport.2025.102915 · Cited by 18
Age-related deficits in rapid visuomotor decision-making
Gómez-Granados, A., Barany, D. A., Schrayer, M., Kurtzer, I. L., Bonnet, C. T., & Singh, T. (2021) · Journal of Neurophysiology · doi:10.1152/jn.00073.2021 · Cited by 16
The influence of movement-related costs when searching to act and acting to search
Moskowitz, J. B., Berger, S. A., Fooken, J., Castelhano, M. S., Gallivan, J. P., & Flanagan, J. R. (2022) · Journal of Neurophysiology · doi:10.1152/jn.00305.2022 · Cited by 14
Choice of Arm Use in Stroke Survivors is Largely Driven by the Energetic Cost of the Movement
Nguyen, H., Phan, T. Q., Shadmehr, R., & Lee, S. W. (2023) · Neurorehabilitation and neural repair · doi:10.1177/15459683231164788 · Cited by 14
The integrated control of decision and movement vigor
Thura, D., Haith, A. M., Derosière, G., & Duqué, J. (2025) · Trends in Cognitive Sciences · doi:10.1016/j.tics.2025.07.005 · Cited by 20
Beyond reach: Do symmetric changes in motor costs affect decision making? A registered report
Zgonnikov, A., Atiya, N. A. A., O’Hora, D. P., Rañó, I., & Wong‐Lin, K. (2019) · Judgment and Decision Making · doi:10.1017/s1930297500006136 · Cited by 13
Elite Players Invest Additional Time for Making Better Embodied Choices
Hinz, M., Lehmann, N., & Musculus, L. (2022) · Frontiers in Psychology · doi:10.3389/fpsyg.2022.873474 · Cited by 13
Ulbrich, P., & Gail, A. (2023) · eNeuro · doi:10.1523/eneuro.0240-22.2023 · Cited by 10
Trilogy: A New Paradigm of ConsciousnessPreprint
Farhadi, A. (2022) · Preprints.org · doi:10.20944/preprints202206.0073.v1 · Cited by 10
Gim, S., Hong, S., Losin, E. A. R., & Woo, C. (2024) · PLoS Biology · doi:10.1371/journal.pbio.3002910 · Cited by 10
Turner, W., Feuerriegel, D., Hester, R., & Bode, S. (2022) · PLoS Computational Biology · doi:10.1371/journal.pcbi.1009738 · Cited by 9
Goueytes, D., Stockart, F., Robin, A., Gyger, L., Rouy, M., Hoffmann, D., Minotti, L., Kahane, P., Pereira, M., & Faivre, N. (2025) · Nature Communications · doi:10.1038/s41467-025-61744-8 · Cited by 12
I Plan Therefore I Choose: Free-Choice Bias Due to Prior Action-Probability but Not Action-Value
Suriya-Arunroj, L., & Gail, A. (2015) · Frontiers in Behavioral Neuroscience · doi:10.3389/fnbeh.2015.00315 · Cited by 8
Asymmetric valuation of gains and losses in effort-based decision making
O’Brien, M. K., & Ahmed, A. A. (2019) · PLoS ONE · doi:10.1371/journal.pone.0223268 · Cited by 10
Computational Modeling: Human Dynamic Model
Liu, L., Cooper, J. L., & Ballard, D. H. (2021) · Frontiers in Neurorobotics · doi:10.3389/fnbot.2021.723428 · Cited by 9
Perceptual Decision-Making: Picking the Low-Hanging Fruit?
de Lange, F. P., & Fritsche, M. (2017) · Trends in Cognitive Sciences · doi:10.1016/j.tics.2017.03.006 · Cited by 7
Impact of decision and action outcomes on subsequent decision and action behaviours in humans
Lunazzi, C., Thura, D., & Reynaud, A. J. (2023) · European Journal of Neuroscience · doi:10.1111/ejn.15932 · Cited by 8
Moskowitz, J. B., Fooken, J., Castelhano, M. S., Gallivan, J. P., & Flanagan, J. R. (2023) · Journal of Vision · doi:10.1167/jov.23.6.4 · Cited by 7
Changes of mind after movement onset: a motor-state dependent decision-making processPreprint
Cos, I., Pezzulo, G., & Cisek, P. (2021) · bioRxiv (Cold Spring Harbor Laboratory) · doi:10.1101/2021.02.15.431196 · Cited by 7
Mental graphs structure the storage and retrieval of visuomotor associations
Trach, J. E., & McDougle, S. D. (2025) · Nature Human Behaviour · doi:10.1038/s41562-025-02217-2 · Cited by 5
Movement tracking of psychological processes: A tutorial using mousetrap
Wulff, D. U., Kieslich, P. J., Henninger, F., Haslbeck, J. M. B., & Schulte‐Mecklenbeck, M. (2025) · Behavior Research Methods · doi:10.3758/s13428-025-02695-2 · Cited by 53
Evidence for interacting but decoupled controls of decisions and movements in nonhuman primates
Saleri, C., & Thura, D. (2024) · Journal of Neurophysiology · doi:10.1152/jn.00087.2024 · Cited by 6
A Hierarchical Attractor Network Model of perceptual versus intentional decision updates
Löffler, A., Sylaidi, A., Fountas, Z., & Haggard, P. (2021) · Nature Communications · doi:10.1038/s41467-021-22017-2 · Cited by 6
Computations in Sensorimotor LearningPreprint
Wolpert, D. M. (2014) · Cold Spring Harbor Symposia on Quantitative Biology · doi:10.1101/sqb.2014.79.024919 · Cited by 6
Explicit effort may not influence perceptuomotor decision-making
Manzone, J. X., & Welsh, T. N. (2023) · Experimental Brain Research · doi:10.1007/s00221-023-06710-w · Cited by 5
Action-based confidence sharing and collective decision making
Coucke, N., Heinrich, M. K., Dorigo, M., & Cleeremans, A. (2024) · iScience · doi:10.1016/j.isci.2024.111006 · Cited by 5
Muscular reflex gains reflect changes of mind in reaching
Visser, Y. F., Medendorp, W. P., & Selen, L. P. J. (2023) · Journal of Neurophysiology · doi:10.1152/jn.00197.2023 · Cited by 5
The dynamics of decision-making and action during active sampling
Ozbagci, D., Moreno‐Bote, R., & Soto‐Faraco, S. (2021) · Scientific Reports · doi:10.1038/s41598-021-02595-3 · Cited by 5
A neurocomputational model of decision and confidence in object recognition task
Roshan, S. S., Sadeghnejad, N., Sharifizadeh, F., & Ebrahimpour, R. (2024) · Neural Networks · doi:10.1016/j.neunet.2024.106318 · Cited by 4
Reaching Distance Influences Perceptual Decisions
Assarioti, E. E., van Beers, R. J., Smeets, J. B. J., & van Wijk, B. C. M. (2025) · European Journal of Neuroscience · doi:10.1111/ejn.70006 · Cited by 6
Physical Libertarianism: Redeeming the Illusion of Free Will Back into RealityPreprint
Farhadi, A. (2022) · Preprints.org · doi:10.20944/preprints202206.0136.v1 · Cited by 4
Goueytes, D., Stockart, F., Robin, A., Gyger, L., Rouy, M., Hoffmann, D., Minotti, L., Kahane, P., Pereira, M., & Faivre, N. (2024) · bioRxiv (Cold Spring Harbor Laboratory) · doi:10.1101/2024.03.23.586414 · Cited by 4
Studying Embodied Decisions in the Wild and in the Lab
Gordon, J. R., Lancia, G. L., Eluchans, M., Maselli, A., Thiery, T., Cisek, P., & Pezzulo, G. (2022) · Springer eBooks · doi:10.1007/978-3-031-08629-8_15 · Cited by 3
Neural mechanisms of metacognitive improvement under speed pressure
Stone, C., Mattingley, J., & Rangelov, D. (2025) · Communications Biology · doi:10.1038/s42003-025-07646-3 · Cited by 4
Movement characteristics impact decision-making and vice versaPreprint
Carsten, T., Fievez, F., & Duqué, J. (2022) · bioRxiv (Cold Spring Harbor Laboratory) · doi:10.1101/2022.02.02.478832 · Cited by 3
Zuk, A. A. O., Bertrand, J. K., & Chapman, C. S. (2024) · Computers in Human Behavior · doi:10.1016/j.chb.2024.108450 · Cited by 2
Manzone, J. X., Taravati, S., Neyedli, H. F., & Welsh, T. N. (2020) · Quarterly Journal of Experimental Psychology · doi:10.1177/1747021820940620 · Cited by 2
Learning and Embodied Decisions in Active Inference
Priorelli, M., Stoianov, I. P., & Pezzulo, G. (2024) · Communications in computer and information science · doi:10.1007/978-3-031-77138-5_5 · Cited by 2
Farhadi, A. (2024) · Qeios · doi:10.32388/5k6umy · Cited by 3
Farhadi, A. (2025) · Current Psychology · doi:10.1007/s12144-025-08072-8 · Cited by 1
The Trembling Hand Unraveled: Motor Dynamics and Choice Inconsistency
Kurtz-David, V., Madar, A., Hakim, A., Palmon, N., & Levy, D. J. (2025) · Journal of Neuroscience · doi:10.1523/jneurosci.1312-24.2025 · Cited by 1
Switching the motor response weakens confidence serial dependence
Bocheva, M., & Rahnev, D. (2025) · Psychonomic Bulletin & Review · doi:10.3758/s13423-025-02748-9 · Cited by 3
Leroy, É., Koun, É., & Thura, D. (2025) · Experimental Brain Research · doi:10.1007/s00221-025-07148-y · Cited by 1
The validity and consistency of continuous joystick response in perceptual decision-makingPreprint
Szul, M. J., Bompas, A., Sumner, P., & Zhang, J. (2018) · bioRxiv (Cold Spring Harbor Laboratory) · doi:10.1101/501536 · Cited by 1
The influence of movement-related costs when searching to act and acting to searchPreprint
Moskowitz, J. B., Berger, S. A., Castelhano, M. S., Gallivan, J. P., & Flanagan, J. R. (2022) · bioRxiv (Cold Spring Harbor Laboratory) · doi:10.1101/2022.03.01.482521 · Cited by 1
Changes of mind and absolute evidencePreprint
Turner, W., Feuerriegel, D., Andrejević, M., Hester, R., & Bode, S. (2019) · PsyArXiv (OSF Preprints) · doi:10.31234/osf.io/aj4ht · Cited by 1
On the generalization of decision-making preferences in movement under risk
O’Brien, M. K. (2014) · CU Scholar (University of Colorado Boulder)
Motor effort and adaptive sampling in perceptual decision-makingPreprint
Zhu, T. (2019) · bioRxiv (Cold Spring Harbor Laboratory) · doi:10.1101/637017
Barany, D. A., Gómez-Granados, A., Schrayer, M., Cutts, S. A., & Singh, T. (2019) · bioRxiv (Cold Spring Harbor Laboratory) · doi:10.1101/821074
Löffler, A., Sylaidi, A., Fountas, Z., & Haggard, P. (2019) · bioRxiv (Cold Spring Harbor Laboratory) · doi:10.1101/841882
Turner, W., Feuerriegel, D., Hester, R., & Bode, S. (2020) · doi:10.31234/osf.io/q3ds6
CT scan in a study of the normal anatomy of the hindfoot and midfoot.
Neri, M., & Querin, F. (1989) · PubMed
Impact of decision and action outcomes on subsequent decision and action behaviorsPreprint
Saleri, C., Thura, D., & Reynaud, A. J. (2022) · bioRxiv (Cold Spring Harbor Laboratory) · doi:10.1101/2022.01.24.477509
Turner, W., Feuerriegel, D., Hester, R., & Bode, S. (2020) · bioRxiv (Cold Spring Harbor Laboratory) · doi:10.1101/2020.11.26.400630
Faculty Opinions recommendation of Decision-making in sensorimotor control.
Scott, S. H. (2018) · Faculty Opinions – Post-Publication Peer Review of the Biomedical Literature · doi:10.3410/f.733787370.793550091
Faculty Opinions recommendation of Perceptual decisions are biased by the cost to act.
Shadmehr, R. (2018) · Faculty Opinions – Post-Publication Peer Review of the Biomedical Literature · doi:10.3410/f.727327868.793549320
Decision-Making During Ongoing Actions
Ulbrich, P. (2022) · eDiss (Georg-August-Universität Göttingen) · doi:10.53846/goediss-9312
Abrupt, but not gradual, motor adaptation biases saccadic target selection
Teunissen, L., Selen, L. P. J., & Medendorp, W. P. (2023) · Journal of Neurophysiology · doi:10.1152/jn.00223.2022
Metadata
- Authors
- Burk, D., Ingram, J. N., Franklin, D. W., Shadlen, M. N., & Wolpert, D. M.
- Affiliations
- National Institute on Drug Abuse (US)
- University of Cambridge (GB)
- Howard Hughes Medical Institute (US)
- Corresponding author
- Wolpert, Daniel M.
- Venue
- PLoS ONE
- Publisher
- Public Library of Science (PLoS)
- Published
- 2014-03-20
- Volume
- 9
- Issue
- 3
- Pages
- e92681
- ISSN
- 1932-6203 (ISSN-L)
- PMC
- PMC3961398
- OpenAlex
- W1981476255
- Cited by
- 117
- References
- 30
- Citations by year
- 2026: 6 · 2025: 15 · 2024: 14 · 2023: 9 · 2022: 13 · 2021: 13 · 2020: 9 · 2019: 11 · 2018: 7 · 2017: 6 · 2016: 5 · 2015: 6 · 2014: 2
- FWCI
- 3.50
- Type
- journal article
- Language
- en
- Open access
- gold
- doi.org
- Locations
- PLoS ONE (publishedVersion, cc-by)
- Europe PMC (PubMed Central) (publishedVersion, cc-by)
- PubMed Central (publishedVersion, cc-by)
- PubMed (publishedVersion)
- RePEc: Research Papers in Economics (submittedVersion)
- DOAJ (DOAJ: Directory of Open Access Journals) (submittedVersion, cc-by-sa)
- Cambridge University Engineering Department Publications Database (submittedVersion)
- Columbia Academic Commons (Columbia University)
- Funders
- Howard Hughes Medical Institute
- Wellcome Trust (097803, 097803/Z/11/Z)
- National Institutes of Health
- National Eye Institute (R01EY011378)
- Topics
- Life Sciences › Neuroscience › Cognitive Neuroscience › Motor Control and Adaptation
- Life Sciences › Neuroscience › Cognitive Neuroscience › Neural and Behavioral Psychology Studies
- Social Sciences › Arts and Humanities › Philosophy › Free Will and Agency
- Keywords
- change of mind, sensorimotor decision making, motor effort, evidence accumulation, reaching movements, force fields, target geometry, energetic cost, decision revision
- MeSH terms
- Adult, Choice Behavior, Decision Making, Female, Humans, Male, Psychometrics, Psychomotor Performance, Young Adult
About these checks
Registry, retraction, Cites and statistics results are computed, not judged, with one exception: a printed reference that no index lists is read once by a model before it counts as a citation error. Claims are extracted by a model and kept only when their quote appears verbatim in the text; each cited source is then checked, with a model’s help, for whether it says what the claim relies on. Those verdicts can be wrong — read the claim’s quote and the cited source before relying on one.
Statistics and arithmetic are recomputed, not judged.
Confidence bands are shown only for fields calibrated on our annotated test set. None is calibrated yet, so no band is shown.
What counts as a claim ›How we measure confidence ›How we check this ›
Are you an author, or do you see a problem with this page? Request a review
