

The DOI matches its Crossref record; 55 of the 56 references it cites were found in a registry or an index.
Biotic and Abiotic Properties Mediating Plant Diversity Effects on Soil Microbial Communities in an Experimental Grassland
Open accessAbstract
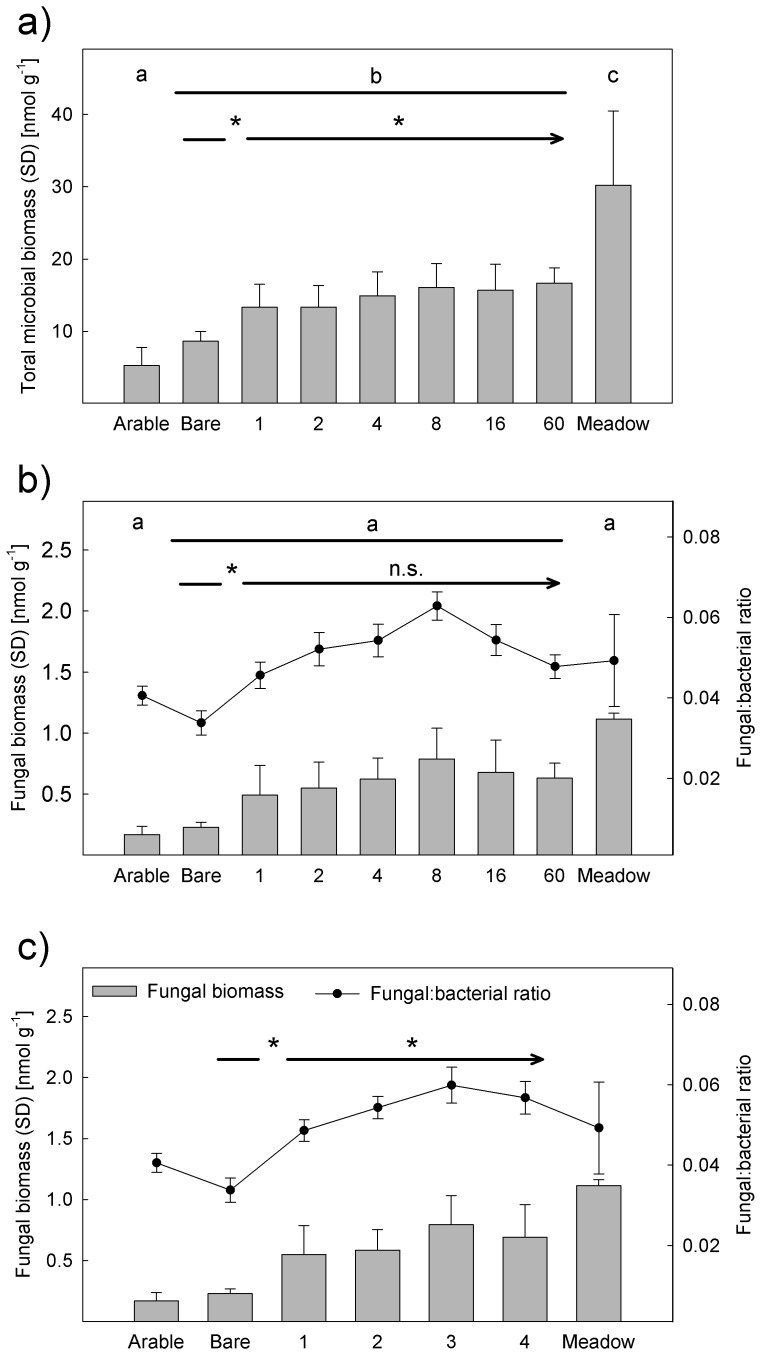
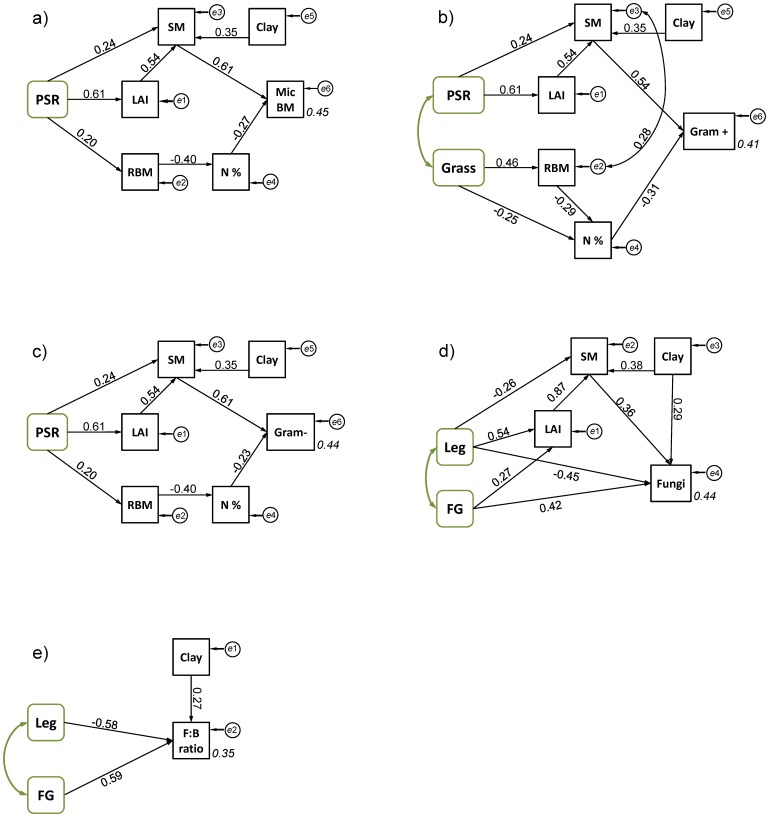
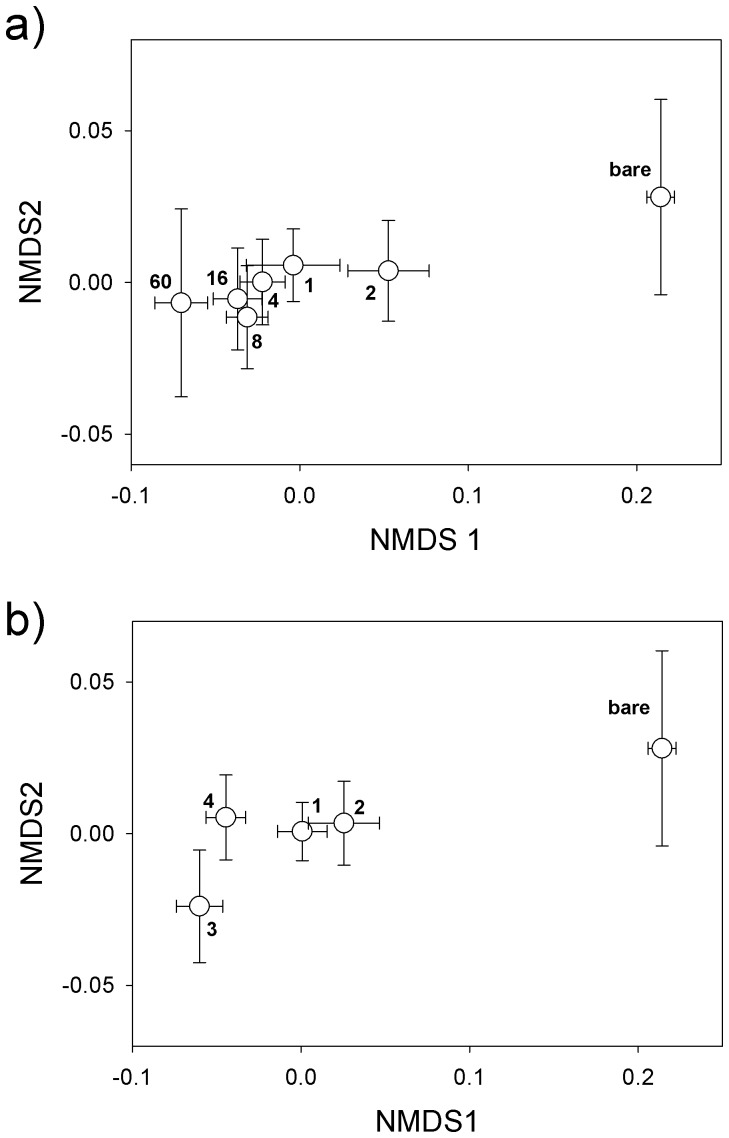
Plant diversity drives changes in the soil microbial community which may result in alterations in ecosystem functions. However, the governing factors between the composition of soil microbial communities and plant diversity are not well understood. We investigated the impact of plant diversity (plant species richness and functional group richness) and plant functional group identity on soil microbial biomass and soil microbial community structure in experimental grassland ecosystems. Total microbial biomass and community structure were determined by phospholipid fatty acid (PLFA) analysis. The diversity gradient covered 1, 2, 4, 8, 16 and 60 plant species and 1, 2, 3 and 4 plant functional groups (grasses, legumes, small herbs and tall herbs). In May 2007, soil samples were taken from experimental plots and from nearby fields and meadows. Beside soil texture, plant species richness was the main driver of soil microbial biomass. Structural equation modeling revealed that the positive plant diversity effect was mainly mediated by higher leaf area index resulting in higher soil moisture in the top soil layer. The fungal-to-bacterial biomass ratio was positively affected by plant functional group richness and negatively by the presence of legumes. Bacteria were more closely related to abiotic differences caused by plant diversity, while fungi were more affected by plant-derived organic matter inputs. We found diverse plant communities promoted faster transition of soil microbial communities typical for arable land towards grassland communities. Although some mechanisms underlying the plant diversity effect on soil microorganisms could be identified, future studies have to determine plant traits shaping soil microbial community structure. We suspect differences in root traits among different plant communities, such as root turnover rates and chemical composition of root exudates, to structure soil microbial communities.
Overview
The claims and statistics of this paper haven’t been checked yet.
Run the check — free, no account needed. It reads the open-access text and checks the sources it cites.
Integrity signals
Registry
Cites
Statistics
Figures
Verification
Claims the paper makes
The claims and statistics of this paper haven’t been checked yet.
Run the check — free, no account needed. It reads the open-access text and checks the sources it cites.
Claims other papers make about this one
Each is checked against this paper’s own text: does it say what the citing paper says it does?
In the citing paper
“First, a denser vegetation in highly diverse plant communities reduces evaporation from the topsoil, which in turn promotes higher soil microbial activity and growth 30 .”
From Plant diversity increases soil microbial activity and soil carbon storage (2015) · cites this paper as [30]
Self-check
Percentages, sums and reported differences re-computed from the paper’s own numbers.
The self-check needs the paper’s full text.
Citations
Cites
R: A Language and Environment for Statistical Computing
R Core Team (2000) · doi:10.32614/r.manuals · Cited by 355,893
A RAPID METHOD OF TOTAL LIPID EXTRACTION AND PURIFICATION
Bligh, E. G., & Dyer, W. J. (1959) · Canadian Journal of Biochemistry and Physiology · doi:10.1139/o59-099 · Cited by 54,751 · cited 1×
“4) to extract soil lipids [29,36].”
Biodiversity loss and its impact on humanity
Cardinale, B. J., Duffy, J. E., Gonzalez, A., Hooper, D. U., Perrings, C., Venail, P., Narwani, A., Mace, G. M., Tilman, D., Wardle, D. A., et al. (2012) · Nature · doi:10.1038/nature11148 · Cited by 7,457 · cited 1×
“but the underlying mechanisms are not well understood [18]; for”
BackgroundVan Der Heijden, M. G. A., Bardgett, R. D., & Van Straalen, N. M. (2008) · Ecology Letters · doi:10.1111/j.1461-0248.2007.01139.x · Cited by 5,053
THE ROLE OF ROOT EXUDATES IN RHIZOSPHERE INTERACTIONS WITH PLANTS AND OTHER ORGANISMS
Bais, H. P., Weir, T. L., Perry, L. G., Gilroy, S., & Vivanco, J. M. (2006) · Annual Review of Plant Biology · doi:10.1146/annurev.arplant.57.032905.105159 · Cited by 4,682 · cited 1×
“Indeed, root exudates were reported to strongly influence soil microbial communities [14,55].”
BackgroundThe use of phospholipid fatty acid analysis to estimate bacterial and fungal biomass in soil
Frosteg�rd, A., & B��th, E. (1996) · Biology and Fertility of Soils · doi:10.1007/bf00384433 · Cited by 2,543 · cited 1×
“The F:B ratio was calculated using the molar weight of the fungal PLFA marker divided by the sum of molar weights of bacterial PLFA biomarker [40].”
MethodStructural Equation Modeling and Natural Systems
Grace, J. B. (2006) · doi:10.1017/cbo9780511617799 · Cited by 2,432 · cited 7×
“The adequacy of the model was tested with Chi-squared tests (x2 tests) and root mean square error of approximation (RMSEA) [44].”
MethodInfluentialZelles, L. (1999) · Biology and Fertility of Soils · doi:10.1007/s003740050533 · Cited by 2,059 · cited 2×
“PLFA 18:2v6 was used as a fungal biomarker [38,39].”
BackgroundMethodFrostegård, Å., Bååth, E., & Tunlio, A. (1993) · Soil Biology and Biochemistry · doi:10.1016/0038-0717(93)90113-p · Cited by 1,442 · cited 1×
“PLFA 18:2v6 was used as a fungal biomarker [38,39].”
MethodVegetation Ecology of Central Europe
Ellenberg, H. (1988) · Medical Entomology and Zoology · Cited by 1,374
Cited by
Sorted by citations
Plant diversity increases soil microbial activity and soil carbon storage
Lange, M., Eisenhauer, N., Sierra, C. A., Bessler, H., Engels, C., Griffiths, R. I., Mellado-Vázquez, P. G., Malik, A. A., Roy, J., Scheu, S., et al. (2015) · Nature Communications · doi:10.1038/ncomms7707 · Cited by 1,742
“…unidentified mechanisms, as suggested by the direct relation in the path model (Fig. of processes influence microbial activity: First, a denser vegetation in highly diverse plant communities reduces evaporation from the topsoil, which in turn promotes higher soil microbial activity and growth 30 .”
Self-citationPrommer, J., Walker, T. W. N., Wanek, W., Braun, J., Zezula, D., Hu, Y., Hofhansl, F., & Richter, A. A. (2019) · Global Change Biology · doi:10.1111/gcb.14777 · Cited by 658
Root biomass and exudates link plant diversity with soil bacterial and fungal biomass
Eisenhauer, N., Lanoue, A., Strecker, T., Scheu, S., Steinauer, K., Thakur, M. P., & Mommer, L. (2017) · Scientific Reports · doi:10.1038/srep44641 · Cited by 539
“Microcosms received the same amount of water because variations in soil water content may co-determine plant diversity effects on soil microorganisms 24 .”
Self-citationWeisser, W. W., Roscher, C., Meyer, S. T., Ebeling, A., Luo, G., Allan, E., Beßler, H., Barnard, R. L., Buchmann, N., Buscot, F., et al. (2017) · Basic and Applied Ecology · doi:10.1016/j.baae.2017.06.002 · Cited by 517
“Structural equation modelling revealed that plant species richness impacts the soil microbial community not only by changes in the availability of organic resources but also via changes in abiotic factors, such as soil water content (Lange et al. 2014).”
BackgroundSelf-citationSoil Fungal:Bacterial Ratios Are Linked to Altered Carbon Cycling
Malik, A. A., Chowdhury, S. P., Schlager, V., Oliver, A., Puissant, J., Mellado-Vázquez, P. G., Jehmlich, N., von Bergen�, M., Griffiths, R. I., & Gleixner, G. (2016) · Frontiers in Microbiology · doi:10.3389/fmicb.2016.01247 · Cited by 483
“It is likely that the higher plant species diversity caused higher F:B ratio of the microbial community due to ecological complementarity effects such as higher and diverse supply of resources for microorganisms (Lange et al., 2014).”
BackgroundMethodInfluentialSelf-citationMeta-analysis shows positive effects of plant diversity on microbial biomass and respiration
Chen, C., Chen, H. Y. H., Chen, X., & Huang, Z. (2019) · Nature Communications · doi:10.1038/s41467-019-09258-y · Cited by 472
Willers, C., van Rensburg, P. J., & Claassens, S. (2015) · Journal of Applied Microbiology · doi:10.1111/jam.12902 · Cited by 428
“Nevertheless, this approach remains widely applied for the estimation of microbial biomass in current environmental studies (Cyco n et al. 2013; Fichtner et al. 2014; Lange et al. 2014; Sasaki et al. 2014; Garc ıa-Orenes et al. 2015).”
BackgroundVukicevich, E., Lowery, T., Bowen, P. A., Úrbez-Torres, J. R., & Hart, M. M. (2016) · Agronomy for Sustainable Development · doi:10.1007/s13593-016-0385-7 · Cited by 454
“Although plant cover and, thus, soil moisture can be an important driver of a soil microbial community (Lange et al. 2014), more work needs to be done to elucidate this effect on crop decline outcomes as some pathogens also benefit from increased soil moisture (Pieczarka and Abawi 1978; Kuan and Erwin 1982).”
InfluentialDassen, S., Cortois, R., Martens, H., de Hollander, M., Kowalchuk, G. A., van der Putten, W. H., & Deyn, G. B. D. (2017) · Molecular Ecology · doi:10.1111/mec.14175 · Cited by 272
“For example, the presence of legumes generally decreased the biomass of soil fungi (BarteltRyser, Joshi, Schmid, Brandl, & Balser, 2005; Lange et al., 2014), small herbs increased total soil microbial biomass, and tall herbs and grasses did not change microbial biomass (Strecker et al., 2015).”
BackgroundInfluentialSoil pH and nutrients shape the vertical distribution of microbial communities in an alpine wetland
Kang, E., Li, Y., Zhang, X., Yan, Z., Wu, H., Li, M., Yan, L., Zhang, K., Wang, J., & Kang, X. (2021) · The Science of The Total Environment · doi:10.1016/j.scitotenv.2021.145780 · Cited by 245
Ecological role of bacterial inoculants and their potential impact on soil microbial diversity
Ambrosini, A., de Souza, R., & Passaglia, L. M. P. (2015) · Plant and Soil · doi:10.1007/s11104-015-2727-7 · Cited by 199
Thakur, M. P., Milcu, A., Manning, P., Niklaus, P. A., Roscher, C., Power, S. A., Reich, P. B., Scheu, S., Tilman, D. G., Ai, F., et al. (2015) · Global Change Biology · doi:10.1111/gcb.13011 · Cited by 203
Self-citation“Omics” Insights into PAH Degradation toward Improved Green Remediation Biotechnologies
Amrani, A. E., Dumas, A.-S., Wick, L. Y., Yergeau, É., & Berthomé, R. (2015) · Environmental Science & Technology · doi:10.1021/acs.est.5b01740 · Cited by 163
Positive Effects of Crop Diversity on Productivity Driven by Changes in Soil Microbial Composition
Stefan, L., Hartmann, M., Engbersen, N., Six, J., & Schöb, C. (2021) · Frontiers in Microbiology · doi:10.3389/fmicb.2021.660749 · Cited by 165
Effects of tree identity dominate over tree diversity on the soil microbial community structure
Scheibe, A., Steffens, C., Seven, J., Jacob, A., Hertel, D., Leuschner, C., & Gleixner, G. (2014) · Soil Biology and Biochemistry · doi:10.1016/j.soilbio.2014.11.020 · Cited by 128
Self-citationEcosystem scale trade-off in nitrogen acquisition pathways
Deng, M., Liu, L., Jiang, L., Liu, W., Wang, X., Li, S., Yang, S., & Wang, B. (2018) · Nature Ecology & Evolution · doi:10.1038/s41559-018-0677-1 · Cited by 131
Fischer, C., Leimer, S., Roscher, C., Ravenek, J. M., de Kroon, H., Kreutziger, Y., Baade, J., Beßler, H., Eisenhauer, N., Weigelt, A., et al. (2018) · Journal of Ecology · doi:10.1111/1365-2745.13046 · Cited by 127
“…group assembly, influences soil functions such as soil microbial biomass and activity (Drenovsky, Vo, Graham, & Scow, 2004; Eisenhauer et al., 2010; Lange et al., 2014; Zak, Holmes, White, Peacock, & Tilman, 2003), soil fauna (Eisenhauer et al., 2011), and soil organic matter dynamics (Lange,…”
BackgroundSelf-citationLange, M., Eisenhauer, N., Chen, H., & Gleixner, G. (2023) · Global Change Biology · doi:10.1111/gcb.16641 · Cited by 122
“Plant- derived C inputs fuel the soil microbial community, with higher plant diversity leading to a more abundant, more diverse, and more active microbial community (Eisenhauer et al., 2010; Lange et al., 2014; Lange et al., 2015; Zak et al., 2003).”
BackgroundSelf-citationFahey, C., Koyama, A., Antunes, P. M., Dunfield, K. E., & Flory, S. L. (2020) · The ISME Journal · doi:10.1038/s41396-020-0614-6 · Cited by 117
Gillespie, L. M., Hättenschwiler, S., Milcu, A., Wambsganss, J., Shihan, A., & Fromin, N. (2021) · Functional Ecology · doi:10.1111/1365-2435.13877 · Cited by 115
Plant Phenotypic Traits Eventually Shape Its Microbiota: A Common Garden Test
Li, Y., Wu, X., Chen, T., Wang, W., Liu, G., Zhang, W., Li, S.-W., Wang, M., Zhao, C., Zhou, H., et al. (2018) · Frontiers in Microbiology · doi:10.3389/fmicb.2018.02479 · Cited by 114
Temperature Driven Membrane Lipid Adaptation in Glacial Psychrophilic Bacteria
Hassan, N., Anesio, A. M., Rafiq, M., Holtvoeth, J., Bull, I. D., Haleem, A., Shah, A. A., & Hasan, F. (2020) · Frontiers in Microbiology · doi:10.3389/fmicb.2020.00824 · Cited by 108
Xu, S. N., Eisenhauer, N., Ferlian, O., Zhang, J., Zhou, G., Lu, X., Liu, C., & Zhang, D. (2020) · Proceedings of the Royal Society B Biological Sciences · doi:10.1098/rspb.2020.2063 · Cited by 106
“In addition to biotic effects, beneficial abiotic environments in diverse plant communities, such as higher soil moisture and neutral soil pH, can contribute to explaining the positive relationship between plant diversity and soil C storage [40,41].”
BackgroundSelf-citationIntercropping enhances microbial community diversity and ecosystem functioning in maize fields
Xiao, X., Han, L., Chen, H., Wang, J., Zhang, Y., & Hu, A. (2023) · Frontiers in Microbiology · doi:10.3389/fmicb.2022.1084452 · Cited by 100
Liang, C. C., Kao‐Kniffin, J., Sanford, G. R., Wickings, K. G., Balser, T. C., & Jackson, R. D. (2016) · Soil Biology and Biochemistry · doi:10.1016/j.soilbio.2016.08.002 · Cited by 98
“Themechanisms underpinning processes such as soil C stabilization, especially in relation to above-ground plant diversity, are not well understood (Wardle et al., 2004; Kielak et al., 2008; Cardinale et al., 2012; Lange et al., 2014).”
BackgroundMellado-Vázquez, P. G., Lange, M., Bachmann, D., Gockele, A., Karlowsky, S., Milcu, A., Piel, C., Roscher, C., Roy, J., & Gleixner, G. (2015) · Soil Biology and Biochemistry · doi:10.1016/j.soilbio.2015.11.012 · Cited by 97
Self-citationYao, X., Zhang, N., Zeng, H., & Wang, W. (2018) · The Science of The Total Environment · doi:10.1016/j.scitotenv.2018.02.155 · Cited by 94
Drought stress induced increase of fungi:bacteria ratio in a poplar plantation
Sun, Y., Chen, H. Y. H., Jin, L., Wang, C., Zhang, R., Ruan, H., & Yang, J. (2020) · CATENA · doi:10.1016/j.catena.2020.104607 · Cited by 94
Fujii, S., Mori, A., Koide, D., Makoto, K., Matsuoka, S., Osono, T., & Isbell, F. (2016) · Journal of Applied Ecology · doi:10.1111/1365-2664.12733 · Cited by 91
Cortois, R., Veen, G. F., Duyts, H., Abbas, M., Strecker, T., Kostenko, O., Eisenhauer, N., Scheu, S., Gleixner, G., Deyn, G. B. D., et al. (2017) · Ecosphere · doi:10.1002/ecs2.1719 · Cited by 89
“…from the Jena Experiment, effects of plant biomass (resource quantity) and plant species identity or diversity (resource quality) have been considered separately as potential drivers of abundance and composition of plant-associated communities of soil biota (De Deyn et al. 2004, Lange et al. 2014).”
BackgroundSelf-citationLiu, Y., Miao, H., Chang, X., & Wu, G. (2019) · Land Degradation and Development · doi:10.1002/ldr.3349 · Cited by 86
“The positive effect of PSD on microbial communities is primarily the result of improved microclimatic conditions (Lange et al., 2014).”
BackgroundHarnessing microbial multitrophic interactions for rhizosphere microbiome engineering
Afridi, M. S., Fakhar, A. Z., Kumar, A., Ali, S., de Medeiros, F. H. V., Muneer, M. A., Ali, H., & Saleem, M. (2022) · Microbiological Research · doi:10.1016/j.micres.2022.127199 · Cited by 89
Deltedesco, E., Keiblinger, K. M., Piepho, H., Antonielli, L., Pötsch, E. M., Zechmeister‐Boltenstern, S., & Gorfer, M. (2020) · Soil Biology and Biochemistry · doi:10.1016/j.soilbio.2020.107704 · Cited by 86
Kompała‐Bąba, A., Bierza, W., Sierka, E. M., Błońska, A., Besenyei, L., & Woźniak, G. (2021) · Scientific Reports · doi:10.1038/s41598-021-84673-0 · Cited by 85
Dietrich, P., Cesarz, S., Liu, T., Roscher, C., & Eisenhauer, N. (2021) · Oecologia · doi:10.1007/s00442-021-04956-1 · Cited by 79
Self-citationThakur, M. P., Tilman, D. G., Purschke, O., Ciobanu, M., Cowles, J., Isbell, F. I., Wragg, P. D., & Eisenhauer, N. (2017) · Science Advances · doi:10.1126/sciadv.1700866 · Cited by 79
“Water stress is also likely to becomemore pronounced in plant monocultures where a sparse vegetation (due to lower plant cover) is unable to reduce evaporation from the soil surface (41, 42).”
BackgroundSelf-citationXiao, W., Chen, H. Y. H., Kumar, P., Chen, C., & Guan, Q. (2019) · Geoderma · doi:10.1016/j.geoderma.2019.01.045 · Cited by 78
Han, W., Wang, G., Liu, J., & Ni, J. (2020) · Applied Soil Ecology · doi:10.1016/j.apsoil.2020.103813 · Cited by 76
Xi-mei, Z., Johnston, E. R., Barberán, A., Ren, Y., Lü, X., & Han, X. (2017) · Global Change Biology · doi:10.1111/gcb.13783 · Cited by 72
Intensifying rotations increases soil carbon, fungi, and aggregation in semi-arid agroecosystems
Rosenzweig, S. T., Fonte, S. J., & Schipanski, M. E. (2018) · Agriculture Ecosystems & Environment · doi:10.1016/j.agee.2018.01.016 · Cited by 74
“Additionally, cropping system intensification is often achieved by growing a greater diversity of crops, and previous studies have linked crop diversity to higher fungi:bacteria ratios and microbial biomass (Lange et al., 2014; McDaniel et al., 2014).”
BackgroundLatz, E., Eisenhauer, N., Rall, B. C., Scheu, S., & Jousset, A. (2016) · Scientific Reports · doi:10.1038/srep23584 · Cited by 74
Self-citationKhalmuratova, I., Kim, H., Nam, Y.-J., Oh, Y., Jeong, M., Choi, H.-R., You, Y.-H., Choo, Y., Lee, I., Shin, J. H., et al. (2015) · Mycobiology · doi:10.5941/myco.2015.43.4.373 · Cited by 71
“Soil microbes are directly connected to the productivity and diversity of plants [3].”
BackgroundSendek, A., Karakoç, C., Wagg, C., Domínguez‐Begines, J., Couto, G. M., van der Heijden, M. G. A., Naz, A. A., Lochner, A., Chatzinotas, A., Klotz, S., et al. (2019) · Scientific Reports · doi:10.1038/s41598-019-45702-1 · Cited by 72
Self-citationLatz, E., Eisenhauer, N., Scheu, S., & Jousset, A. (2015) · Functional Ecology · doi:10.1111/1365-2435.12417 · Cited by 74
Self-citationEarly accumulation of active fraction soil carbon in newly established cellulosic biofuel systems
Sprunger, C. D., & Philip Robertson, G. (2018) · Geoderma · doi:10.1016/j.geoderma.2017.11.040 · Cited by 71
“Plant diversity can also enhance soil C accumulation: grassland communities with increased diversity have been found to sequester up to five-fold more C compared to monocultures of the same species (Steinbeiss et al., 2008; Fornara and Tilman, 2008; Lange et al., 2014).”
BackgroundLozano, Y. M., Armas, C., Hortal, S., Casanoves, F., & Pugnaire, F. I. (2017) · New Phytologist · doi:10.1111/nph.14499 · Cited by 68
Linkages of plant-soil feedbacks and underlying invasion mechanisms
Inderjit, I., & Cahill, J. F. (2015) · AoB Plants · doi:10.1093/aobpla/plv022 · Cited by 63
“…and Cipollini 2012), soil fertility and heterogeneity AoB PLANTS www.aobplants.oxfordjournals.org & The Authors 2015 5 (Heather and Haubensak 2008), plant species and soil conditioning (Harrison and Bardgett 2010), root exudates (Lange et al. 2014) and soil community density (Aguilera 2011).”
Bandowe, B. A. M., Leimer, S., Meusel, H., Velescu, A., Dassen, S., Eisenhauer, N., Hoffmann, T., Oelmann, Y., & Wilcke, W. (2018) · Soil Biology and Biochemistry · doi:10.1016/j.soilbio.2018.10.017 · Cited by 63
Self-citationHow plant diversity impacts the coupled water, nutrient and carbon cycles
Lange, M., Koller-France, E., Hildebrandt, A., Oelmann, Y., Wilcke, W., & Gleixner, G. (2019) · Advances in ecological research/Advances in Ecological Research · doi:10.1016/bs.aecr.2019.06.005 · Cited by 65
Self-citationMalik, A. A., Dannert, H., Griffiths, R. I., Thomson, B. C., & Gleixner, G. (2015) · Frontiers in Microbiology · doi:10.3389/fmicb.2015.00268 · Cited by 61
“Soil was collected from the Jena Biodiversity Experiment site located in Jena, Germany in September 2012 from an arable field (Roscher et al., 2004; Lange et al., 2014).”
MethodSelf-citationSchmid, M. W., Hahl, T., van Moorsel, S. J., Wagg, C., Deyn, G. B. D., & Schmid, B. (2018) · Molecular Ecology · doi:10.1111/mec.14987 · Cited by 65
Wagner, D., Eisenhauer, N., & Cesarz, S. (2015) · Soil Biology and Biochemistry · doi:10.1016/j.soilbio.2015.07.001 · Cited by 62
“whereas gram-positive bacteria and fungi are more affected by organic substances, which are produced by plants (Lange et al., 2014).”
BackgroundInfluentialSelf-citationPlant diversity enhances production and downward transport of biodegradable dissolved organic matter
Lange, M., Roth, V.-N., Eisenhauer, N., Roscher, C., Dittmar, T., Fischer, C., Macé, O. G., Hildebrandt, A., Milcu, A., Mommer, L., et al. (2020) · Journal of Ecology · doi:10.1111/1365-2745.13556 · Cited by 63
“At the same time, soil microbial community composition and metabolic activity are strongly influenced by plant diversity (Zak et al. 2003; Eisenhauer et al. 2010; Lange et al. 2014; Schmid et al. 2019).”
BackgroundSelf-citationFinkel, P. D. L., Carrizo, D., Parro, V., & Sánchez‐García, L. (2023) · Astrobiology · doi:10.1089/ast.2022.0083 · Cited by 61
“…of green sulfur bacteria (Kenyon and Gray, 1974), both have also been non-specifically designated to Gram-negative bacteria (Wilkinson and Ratledge, 1988; Lange et al., 2014) or anaerobic bacteria (Vestal and White, 1989; Dong et al., 2014), including SRB (Fang et al., 2006; Li et al., 2011).”
BackgroundStrecker, T., Barnard, R. L., Niklaus, P. A., Scherer‐Lorenzen, M., Weigelt, A., Scheu, S., & Eisenhauer, N. (2015) · PLoS ONE · doi:10.1371/journal.pone.0125678 · Cited by 59
“The significant correlation between soil water content and plant species richness as well as the weaker plant species richness effect when fitted after soil water content suggests that effects of plant diversity on soil microbial respiration and biomass are mediated, at least in part, by changes in soil water content…”
BackgroundSelf-citationChen, X., Zhao, X., Lin, Q., Li, G., & Kong, W. (2018) · The Science of The Total Environment · doi:10.1016/j.scitotenv.2018.12.126 · Cited by 57
Plant mixture effects on carbon-degrading enzymes promote soil organic carbon accumulation
Zhang, B., Cai, Y., Hu, S., & Chang, S. X. (2021) · Soil Biology and Biochemistry · doi:10.1016/j.soilbio.2021.108457 · Cited by 59
Song, Y., Song, C., Shi, F., Wang, M., Ren, J., Wang, X., & Jiang, L. (2019) · Applied Soil Ecology · doi:10.1016/j.apsoil.2019.04.019 · Cited by 58
Acute effects of PAH contamination on microbial community of different forest soils
Picariello, E., Baldantoni, D., & Nicola, F. D. (2020) · Environmental Pollution · doi:10.1016/j.envpol.2020.114378 · Cited by 55
Effects of xeric shrubs on soil microbial communities in a desert in northern China
Sun, Y., Zhang, Y., Feng, W., Qin, S., Liu, Z., Bai, Y., Yan, R., & Fa, K. (2016) · Plant and Soil · doi:10.1007/s11104-016-3111-y · Cited by 50
“Previous studies concerning the effects of plant diversity on soil microbial communities showed that increased plant species diversity had significant direct effects on soil microbial biomass and community structure (Zak et al. 2003; Lamb et al. 2011; Lange et al. 2014).”
BackgroundHolland, T., Bowen, P. A., Bogdanoff, C. P., Lowery, T. D., Shaposhnikova, O., Smith, S. A., & Hart, M. M. (2015) · Applied Soil Ecology · doi:10.1016/j.apsoil.2015.12.001 · Cited by 50
Leloup, J., Baude, M., Nunan, N., Mériguet, J., Dajoz, I., Roux, X. L., & Raynaud, X. (2017) · Geoderma · doi:10.1016/j.geoderma.2017.12.018 · Cited by 48
“…and, therefore, plant diversity may be a major factor determining the community structures, abundances and activities of soil microorganisms involved in C and N cycling (Carney and Matson, 2006; Kowalchuk et al., 2002; Lange et al., 2014; Schlatter et al., 2015; Thompson and Kao-Kniffin, 2016).”
BackgroundSünnemann, M., Alt, C., Kostin, J. E., Lochner, A., Reitz, T., Siebert, J., Schädler, M., & Eisenhauer, N. (2021) · Journal of Applied Ecology · doi:10.1111/1365-2664.14004 · Cited by 49
Self-citationAngst, Š., Angst, G., Mueller, K. E., Lange, M., & Eisenhauer, N. (2025) · Nature Communications · doi:10.1038/s41467-025-60712-6 · Cited by 50
“…also stabilize microenvironmental conditions: higher levels of shade by plant cover may result in a more uniform water distribution in the topsoil 86,122 , increased soil porosity may improve drainage 33 , or soil temperatures may be more constant due to elevated canopy shade and/or reduced soil…”
Self-citationLi, Q., Ang, S., Yang, H., & Müller, W. E. G. (2021) · Frontiers in Microbiology · doi:10.3389/fmicb.2021.636405 · Cited by 51
Plant diversity improves resistance of plant biomass and soil microbial communities to drought
Li, Y., Wang, J., Shen, C., Wang, J., Singh, B. K., & Ge, Y. (2022) · Journal of Ecology · doi:10.1111/1365-2745.13900 · Cited by 49
“Therefore, the reduced water evaporation from topsoil owing to the denser vegetation in diverse plant communities could promote the soil microbial functions (Lange et al., 2014; Lange et al., 2015).”
BackgroundDing, K., Zhong, L., Xin, X., Xu, Z. H., Kang, X., Liu, W. J., Rui, Y., Jiang, L., Li, T., & Wang, Y. (2014) · Journal of Soils and Sediments · doi:10.1007/s11368-014-1016-z · Cited by 45
“However, our result was inconsistent with recent research works in Europe, revealing plant diversity (Lange et al. 2014).”
ResultA new experimental approach to test why biodiversity effects strengthen as ecosystems age
Vogel, A., Ebeling, A., Gleixner, G., Roscher, C., Scheu, S., Ciobanu, M., Koller-France, E., Lange, M., Lochner, A., Meyer, S. T., et al. (2019) · Advances in ecological research/Advances in Ecological Research · doi:10.1016/bs.aecr.2019.06.006 · Cited by 45
Self-citationKostin, J. E., Cesarz, S., Lochner, A., Schädler, M., Macdonald, C. A., & Eisenhauer, N. (2021) · Ecological Applications · doi:10.1002/eap.2325 · Cited by 45
“…higher plant species richness in these systems would have promoted microbial biomass and activity in the grasslands through increasing the quantity (Zak et al. 2003, Eisenhauer et al. 2010, Lange et al. 2014) and diversity of soil rhizodeposits (Lange et al. 2015, Eisenhauer et al. 2017).”
BackgroundSelf-citationA sustainable way of increasing productivity of coconut cultivation using cover crops: A review
Dissanayaka, D., Nuwarapaksha, T. D., Udumann, S. S., Dissanayake, D. K. R. P. L., & Atapattu, A. J. (2022) · Circular Agricultural Systems · doi:10.48130/cas-2022-0007 · Cited by 41
Lakshmanan, V., Ray, P., & Craven, K. D. (2017) · Methods in molecular biology · doi:10.1007/978-1-4939-7136-7_4 · Cited by 41
Hennecke, J., Bassi, L., Mommer, L., Albracht, C., Bergmann, J., Eisenhauer, N., Guerra, C. A., Heintz‐Buschart, A., Kuyper, T. W., Lange, M., et al. (2023) · New Phytologist · doi:10.1111/nph.19261 · Cited by 41
“…two gradients of the RES, and we deliberately chose not to include other explaining biotic or abiotic variables, such as soil texture, nutrient content or plant functional group, for which the effect on fungal communities has been tested before (e.g. Lange et al ., 2014; Francioli et al ., 2021).”
BackgroundSelf-citationSong, X., Wang, L., Zhao, X., Liu, C., Chang, Q., Wang, Y., Xu, T., & Wang, D. (2017) · Soil Biology and Biochemistry · doi:10.1016/j.soilbio.2017.09.003 · Cited by 40
Wang, C., Michalet, R., Liu, Z., Jiang, X., Wang, X., Zhang, G., An, L., Chen, S., & Xiao, S. (2020) · Frontiers in Microbiology · doi:10.3389/fmicb.2020.00925 · Cited by 42
Vandeginste, V., Lim, C., & Ji, Y. (2024) · Minerals · doi:10.3390/min14010075 · Cited by 43
Silva, A. O., da Costa, A. M., Teixeira, A. F. D. S., Guimarães, A. A., dos Santos, J. V., & Moreira, F. M. D. S. (2018) · Ecological Indicators · doi:10.1016/j.ecolind.2018.04.073 · Cited by 41
Ribeiro, P. C. D., Menéndez, E., da Silva, D. L., Boniek, D., Ramírez-Bahena, M.-H., de Resende, M. A., Péix, Á., Velázquez, E., Mateos, P. F., & Scotti, M. R. (2016) · The Science of The Total Environment · doi:10.1016/j.scitotenv.2016.10.162 · Cited by 37
“Thus, the C:N ratio has longbeen considered an important tool to assess the soil fertility in both agricultural or natural ecosystems (Lange et al., 2014).”
MethodFu, G., & Shen, Z.-X. (2021) · The Science of The Total Environment · doi:10.1016/j.scitotenv.2021.152591 · Cited by 36
Zi, H., Hu, L., & Wang, C. (2022) · Frontiers in Plant Science · doi:10.3389/fpls.2022.829381 · Cited by 33
dos Santos, U. J., de Medeiros, É. V., Duda, G. P., Marques, M. C., de Souza, E. S., Brossard, M., & Hammecker, C. (2018) · Archives of Agronomy and Soil Science · doi:10.1080/03650340.2018.1523544 · Cited by 34
“Previous studies showed that plant diversity could affect the composition of the soil microbial community by the input and quality of residues (Lange et al. 2014; Couto et al. 2016).”
BackgroundInfluentialLama, S., Velescu, A., Leimer, S., Weigelt, A., Chen, H., Eisenhauer, N., Scheu, S., Oelmann, Y., & Wilcke, W. (2020) · Oecologia · doi:10.1007/s00442-020-04717-6 · Cited by 36
“On the contrary, the indirect path between species richness and microbial NH4 consumption rates via microbial biomass, which increased with species richness mainly because of increasing soil moisture (Lange et al. 2014) showed a positive relationship (Fig.”
BackgroundSelf-citationFungi are more sensitive than bacteria to drainage in the peatlands of the Zoige Plateau
Xue, D., Liu, T., Chen, H., Liu, J., Hu, J., & Liu, L. (2021) · Ecological Indicators · doi:10.1016/j.ecolind.2021.107367 · Cited by 34
Mellado-Vázquez, P. G., Lange, M., & Gleixner, G. (2018) · Biogeochemistry · doi:10.1007/s10533-018-0528-9 · Cited by 32
Self-citationChalmandrier, L., Pansu, J., Zinger, L., Boyer, F., Coissac, É., Génin, A., Gielly, L., Lavergne, S., Legay, N., Schilling, V., et al. (2019) · Ecography · doi:10.1111/ecog.04492 · Cited by 33
Guimarães‐Steinicke, C. R., Weigelt, A., Proulx, R., Lanners, T., Eisenhauer, N., Duque‐Lazo, J., Reu, B., Roscher, C., Wagg, C., Buchmann, N., et al. (2021) · Journal of Ecology · doi:10.1111/1365-2745.13631 · Cited by 34
“Such microclimatic effects of plant diversity can even cascade down to influencing soil microbial processes (Eisenhauer et al., 2010; Lange et al., 2014).”
BackgroundSelf-citationZhou, Z., Zhang, Y., & Zhang, F. (2022) · Plant and Soil · doi:10.1007/s11104-022-05525-y · Cited by 34
“Blastococcus produces surface active compounds that are potent biological emulsifiers that can be used for biodegradation and bioremediation of pesticides and other hydrocarbon pollutants in grasslands (Lange et al. 2014).”
BackgroundPivato, B., Bru, D., Busset, H., Deau, F., Matéjicek, A., Philippot, L., & Moreau, D. (2017) · Soil Biology and Biochemistry · doi:10.1016/j.soilbio.2017.06.018 · Cited by 31
“These results are in line with previous observations in grassland systems that plant species richness beneficially affected soil microbial communities with, for example, increased microbial basal respiration and C biomass (Eisenhauer et al., 2013; Lange et al., 2014; Strecker et al., 2015, 2016).”
ResultDietrich, P., Buchmann, T., Cesarz, S., Eisenhauer, N., & Roscher, C. (2017) · Plant and Soil · doi:10.1007/s11104-017-3328-4 · Cited by 32
“…between sown plant diversity and soil microbial activity (Spehn et al. 2000; Hedlund et al. 2003; Eisenhauer et al. 2010, 2013; Guenay et al. 2013; Lange et al. 2014, 2015), we did not find direct effects of plant species diversity on soil microbial activity in our linear mixed-effects models…”
BackgroundResultSelf-citationWu, S., Huang, B.-H., Gao, J., Wang, S., & Liao, P. (2019) · PeerJ · doi:10.7717/peerj.6147 · Cited by 31
Sokołowska, J., Józefowska, A., Woźnica, K., & Zaleski, T. (2020) · CATENA · doi:10.1016/j.catena.2020.104503 · Cited by 35
Niu, B., & Fu, G. (2023) · The Science of The Total Environment · doi:10.1016/j.scitotenv.2023.168878 · Cited by 30
Prediction of pasture yield using machine learning-based optical sensing: a systematic review
Stumpe, C., Leukel, J., & Zimpel, T. (2023) · Precision Agriculture · doi:10.1007/s11119-023-10079-9 · Cited by 31
“Another classification of input data is based on the dichotomy of biotic and abiotic factors affecting plant growth (Lange et al., 2014).”
Yang, J., Wang, Y., Cui, X., Xue, K., Zhang, Y., & Yu, Z. (2019) · Scientific Reports · doi:10.1038/s41598-019-55940-y · Cited by 30
Wang, X., Ge, Y., & Wang, J. (2017) · Journal of Plant Interactions · doi:10.1080/17429145.2017.1400123 · Cited by 29
“Plant diversity mainly affects the soil microbial function by changing the rhizodeposits and litter (Fanin et al. 2011; Lange et al. 2014, 2015), which may be mediated by species identity, biomass production and soil environments.”
BackgroundHoulihan, A. J., Conlin, P. L., & Chee‐Sanford, J. C. (2019) · PLoS ONE · doi:10.1371/journal.pone.0218104 · Cited by 28
Groundcover management changes grapevine root fungal communities and plant-soil feedback
Vukicevich, E., Lowery, D. T., Úrbez-Torres, J. R., Bowen, P. A., & Hart, M. M. (2018) · Plant and Soil · doi:10.1007/s11104-017-3532-2 · Cited by 27
“2014) as well as the plant community’s effect on soil moisture dynamics (Bezemer et al. 2006; Lange et al. 2014).”
BackgroundChen, X., Chen, H. Y. H., Chen, C., & Peng, S. (2019) · Soil Biology and Biochemistry · doi:10.1016/j.soilbio.2019.107634 · Cited by 27
Selection of endophytes as antagonists of Colletotrichum gloeosporioides in açaí palm
Peters, L. P., Prado, L. D. S., da Silva, F. Í. N., de Souza, F. S. C., & Carvalho, C. M. (2020) · Biological Control · doi:10.1016/j.biocontrol.2020.104350 · Cited by 26
Wan, X., Yu, Z., Wang, M., Zhang, Y., Lucas‐Borja, M. E., & Huang, Z. (2022) · Soil Biology and Biochemistry · doi:10.1016/j.soilbio.2022.108715 · Cited by 25
Sorkau, E., Boch, S., Boeddinghaus, R. S., Bonkowski, M., Fischer, M., Kandeler, E., Klaus, V. H., Kleinebecker, T., Marhan, S., Müller, J., et al. (2017) · Journal of Plant Nutrition and Soil Science · doi:10.1002/jpln.201700082 · Cited by 24
“Furthermore, a higher leaf area index associated with higher plant diversity resulted in 429 higher soil moisture in the top soil layer (Lange et al., 2014) favoring higher Pmic concentrations in soil 430 as was shown in our study.”
Self-citation
Metadata
- Authors
- Lange, M., Habekost, M., Eisenhauer, N., Roscher, C., Bessler, H., Engels, C., Oelmann, Y., Scheu, S., Wilcke, W., Schulze, E.-D., & Gleixner, G.
- Affiliations
- Max Planck Society (DE)
- Friedrich Schiller University Jena (DE)
- Helmholtz Centre for Environmental Research (DE)
- Humboldt-Universität zu Berlin (DE)
- University of Tübingen (DE)
- University of Göttingen (DE)
- University of Bern (CH)
- Corresponding author
- Gleixner, Gerd
- ORCID
- Venue
- PLoS ONE
- Publisher
- Public Library of Science (PLoS)
- Published
- 2014-05-09
- Volume
- 9
- Issue
- 5
- Pages
- e96182
- ISSN
- 1932-6203 (ISSN-L)
- PMC
- PMC4015938
- OpenAlex
- W2045806593
- Cited by
- 233
- References
- 56
- Citations by year
- 2026: 4 · 2025: 8 · 2024: 19 · 2023: 26 · 2022: 21 · 2021: 30 · 2020: 23 · 2019: 30 · 2018: 21 · 2017: 21 · 2016: 10 · 2015: 16 · 2014: 4
- FWCI
- 23.98
- Type
- journal article
- Language
- en
- Open access
- gold
- doi.org
- Locations
- PLoS ONE (publishedVersion, cc-by)
- Europe PMC (PubMed Central) (publishedVersion, other-oa)
- PubMed Central (publishedVersion, cc-by)
- Repository KITopen (Karlsruhe Institute of Technology) (publishedVersion, cc-by)
- PubMed (publishedVersion)
- BORIS (University Library Bern) (submittedVersion, cc-by)
- DOAJ (DOAJ: Directory of Open Access Journals) (submittedVersion, cc-by-sa)
- Max Planck Digital Library (submittedVersion, other-oa)
- Figshare (submittedVersion, cc-by)
- GoeScholar The Publication Server of the Georg-August-Universität Göttingen (Georg-August-Universität Göttingen) (submittedVersion, cc-by)
- GRO (submittedVersion, cc-by)
- MPG.PuRe (Max Planck Society) (submittedVersion, other-oa)
- KITopen (cc-by)
- Funders
- Johns Hopkins University
- Friedrich-Schiller-Universität Jena
- Deutsche Forschungsgemeinschaft (FOR 456)
- Max-Planck-Gesellschaft
- Topics
- Life Sciences › Agricultural and Biological Sciences › Soil Science › Soil Carbon and Nitrogen Dynamics
- Physical Sciences › Environmental Science › Nature and Landscape Conservation › Ecology and Vegetation Dynamics Studies
- Physical Sciences › Environmental Science › Ecology › Microbial Community Ecology and Physiology
- Keywords
- plant diversity, soil microbial communities, plant functional groups, plant species richness, soil microbial biomass, leaf area index, soil moisture, fungal to bacterial ratio, Fabaceae, plant-derived organic matter, root exudates, phospholipid fatty acids, grassland
- MeSH terms
- Bacteria, Chromatography, Gas, Fatty Acids, Fungi, Gas Chromatography-Mass Spectrometry, Models, Theoretical, Phospholipids, Plants, Soil, Soil Microbiology, Water, Plant Roots, Biomass, Biodiversity, Grassland
About these checks
Registry, retraction, Cites and statistics results are computed, not judged, with one exception: a printed reference that no index lists is read once by a model before it counts as a citation error. Claims are extracted by a model and kept only when their quote appears verbatim in the text; each cited source is then checked, with a model’s help, for whether it says what the claim relies on. Those verdicts can be wrong — read the claim’s quote and the cited source before relying on one.
Statistics and arithmetic are recomputed, not judged.
Confidence bands are shown only for fields calibrated on our annotated test set. None is calibrated yet, so no band is shown.
What counts as a claim ›How we measure confidence ›How we check this ›
Are you an author, or do you see a problem with this page? Request a review
