

Comparison of Soil Quality Index Using Three Methods
Open accessThe DOI matches its Crossref record; 44 of the 45 references it cites were found in a registry or an index; 1 of the 29 sources its claims cite were checked for support.
Abstract
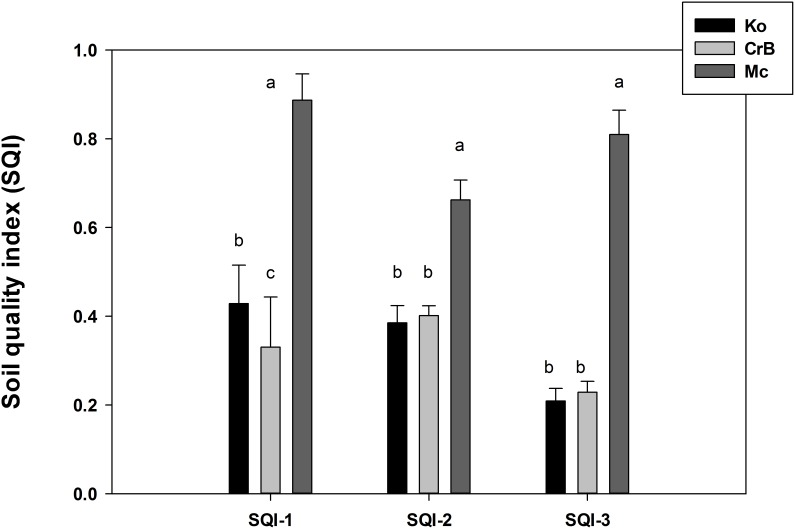
Assessment of management-induced changes in soil quality is important to sustaining high crop yield. Three methods used to estimate SQI were: (i) simple additive SQI, (ii) weighted additive SQI, and (iii) statistically modeled SQI based on principal component analysis (PCA).
Overview
CoChat Summary
TL;DR
The paper compares three soil quality index (SQI) methods—simple additive, weighted additive, and PCA-based—using 72 soil samples from three Ohio on-farm sites. All three SQIs were significantly correlated with each other and with crop yield, but the PCA-based SQI-3 showed the strongest yield correlation and was judged best for long-term use.
Key findings
- SQI values varied by treatment and soil type and ranged from 0–0.9 (1 being maximum); the organic muck soil (Mc) had significantly higher soil quality than mineral soils, with SQI-1 ordered Mc > Ko > CrB.
- SQIs did not significantly differ by depth under any method; SQI-3 was most strongly correlated with crop yield (r = 0.74–0.78), and all three SQIs were significantly correlated with each other (r = 0.92–0.97) and with crop yield (r = 0.65–0.79).
- When the dataset was split by crop, correlations were low: r < 0.20 for soybean grain and r < 0.60 for corn grain (data not shown), indicating that crop-specific and key soil parameters are important for estimating SQI.
- SQI-1 and SQI-2 had higher values than SQI-3 in some scenarios (SQI-1 for Ko and Mc; SQI-2 for CrB), but SQI-3 predicted crop yield relatively higher and was regarded as the best and easiest model due to its objective approach and lower number of indicator selection.
Methods
- Soil samples were collected in May 2013 from three on-farm sites in Ohio: organic Mc (Martisco Variant silt loam), mineral CrB (Crosby silt loam), and Ko (Kokomo silty clay loam), at 0–10, 10–20, 20–40, and 40–60 cm depths under no-tillage/conventional tillage or cover crop/no-cover crop treatments.
- Thirteen soil parameters were measured (pH, EC, BD, WSA, GMD, MWD, PR, SOC, N, C-stock, N-stock, AWC, water content); SQI-1 and SQI-2 used nine after omitting redundant MWD, C and N concentrations, and water content, while SQI-3 used PCA to select a minimum data set of four non-redundant parameters (SOC, AWC, WSA, pH).
- SQI-1 used threshold scores from literature/expert opinion; SQI-2 used linear scoring and weighted additive functions (RDC 0.4, WSC 0.2, NSC 0.4); SQI-3 used PCA-based statistical modeling. SQIs were validated against soybean and corn yield via Pearson correlation, with Tukey’s test in SAS and PCA in SPSS.
Limitations
- The paper states there is no standard methodology for correlating crop yield with depthwise or combined-layer SQI, and that low crop-specific correlations (r < 0.20 for soybean grain, r < 0.60 for corn grain) suggest key soil fertility and microbial parameters (e.g., ion exchange capacities, macro/micronutrients, microbial biomass/C/N, respiration) were not monitored.
- The paper states SQI-1 is subjective and relies on researcher viewpoint; SQI-2 requires many soil parameters under different functional systems and may be expensive/time-consuming; SQI-3 needs long-term evaluation within a particular soil/crop system.
- Evident from the text: the study used 72 samples from three on-farm sites in one year (May 2013) and validated against same-year crop yield, with values based on three field or laboratory measurements, so findings may be site- and year-specific.
Model-written summary. Check it against the paper before relying on it.
Integrity signals
Registry
Cites
Statistics
Figures



Verification
Claims the paper makes
1 Valid · 0 Not valid · 15 Not checked · 57 Own results and interpretations
The sources with a verdict support this claim; the rest weren’t checked yet, have no full text we could read, or their verdicts aren’t rated yet.
In the paper
“Most studies indexed soil quality employing only one method, with a few exceptions [8], [15], [16].”
§ Comparison of Soil Quality Index Using Three Methods > Introduction
What the sources say
- Not checked — no full text of the sourcecites [8] S Andrews, 2002, A comparison of soil quality indexing methods for vegetable production systems in Northern California, Agriculture, Ecosystems & Environment source
- Supportedcites [15] TM Zobeck, 2008, Comparison of two soil quality indexes to evaluate cropping systems in northern Colorado, Journal of Soil and Water Conservation source
The Abstract describes this study as testing and comparing two soil-quality indexes, SQI and SCI. It therefore supports the citation’s role as an exception to studies using only one method; it does not need to establish how common single-method studies are. (LLM, conf=0.91)
- Not checked — no full text of the sourcecites [16] R Zornoza, 2008, Validating the effectiveness and sensitivity of two soil quality indices based on natural forest soils under Mediterranean conditions, Soil Biology and Biochemistry source
plain- Asserted: passes — The authors put it forward as true.
- Checkable: passes — It can be checked against evidence.
- Load-bearing: passes — The paper’s conclusions depend on it.
- Based: passes — The paper gives a reason why it holds.
A result the paper states — it cites no source for it, so there is none to check. The quote shows it is in the paper.
In the paper
“Nevertheless, relatively higher correlation coefficient was observed in the 0–10 cm soil layer than the deeper soil profile (Table 7)”
§ Comparison of Soil Quality Index Using Three Methods > Results and Discussions
plainstates an association- Asserted: passes — The authors put it forward as true.
- Checkable: passes — It can be checked against evidence.
- Load-bearing: unclear — It is unclear whether the paper’s conclusions depend on it.
- Based: passes — The paper gives a reason why it holds.
A result the paper states — it cites no source for it, so there is none to check. The quote shows it is in the paper.
In the paper
“Depth had little influence in any SQIs in the present study”
§ Comparison of Soil Quality Index Using Three Methods > Results and Discussions
plain- Asserted: passes — The authors put it forward as true.
- Checkable: passes — It can be checked against evidence.
- Load-bearing: unclear — It is unclear whether the paper’s conclusions depend on it.
- Based: passes — The paper gives a reason why it holds.
A result the paper reports from its own data — it cites no other source for it, so there is none to check. The quote shows it is in the paper.
In the paper
“The SQI calculated by three different methods indicated that studied muck soil has significantly higher soil quality than that of mineral soils under on-farm conditions.”
§ Comparison of Soil Quality Index Using Three Methods > Conclusions
hedged- Asserted: passes — The authors put it forward as true.
- Checkable: passes — It can be checked against evidence.
- Load-bearing: passes — The paper’s conclusions depend on it.
- Based: passes — The paper gives a reason why it holds.
A result the paper reports from its own data — it cites no other source for it, so there is none to check. The quote shows it is in the paper.
In the paper
“while both Ko and Mc had significantly higher influence of RDC in SQI-2 in the upper layers than the lower depths, the opposite trend was found for the NSC (Fig. S1).”
§ Comparison of Soil Quality Index Using Three Methods > Results and Discussions
plainstates an association- Asserted: passes — The authors put it forward as true.
- Checkable: passes — It can be checked against evidence.
- Load-bearing: unclear — It is unclear whether the paper’s conclusions depend on it.
- Based: passes — The paper gives a reason why it holds.
43 more claims
Create a free account to see all 73 claims and to verify the 1 reference still open.
- It may state two separate claims as one. 18
- Probably not a substantial claim. 7
Citations
Cites
Jolliffe, I. (2005) · Encyclopedia of Statistics in Behavioral Science · doi:10.1002/0470013192.bsa501 · Cited by 14,310
The application of electronic computers to factor analysis
Kaiser, H. F. (1960) · Educational and Psychological Measurement · doi:10.1177/001316446002000116 · Cited by 12,459 · cited 2×
“0 following Kaiser [36], the present study had the third and fourth components with eigenvalues of 0.”
InfluentialGoodall, C. (1988) · Technometrics · doi:10.1080/00401706.1988.10488412 · Cited by 8,675
Dunteman, G. (1989) · Sage eBooks · doi:10.4135/9781412985475 · Cited by 2,658
Defining Soil Quality for a Sustainable Environment
(1994) · SSSA Special Publications · doi:10.2136/sssaspecpub35 · Cited by 2,181
Defining and Assessing Soil Quality
Doran, J. W., & Parkin, T. B. (1994) · SSSA Special Publications · doi:10.2136/sssaspecpub35.c1 · Cited by 2,176 · cited 2×
“Soil quality is defined as the soil’s capacity to function within natural or managed ecosystem boundaries and to sustain plant productivity while reducing soil degradation [1–4].”
BackgroundSoil Quality: A Concept, Definition, and Framework for Evaluation (A Guest Editorial)
Karlen, D. L., Mausbach, M. J., Doran, J. W., Cline, R. G., Harris, R. F., & Schuman, G. E. (1997) · Soil Science Society of America Journal · doi:10.2136/sssaj1997.03615995006100010001x · Cited by 2,028 · cited 1×
“Thus, a mathematical or statistical framework was put forward in early 1990s to estimate soil quality index (SQI) [1,3,4].”
BackgroundA Direct Method of Aggregate Analysis of Soils and a Study of the Physical Nature of Erosion Losses1
Yoder, R. E. (1936) · Agronomy Journal · doi:10.2134/agronj1936.00021962002800050001x · Cited by 1,403 · cited 1×
“Bulk samples were obtained to measure the aggregate size distributions and fraction of water stable aggregates (WSA) using the wet sieving method [24].”
MethodThe Soil Management Assessment Framework: A Quantitative Soil Quality Evaluation Method
Andrews, S. S., Karlen, D. L., & Cambardella, C. A. (2004) · Soil Science Society of America Journal · doi:10.2136/sssaj2004.1945 · Cited by 1,341
Research works printed but not linked: 1
- Dane JH, Hopmans JH (2002) Water retention and storage. In: Dane JH, Topp GC, editors. Methods of soil analysis Part 4, SSSA Book Ser 5. Madison, WI.: SSSA. pp. 671–717.
Cited by
Soil health assessment: A critical review of current methodologies and a proposed new approach
Rinot, O., Levy, G. J., Steinberger, Y., Svoray, T., & Eshel, G. (2019) · Science of The Total Environment · doi:10.1016/j.scitotenv.2018.08.259 · Cited by 435
Soil quality index (SQI) as a tool to evaluate crop productivity in semi-arid Deccan plateau, India
Vasu, D., Singh, S. K., Ray, S. K., Duraisami, V. P., Tiwary, P., Chandran, P., Nimkar, A. M., & Anantwar, S. G. (2016) · Geoderma · doi:10.1016/j.geoderma.2016.07.010 · Cited by 351
“Subsequently, soil quality gained importance as a tool to assess various agricultural and horticultural production systems around the world (Bouma and Droogers, 1998; Andrews et al., 2002; Armenise et al., 2013; Mukherjee and Lal, 2014).”
BackgroundRaiesi, F. (2017) · Ecological Indicators · doi:10.1016/j.ecolind.2016.12.049 · Cited by 340
“Besides, for a consistent and accurate assessment of SQ a systematic method is required for interpreting and measuring soil properties (Granatstein and Bezdicek, 1992), and individual soil attributes may not be adequate indicators of SQ (Masto et al., 2007; Mukherjee and Lal, 2014).”
MethodConservation agriculture as a sustainable system for soil health: a review
Cárceles Rodríguez, B., Durán-Zuazo, V. H., Soriano Rodríguez, M., García-Tejero, I. F., Gálvez Ruiz, B., & Cuadros Tavira, S. (2022) · Soil Systems · doi:10.3390/soilsystems6040087 · Cited by 337
“Soil health is a complex functional concept and cannot be measured directly in the field or laboratory; it can only be inferred indirectly by measuring soil indicators [65].”
BackgroundNabiollahi, K., Golmohamadi, F., Taghizadeh-Mehrjardi, R., Kerry, R., & Davari, M. (2018) · Geoderma · doi:10.1016/j.geoderma.2017.12.024 · Cited by 320
Metadata
- Authors
- Mukherjee, A., & Lal, R.
- Affiliations
- The Ohio State University (US)
- Corresponding author
- Mukherjee, Atanu
- Venue
- PLoS ONE
- Publisher
- Public Library of Science (PLoS)
- Published
- 2014-08-22
- Volume
- 9
- Issue
- 8
- Pages
- e105981
- ISSN
- 1932-6203 (ISSN-L)
- PMC
- PMC4141864
- OpenAlex
- W2011488730
- Cited by
- 379
- References
- 45
- Citations by year
- 2026: 54 · 2025: 42 · 2024: 55 · 2023: 42 · 2022: 40 · 2021: 49 · 2020: 26 · 2019: 18 · 2018: 21 · 2017: 12 · 2016: 14 · 2015: 4 · 2014: 2
- FWCI
- 15.04
- Type
- journal article
- Language
- en
- Open access
- gold
- doi.org
- Locations
- PLoS ONE (publishedVersion, cc-by)
- PubMed Central (publishedVersion, cc-by)
- PubMed (publishedVersion)
- RePEc: Research Papers in Economics (submittedVersion)
- DOAJ (DOAJ: Directory of Open Access Journals) (submittedVersion, cc-by-sa)
- Funders
- U.S. Department of Agriculture (2011-68002-30190)
- National Institute of Food and Agriculture (20116800230190)
- Topics
- Life Sciences › Agricultural and Biological Sciences › Soil Science › Soil Management and Crop Yield
- Life Sciences › Agricultural and Biological Sciences › Soil Science › Soil Science and Environmental Management
- Life Sciences › Agricultural and Biological Sciences › Agronomy and Crop Science › Sustainable Agricultural Systems Analysis
- Keywords
- soil quality index, soil quality assessment, crop yield, principal component analysis, soil depth, organic soils, mineral soils, soil management, Ohio soils
- MeSH terms
- Zea mays, Models, Theoretical, Ohio, Soil, Glycine max, Models, Statistical, Crops, Agricultural, Principal Component Analysis
About these checks
Registry, retraction, Cites and statistics results are computed, not judged, with one exception: a printed reference that no index lists is read once by a model before it counts as a citation error. Claims are extracted by a model and kept only when their quote appears verbatim in the text; each cited source is then checked, with a model’s help, for whether it says what the claim relies on. Those verdicts can be wrong — read the claim’s quote and the cited source before relying on one.
A language model drew the claims from the paper on 2026-10-10, under version 3 of the claim definition (model deepseek-v4.1-flash, prompt extract-v3).
A second model labelled each claim on 2026-10-10 (model jev-1.13-20260917, definition revision gold-guideline-v0.2).
Cited sources are checked with a language model’s help (gpt-6-sol).
Statistics and arithmetic are recomputed, not judged.
Confidence bands are shown only for fields calibrated on our annotated test set. None is calibrated yet, so no band is shown.
What counts as a claim ›How we measure confidence ›How we check this ›
Are you an author, or do you see a problem with this page? Request a review
How to cite
Cite CoChat for the checks on this page, and the paper for its own findings.
- This page
- CoChat. (2026). Citation check: Comparison of Soil Quality Index Using Three Methods. https://app.cochat.ai/papers/10.1371/journal.pone.0105981
- The paper
- Mukherjee, A., & Lal, R. (2014). Comparison of Soil Quality Index Using Three Methods. PLoS ONE. https://doi.org/10.1371/journal.pone.0105981
Data sources
Bibliographic data: Semantic Scholar, OpenAlex, Crossref.
Contains information from the Semantic Scholar Academic Graph Datasets, made available under the ODC Attribution License (ODC-BY 1.0).
Semantic Scholar’s data is described in: Kinney, R., et al. (2023). The Semantic Scholar Open Data Platform. arXiv:2301.10140.
