Cited by 25

The DOI matches its Crossref record; 1 of the 1 references it cites were found in a registry or an index.

Detection of the G17V RHOA Mutation in Angioimmunoblastic T-Cell Lymphoma and Related Lymphomas Using Quantitative Allele-Specific PCR

Nakamoto-Matsubara, Rie, Sakata-Yanagimoto, Mamiko, Enami, Terukazu, Yoshida, Kenichi, Yanagimoto, Shintaro, Shiozawa, Yusuke, Nanmoku, Tohru, Satomi, Kaishi, Muto, Hideharu, Obara, Naoshi, Kato, Takayasu, Kurita, Naoki, Yokoyama, Yasuhisa, Izutsu, Koji, Ota, Yasunori, Sanada, Masashi, Shimizu, Seiichi, Komeno, Takuya, Sato, Yuji, Ito, Takayoshi, Kitabayashi, Issay, Takeuchi, Kengo, Nakamura, Naoya, Ogawa, Seishi, Chiba, Shigeru·2014·PLoS ONE

Overview

The claims and statistics of this paper haven’t been checked yet.

Run the check — free, no account needed. It reads the open-access text and checks the sources it cites.

A few free checks a day · papers already verified open instantly · results are public

Integrity signals

Registry

Crossref · 10.1371/journal.pone.0109714

Cites

1 of 1 references verified0 citation errors · 0 not checkable

Statistics

Figures

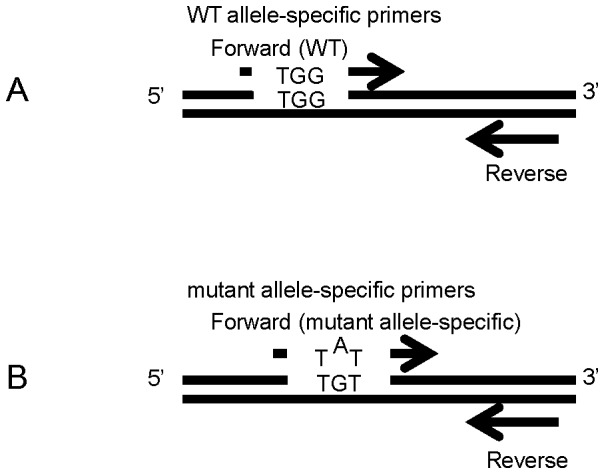
Figure 1 Design of primers used in the study. A WT allele-specific primer forward primer (Upper), a mutant allele-specific forward primer (Lower), and a common primer were designed. The 3′ end of the forward mutant primer was specific to the mutant site (G to T) and an internal mismatch at the second nucleotide from 3′ end (G to A) was introduced to improve specificity.
Figure 1 Design of primers used in the study. A WT allele-specific primer forward primer (Upper), a mutant allele-specific forward primer (Lower), and a common primer were designed. The 3′ end of the forward mutant primer was specific to the mutant site (G to T) and an internal mismatch at the second nucleotide from 3′ end (G to A) was introduced to improve specificity.CC BY · PubMed Central
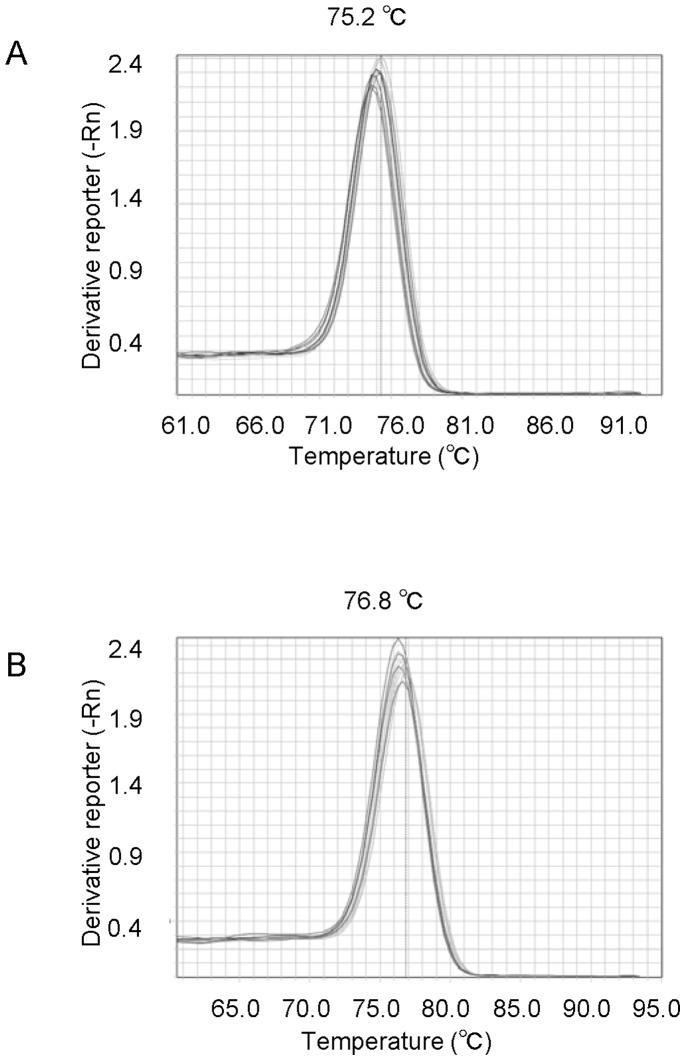
Figure 2 Melting curve analysis. A. Melting curve constructed using WT allele-specific primers. B. Melting curve constructed using mutant allele-specific primer set.
Figure 2 Melting curve analysis. A. Melting curve constructed using WT allele-specific primers. B. Melting curve constructed using mutant allele-specific primer set.CC BY · PubMed Central
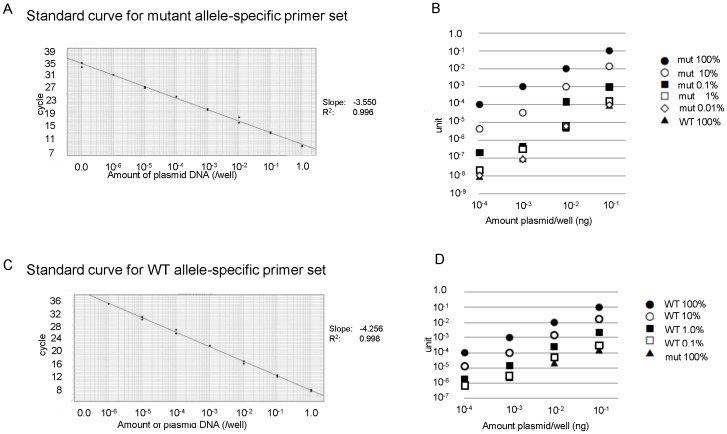
Figure 3 Standard curve showing linearity of quantitative allele-specific PCR. A standard curve was generated by serial dilution of WT or G17V cDNA that had been subcloned into pBluescript. A. Serial dilution of pBS/mutRHOA. Black dots correspond to 1.0×10⁻⁹∼1.0 unit of mutant plasmid (duplicate samples). The titration slope is −3.550 and R2 is 0.996. B. pBS/mutRHOA was mixed with pBS/wtRHOA at 100%, 10%, 1.0%, 0.1%, 0.01% and 0%. Mix concentrations were adjusted to 1.0 ng/well and diluted 1∶10 4 times for quantitative PCR analysis with allele-specific mutant primers. Horizonal axis indicates the amount of DNA per well. Vertical axis indicates unit for each sample. Black dot, MUT 100%; open dot, MUT 10%; square, MUT 1%; open square, MUT 0.1%; diamond, MUT 0.01%; triangle, MUT 0% (WT 100%) C. Serial dilution of pBS/wtRHOA. Black dots correspond to 1.0×10⁻⁶∼1.0 unit of WT cDNA (duplicate samples). The titration slope is −4.256, and R2 is 0.998. D. pBS/wtRHOA was mixed with pBS/mutRHOA at 100%, 10%, 1.0%, 0.1%, 0.1% and 0%. Mix concentrations were adjusted to 1.0 ng/well and diluted 1∶10 4 times for quantitative PCR analysis with WT allele-specific primers. Black dot, WT 100%; open dot, WT 10%; square, WT 1%; open square, WT 0.1%; triangle, WT 0% (MUT 100%).
Figure 3 Standard curve showing linearity of quantitative allele-specific PCR. A standard curve was generated by serial dilution of WT or G17V cDNA that had been subcloned into pBluescript. A. Serial dilution of pBS/mutRHOA. Black dots correspond to 1.0×10⁻⁹∼1.0 unit of mutant plasmid (duplicate samples). The titration slope is −3.550 and R2 is 0.996. B. pBS/mutRHOA was mixed with pBS/wtRHOA at 100%, 10%, 1.0%, 0.1%, 0.01% and 0%. Mix concentrations were adjusted to 1.0 ng/well and diluted 1∶10 4 times for quantitative PCR analysis with allele-specific mutant primers. Horizonal axis indicates the amount of DNA per well. Vertical axis indicates unit for each sample. Black dot, MUT 100%; open dot, MUT 10%; square, MUT 1%; open square, MUT 0.1%; diamond, MUT 0.01%; triangle, MUT 0% (WT 100%) C. Serial dilution of pBS/wtRHOA. Black dots correspond to 1.0×10⁻⁶∼1.0 unit of WT cDNA (duplicate samples). The titration slope is −4.256, and R2 is 0.998. D. pBS/wtRHOA was mixed with pBS/mutRHOA at 100%, 10%, 1.0%, 0.1%, 0.1% and 0%. Mix concentrations were adjusted to 1.0 ng/well and diluted 1∶10 4 times for quantitative PCR analysis with WT allele-specific primers. Black dot, WT 100%; open dot, WT 10%; square, WT 1%; open square, WT 0.1%; triangle, WT 0% (MUT 100%).CC BY · PubMed Central
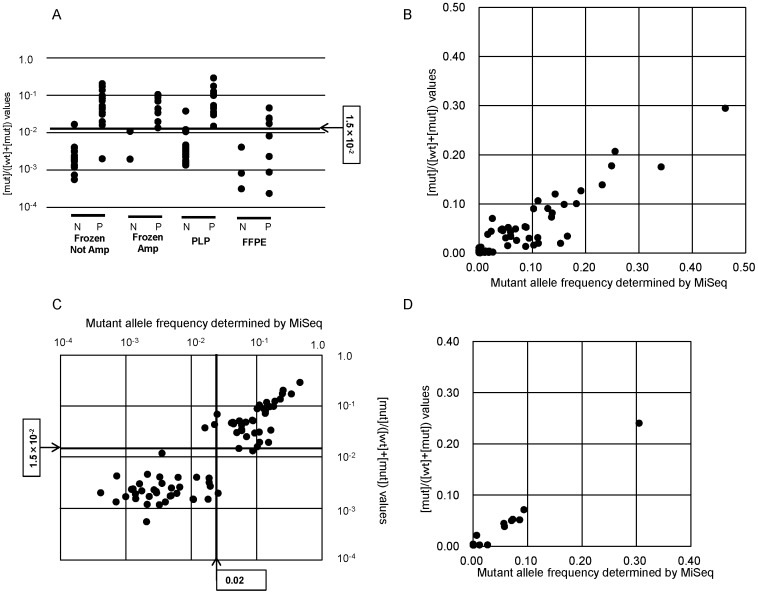
Figure 4 qAS-PCR of AITL and PTCL-NOS samples. A, Shown are [mut]/([wt]+[mut]) values for each sample. N, mutation negative determined by MiSeq; P, mutation positive determined by MiSeq; Amp, amplified; PLP, periodate/lysine/paraformaldehyde-fixed; FFPE, formalin-fixed/paraffin-embedded. B, Comparison of [mut]/([wt]+[mut]) values by qAS-PCR and mutant allele frequencies as determined by MiSeq for 95 original or whole genome-amplified DNA samples, including 43 AITL and 52 PTCL-NOS. Cut-off values were determined as 1.5×10⁻² for [mut]/([wt]+[mut]) by qAS-PCR and as 0.02 for mutant allele frequencies as determined by MiSeq. C, Comparison of [mut]/([wt]+[mut]) values by qAS-PCR and mutant allele frequencies as determined by MiSeq for 95 DNA samples in a log scales. D, Comparison of [mut]/([wt]+[mut]) values by qAS-PCR and mutant allele frequencies as determined by MiSeq for 13 FFPE PCR-amplicon samples.
Figure 4 qAS-PCR of AITL and PTCL-NOS samples. A, Shown are [mut]/([wt]+[mut]) values for each sample. N, mutation negative determined by MiSeq; P, mutation positive determined by MiSeq; Amp, amplified; PLP, periodate/lysine/paraformaldehyde-fixed; FFPE, formalin-fixed/paraffin-embedded. B, Comparison of [mut]/([wt]+[mut]) values by qAS-PCR and mutant allele frequencies as determined by MiSeq for 95 original or whole genome-amplified DNA samples, including 43 AITL and 52 PTCL-NOS. Cut-off values were determined as 1.5×10⁻² for [mut]/([wt]+[mut]) by qAS-PCR and as 0.02 for mutant allele frequencies as determined by MiSeq. C, Comparison of [mut]/([wt]+[mut]) values by qAS-PCR and mutant allele frequencies as determined by MiSeq for 95 DNA samples in a log scales. D, Comparison of [mut]/([wt]+[mut]) values by qAS-PCR and mutant allele frequencies as determined by MiSeq for 13 FFPE PCR-amplicon samples.CC BY · PubMed Central
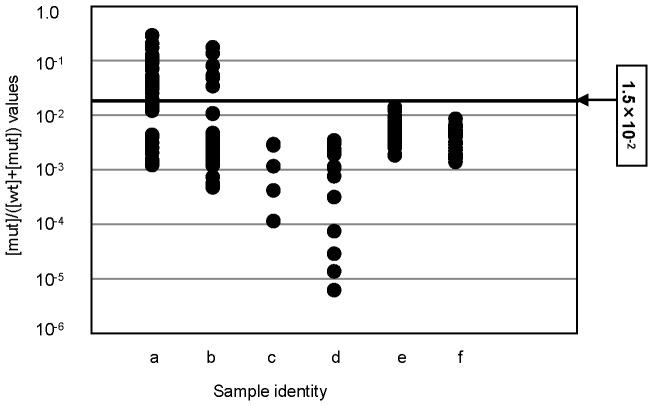
Figure 5 qAS-PCR for 275 tumor and control samples. qAS-PCR was performed for tumor samples, including 43 AITL (a), 52 PTCL-NOS (b), 5 T-cell lymphoma other than AITL and PTCL-NOS (c), 19 B-cell lymphomas (d), 129 myeloid malignancies (e) and 27 control samples (f).
Figure 5 qAS-PCR for 275 tumor and control samples. qAS-PCR was performed for tumor samples, including 43 AITL (a), 52 PTCL-NOS (b), 5 T-cell lymphoma other than AITL and PTCL-NOS (c), 19 B-cell lymphomas (d), 129 myeloid malignancies (e) and 27 control samples (f).CC BY · PubMed Central

Verification

Claims the paper makes

The claims and statistics of this paper haven’t been checked yet.

Run the check — free, no account needed. It reads the open-access text and checks the sources it cites.

A few free checks a day · papers already verified open instantly · results are public

Claims other papers make about this one

Each is checked against this paper’s own text: does it say what the citing paper says it does?

Self-check

Percentages, sums and reported differences re-computed from the paper’s own numbers.

The self-check needs the paper’s full text.

Citations

Cites

Show all 1 references

Research works printed but not linked: 18

  1. Swerdlow SH, Campo E, Harris NL, Jaffe ES, Pileri SA, et al. (2008) WHO classification of tumors of haematopoietic and lymphoid tissues. 4th ed. Lyon, France. IARC Press: 306–311.
  2. L de Leval, 2010, Advances in the understanding and management of angioimmunoblastic T-cell lymphoma, Br J Haematol, 148, 673, 10.1111/j.1365-2141.2009.08003.x · DOI
  3. G Frizzera, 1974, Angio-immunoblastic lymphadenopathy with dysproteinaemia, Lancet, 1, 1070, 10.1016/S0140-6736(74)90553-4 · DOI
  4. A Dogan, 2003, Angioimmunoblastic T-cell lymphoma, Br J Haematol, 121, 681, 10.1046/j.1365-2141.2003.04335.x · DOI
  5. PP Piccaluga, 2013, Molecular profiling improves classification and prognostication of nodal peripheral T-cell lymphomas: results of a phase III diagnostic accuracy study, J Clin Oncol, 31, 3019, 10.1200/JCO.2012.42.5611 · DOI
  6. B Papadi, 2012, Atypical angioimmunoblastic T-cell lymphomas masquerading as systemic polyclonal B-immunoblastic proliferation, Virchows Arch, 461, 323, 10.1007/s00428-012-1280-5 · DOI
  7. L Couronne, 2012, TET2 and DNMT3A mutations in human T-cell lymphoma, N Engl J Med, 366, 95, 10.1056/NEJMc1111708 · DOI · Paper page
  8. RA Cairns, 2012, IDH2 mutations are frequent in angioimmunoblastic T-cell lymphoma, Blood, 119, 1901, 10.1182/blood-2011-11-391748 · DOI
  9. SM Langemeijer, 2009, Acquired mutations in TET2 are common in myelodysplastic syndromes, Nat Genet, 41, 838, 10.1038/ng.391 · DOI · Paper page
  10. M Sakata-Yanagimoto, 2014, Somatic RHOA mutation in angioimmunoblastic T cell lymphoma, Nat Genet, 46, 171, 10.1038/ng.2872 · DOI
  11. T Palomero, 2014, Recurrent mutations in epigenetic regulators, RHOA and FYN kinase in peripheral T cell lymphomas, Nat Genet, 46, 166, 10.1038/ng.2873 · DOI
  12. P Wangkumhang, 2007, WASP: a Web-based Allele-Specific PCR assay designing tool for detecting SNPs and mutations, BMC Genomics, 8, 275, 10.1186/1471-2164-8-275 · DOI
  13. D Shammaa, 2010, JAK2 V617F mutation detection: laboratory comparison of two kits using RFLP and qPCR, Genet Test Mol Biomarkers, 14, 13, 10.1089/gtmb.2009.0119 · DOI
  14. C Frantz, 2007, Comparative evaluation of three JAK2V617F mutation detection methods, Am J Clin Pathol, 128, 865, 10.1309/LW7Q3739RBRMBXXP · DOI
  15. Z Wu, 2011, Development and inter-laboratory validation of unlabeled probe melting curve analysis for detection of JAK2 V617F mutation in polycythemia vera, PLoS One, 6, e26534, 10.1371/journal.pone.0026534 · DOI
  16. E Tiacci, 2011, BRAF mutations in hairy-cell leukemia, N Engl J Med, 364, 2305, 10.1056/NEJMoa1014209 · DOI
  17. SP Treon, 2013, A new era for Waldenstrom macroglobulinemia: MYD88 L265P, Blood, 121, 4434, 10.1182/blood-2013-04-494849 · DOI
  18. HL Koskela, 2012, Somatic STAT3 mutations in large granular lymphocytic leukemia, N Engl J Med, 366, 1905, 10.1056/NEJMoa1114885 · DOI

Cited by

Metadata

Authors
Nakamoto-Matsubara, R., Sakata-Yanagimoto, M., Enami, T., Yoshida, K., Yanagimoto, S., Shiozawa, Y., Nanmoku, T., Satomi, K., Muto, H., Obara, N., Kato, T., Kurita, N., Yokoyama, Y., Izutsu, K., Ota, Y., Sanada, M., Shimizu, S., Komeno, T., Sato, Y., Ito, T., Kitabayashi, I., Takeuchi, K., Nakamura, N., Ogawa, S., & Chiba, S.
Venue
PLoS ONE
Published
2014-10-13
Volume
9
Issue
10
Pages
e109714
ISSN
1932-6203
Cited by
25
References
1
Language
en

About these checks

Registry, retraction, Cites and statistics results are computed, not judged, with one exception: a printed reference that no index lists is read once by a model before it counts as a citation error. Claims are extracted by a model and kept only when their quote appears verbatim in the text; each cited source is then checked, with a model’s help, for whether it says what the claim relies on. Those verdicts can be wrong — read the claim’s quote and the cited source before relying on one.

Statistics and arithmetic are recomputed, not judged.

Confidence bands are shown only for fields calibrated on our annotated test set. None is calibrated yet, so no band is shown.

What counts as a claim ›How we measure confidence ›How we check this ›

Are you an author, or do you see a problem with this page? Request a review