

The DOI matches its Crossref record; 50 of the 50 references it cites were found in a registry or an index; none of the 45 sources its claims cite is checked for support yet.
Mutation analysis links angioimmunoblastic T-cell lymphoma to clonal hematopoiesis and smoking
Open accessPublished version of a preprint
Abstract
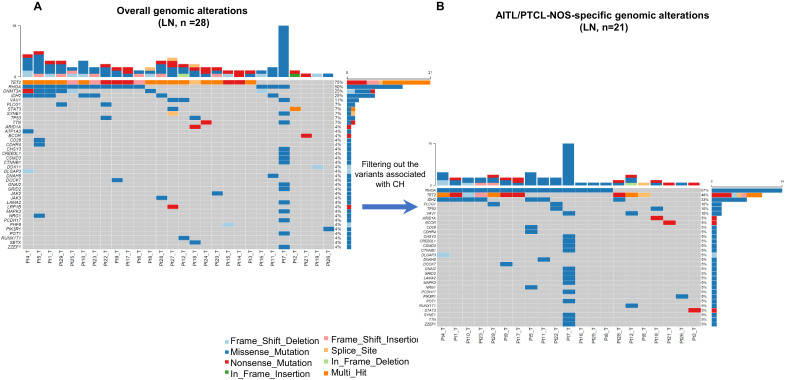
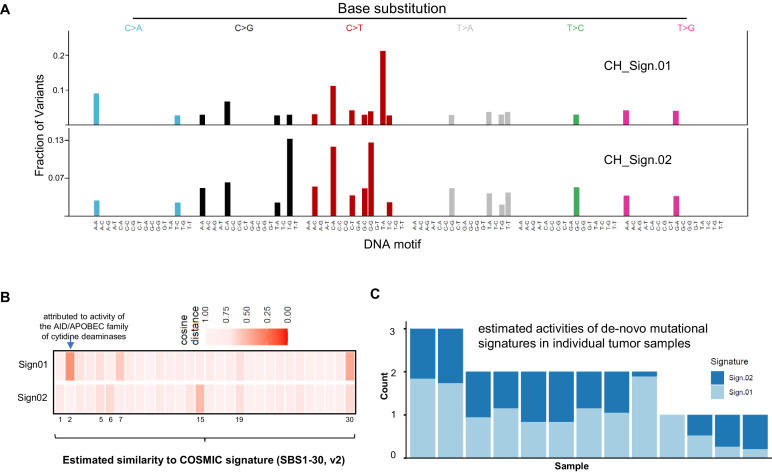
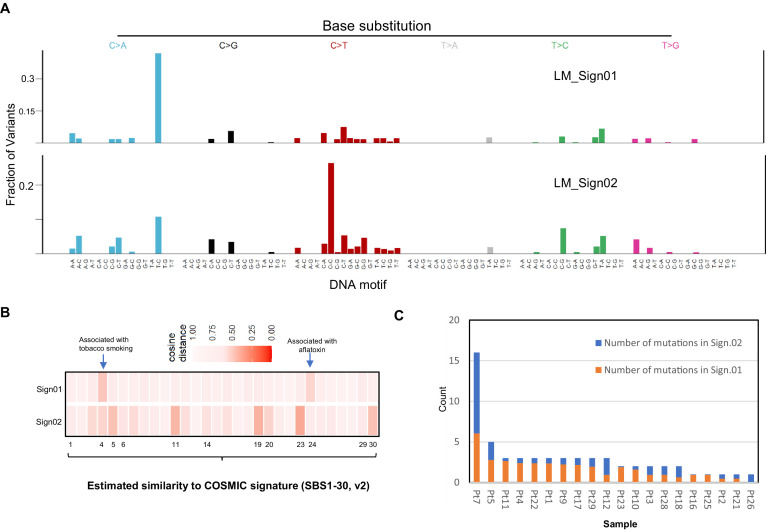
Background: Although advance has been made in understanding the pathogenesis of mature T-cell neoplasms, the initiation and progression of angioimmunoblastic T-cell lymphoma (AITL) and peripheral T-cell lymphoma, not otherwise specified (PTCL-NOS), remain poorly understood. A subset of AITL/PTCL-NOS patients develop concomitant hematologic neoplasms (CHN), and a biomarker to predict this risk is lacking. Methods: We generated and analyzed the mutation profiles through 537-gene targeted sequencing of the primary tumors and matched bone marrow/peripheral blood samples in 25 patients with AITL and two with PTCL-NOS. Results: Clonal hematopoiesis (CH)-associated genomic alterations, found in 70.4% of the AITL/PTCL-NOS patients, were shared among CH and T-cell lymphoma, as well as concomitant myeloid neoplasms or diffuse large B-cell lymphoma (DLBCL) that developed before or after AITL. Aberrant AID/APOBEC activity-associated and tobacco smoking-associated mutational signatures were respectively enriched in the early CH-associated mutations and late non-CH-associated mutations during AITL/PTCL-NOS development. Moreover, analysis showed that the presence of CH harboring ≥2 pathogenic TET2 variants with ≥15% of allele burden conferred higher risk for CHN (p=0.0006, hazard ratio = 14.01, positive predictive value = 88.9%, negative predictive value = 92.1%). Conclusions: We provided genetic evidence that AITL/PTCL-NOS, CH, and CHN can frequently arise from common mutated hematopoietic precursor clones. Our data also suggests smoking exposure as a potential risk factor for AITL/PTCL-NOS progression. These findings provide insights into the cell origin and etiology of AITL and PTCL-NOS and provide a novel stratification biomarker for CHN risk in AITL patients. Funding: R01 grant (CA194547) from the National Cancer Institute to WT.
Overview
CoChat Summary
Written by AI from the paper’s full text.
TL;DR
In 27 patients with AITL/PTCL-NOS, 70.4% had clonal hematopoiesis (CH)-associated mutations shared with the lymphoma, supporting a common mutated hematopoietic precursor origin. Late mutations were enriched for smoking-associated C>A substitutions, and CH harboring ≥2 pathogenic TET2 variants at ≥15% allele burden predicted concomitant hematologic neoplasms.
Key findings
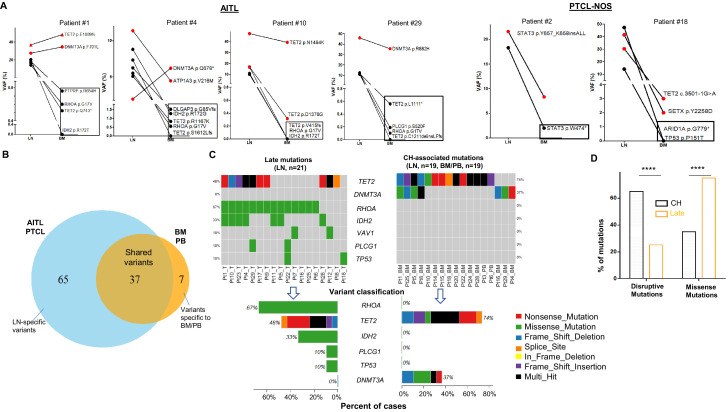
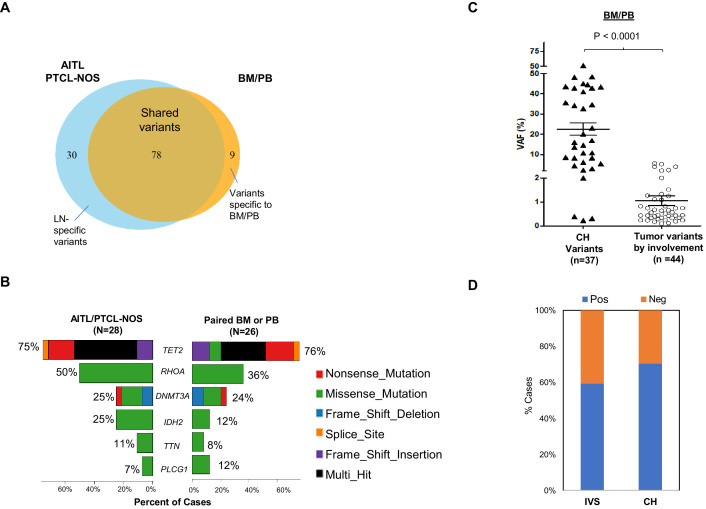
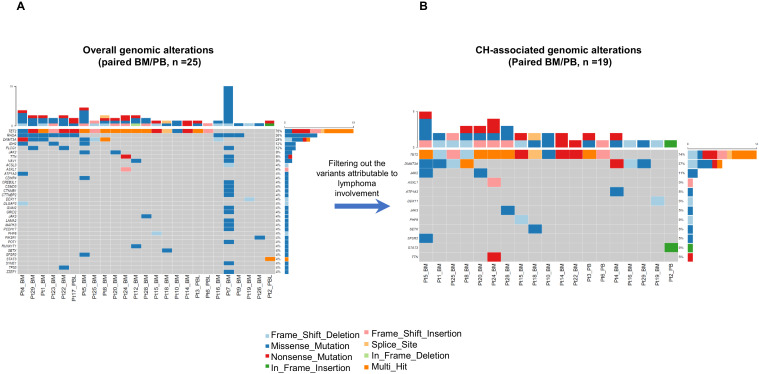
- CH-associated genomic alterations were found in 70.4% (19/27) of AITL/PTCL-NOS patients and were shared between CH and T-cell lymphoma; shared mutations were primarily in TET2 (74% of cases) and DNMT3A (37%). CH-associated variant allele frequencies averaged 22.5% (median 16.5%) versus ~1% for lymphoma-involvement variants (p<0.0001).
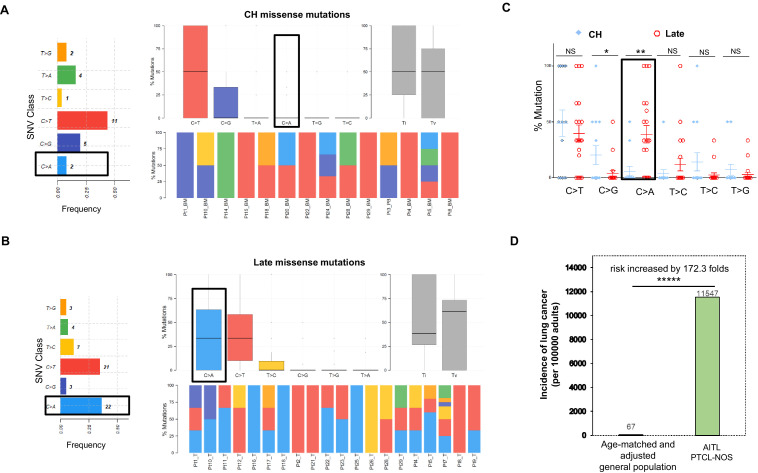
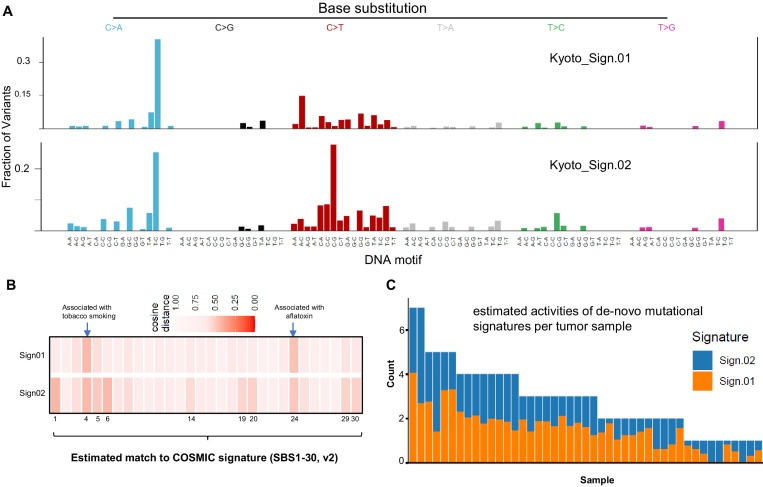
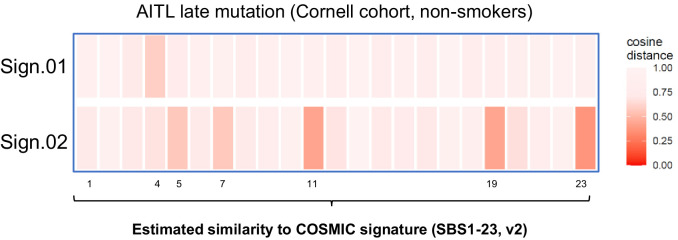
- Late non-CH mutations were enriched for missense changes (75.2% vs 36.1% in CH-associated mutations, p<0.0001) and C>A substitutions (mean 38.8% vs 5.95%, p=0.0024); the major late signature matched smoking-associated COSMIC Signature 4 (CCS ≈ 0.5). AITL/PTCL-NOS patients had a 172.3-fold higher lung cancer incidence than an age-matched general population (11,547 vs 67 per 100,000, p<0.00001).
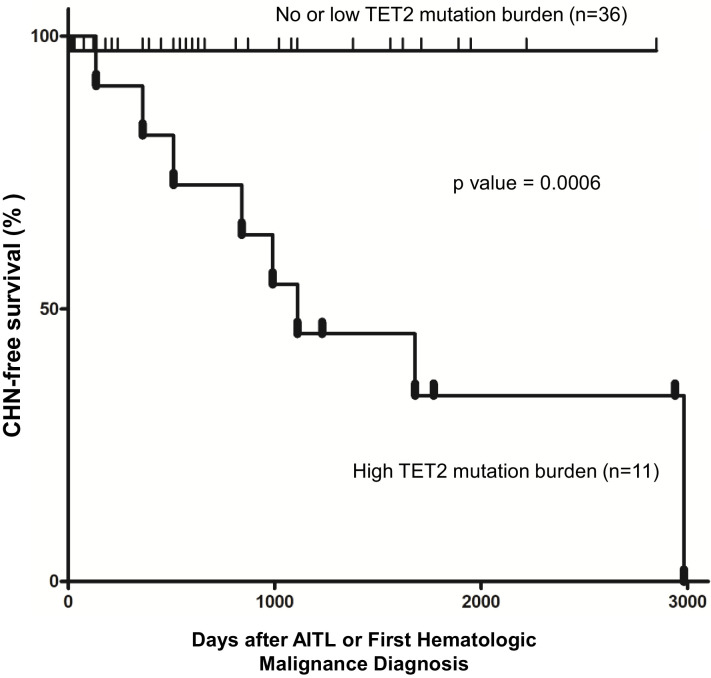
- CH with ≥2 pathogenic TET2 variants and ≥15% allele burden conferred higher risk for concomitant hematologic neoplasm (p=0.0006, hazard ratio=14.01, positive predictive value=88.9%, negative predictive value=92.1%, specificity 97.2%, sensitivity 72.7%).
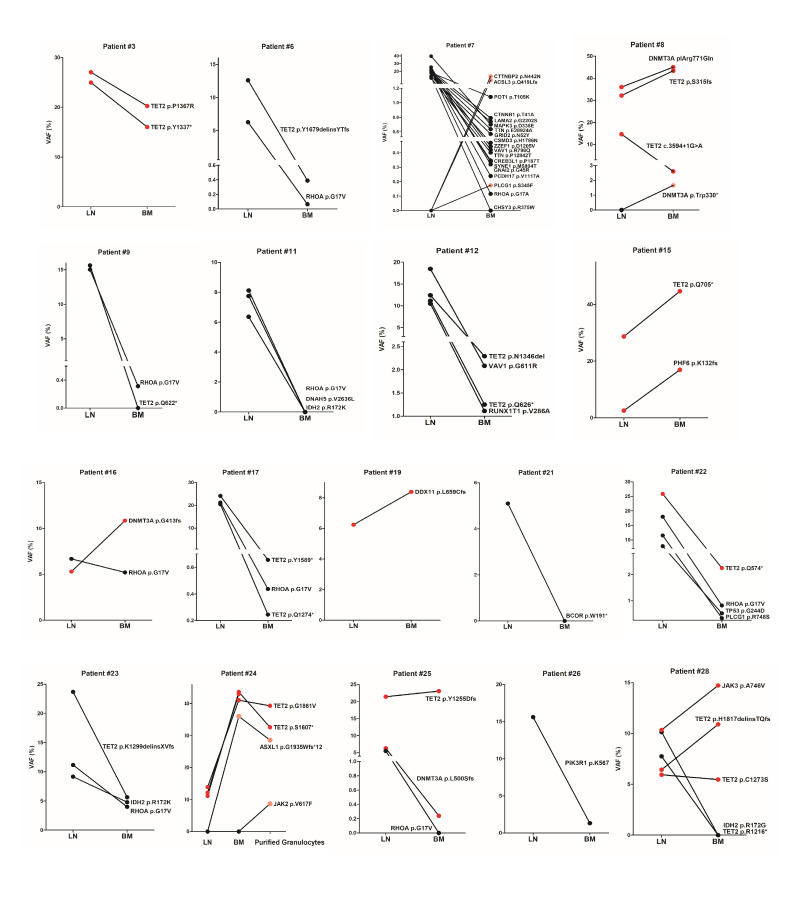
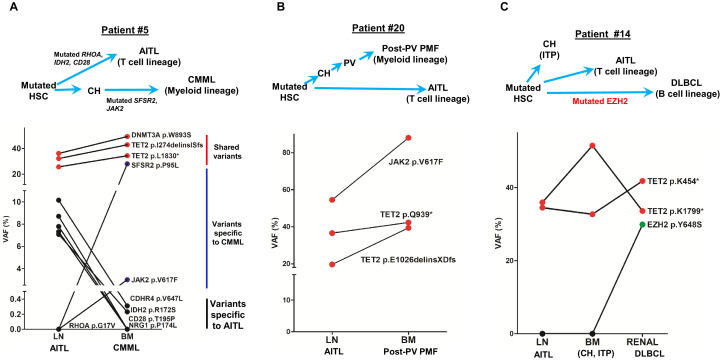
- Four AITL patients had additional hematologic neoplasms; shared truncal mutations supported divergent evolution from common precursors, including one case with CH, AITL, and DLBCL sharing TET2 and an EZH2 hotspot mutation.
Methods
- Targeted sequencing of 27 paired diagnostic lymph node and matched bone marrow/peripheral blood samples from 25 AITL and 2 PTCL-NOS patients, using a 537-gene T-cell lymphoma panel; a 45-gene myeloid NGS panel was also described.
- CH-associated mutations were distinguished from lymphoma-involvement mutations using tumor burden estimates from histology, flow cytometry, TCRG rearrangement, and VAF comparisons; mutational signatures were extracted with MutSignatures and compared with COSMIC signatures.
- Survival analysis used Kaplan–Meier curves and Cox proportional hazards models; the TET2 biomarker analysis combined the study cohort with an external AITL cohort for 47 total cases.
Limitations
- The paper states no clear association was demonstrated between smoking and AITL/PTCL-NOS development; C>A or overall Signature 4 mutation burden did not differ significantly between evaluable smokers and non-smokers (average C>A mutations 1 vs 0.92, p=0.61), and secondhand smoke exposure was inferred rather than directly documented.
- The paper states single-cell methodology will be needed to definitively determine clonal architecture in lymphoma and bone marrow with multiple mutations.
- Evident from the text: the primary cohort is small (27 patients; 47 for the survival analysis with an external cohort), the study is retrospective, and the targeted panel covers selected genes rather than the whole genome; smoking history was missing for 2 patients.
Model-written summary. Check it against the paper before relying on it.
Integrity signals
Registry
Cites
Statistics
Figures
Verification
Claims the paper makes
70 Own result · 26 Own interpretation · 14 Not checked yet · 13 Check pending · 4 Sources not found · 4 No full text of the sources · 3 Own method · 1 No basis given
A result the paper reports from its own data — it cites no other source for it, so there is none to check. The quote shows it is in the paper.
In the paper
“Additional late non-CH mutations are found in 68.4% of the AITL/PTCL-NOS in our cohort, consistent with the belief that CH-associated TET2 and DNMT3A mutations are insufficient for tumorigenesis and additional genetic alterations are required.”
§ Mutation analysis links angioimmunoblastic T-cell lymphoma to clonal hematopoiesis and smoking > Discussion
plain- Asserted: passes — The authors put it forward as true.
- Checkable: passes — It can be checked against evidence.
- Load-bearing: passes — The paper’s conclusions depend on it.
- Based: passes — The paper gives a reason why it holds.
A result the paper reports from its own data — it cites no other source for it, so there is none to check. The quote shows it is in the paper.
In the paper
“On a case basis, C>A substitutions are enriched in late mutations compared to CH mutations (mean, 38.8% vs. 5.95%; median, 33.3% vs. 0%; t test, p-value=0.0024)”
§ Mutation analysis links angioimmunoblastic T-cell lymphoma to clonal hematopoiesis and smoking > Results > Late mutations in AITL/PTCL-NOS are enriched for C>A transversion substitutions possibly associated with smoking
plainstates an association- Asserted: passes — The authors put it forward as true.
- Checkable: passes — It can be checked against evidence.
- Load-bearing: passes — The paper’s conclusions depend on it.
- Based: passes — The paper gives a reason why it holds.
- Rests on 2 assumptions not shown here.
A result the paper reports from its own data — it cites no other source for it, so there is none to check. The quote shows it is in the paper.
In the paper
“the presence of CH harboring ≥2 pathogenic TET2 variants with ≥15% of allele burden conferred higher risk for CHN (p=0.0006, hazard ratio = 14.01, positive predictive value = 88.9%, negative predictive value = 92.1%)”
§ Mutation analysis links angioimmunoblastic T-cell lymphoma to clonal hematopoiesis and smoking > Abstract > Results:
plainstates an association- Asserted: passes — The authors put it forward as true.
- Checkable: passes — It can be checked against evidence.
- Load-bearing: passes — The paper’s conclusions depend on it.
- Based: passes — The paper gives a reason why it holds.
- Rests on an assumption not shown here.
A result the paper reports from its own data — it cites no other source for it, so there is none to check. The quote shows it is in the paper.
In the paper
“We identified in the matched BM/PB specimens 44 variants from 14 genes, excluding the variants attributed to the BM/PB involvement by AITL/PTCL-NOS as described above”
§ Mutation analysis links angioimmunoblastic T-cell lymphoma to clonal hematopoiesis and smoking > Results > Mutation profiling of AITL/PTCL-NOS and matched BM/PB supports a potential origin of AITL/PTCL-NOS from mutated hematopoietic precursors associated with CH
plain- Asserted: passes — The authors put it forward as true.
- Checkable: passes — It can be checked against evidence.
- Load-bearing: passes — The paper’s conclusions depend on it.
- Based: passes — The paper gives a reason why it holds.
- Rests on an assumption not shown here.
In the paper
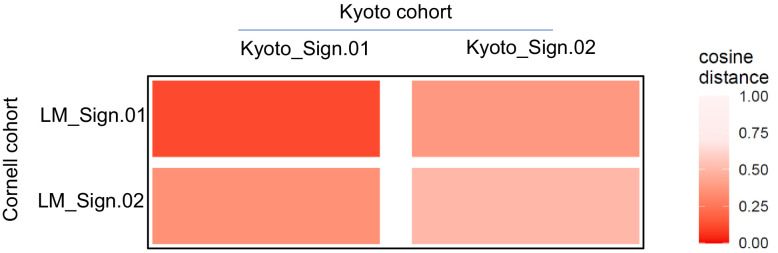
“We analyzed a published targeted genomic sequencing dataset derived from 44 patients diagnosed as PTCL with TFH phenotype (Kyoto cohort)(Watatani et al., 2019). This analysis unfolded two major de novo mutational signatures (Kyoto_Sign.01 and Kyoto_Sign.02).”
§ Mutation analysis links angioimmunoblastic T-cell lymphoma to clonal hematopoiesis and smoking > Results > Late mutations in AITL/PTCL-NOS are enriched for C>A transversion substitutions possibly associated with smoking
What the sources say
- Check pendingcites Watatani et al., 2019 source
plainn = 44- Asserted: passes — The authors put it forward as true.
- Checkable: passes — It can be checked against evidence.
- Load-bearing: passes — The paper’s conclusions depend on it.
- Based: passes — The paper gives a reason why it holds.
- It may state two separate claims as one. 37
- Probably not a substantial claim. 22
Create a free account to see these claims.
Create a free account to see these assumptions.
76 more claims
Create a free account to see all 135 claims and to verify the 32 references still open.
Self-check
Percentages, sums and reported differences re-computed from the paper’s own numbers.
Each contradiction between two passages listed here was confirmed by an independent check.
Rated major: it would touch a result — a value a result rests on, reported and recomputed p-values on opposite sides of the significance level, two passages that conflict with no sign which is right, or a cited work retracted before this paper was published.
In the paper
§ Mutation analysis links angioimmunoblastic T-cell lymphoma to clonal hematopoiesis and smoking > Results > Impact of destructive TET2 mutations on development of multiple hematologic malignancies
“The cases that did not meet these two criteria were assigned to the second subgroup (n = 36).”
§ Mutation analysis links angioimmunoblastic T-cell lymphoma to clonal hematopoiesis and smoking > Results > Impact of destructive TET2 mutations on development of multiple hematologic malignancies
“Further analysis shows that specificity and sensitivity of this CHN biomarker reach 97.2 and 72.7%, respectively, with 88.9% of positive predictive value (PPV) and 92.1% of negative predictive value (NPV).”
Citations
Cites
WHO Classification of Tumours of Haematopoietic and Lymphoid Tissues
Swerdlow, S. H. (2017) · Medical Entomology and Zoology · Cited by 12,933
Signatures of mutational processes in human cancer
Initiative, A. P. C. G., Alexandrov, L. B., ICGC Breast Cancer Consortium, ICGC MMML-Seq Consortium, PedBrain, I., Nik-Zainal, S., Wedge, D. C., Aparicio, S. A. J. R., Behjati, S., Biankin, A. V., et al. (2013) · Nature · doi:10.1038/nature12477 · Cited by 9,660
The 2016 revision of the World Health Organization classification of lymphoid neoplasms
Swerdlow, S. H., Campo, E., Pileri, S. A., Harris, N. L., Stein, H., Siebert, R., Advani, R., Ghielmini, M., Salles, G. A., Zelenetz, A. D., et al. (2016) · Blood · doi:10.1182/blood-2016-01-643569 · Cited by 7,831
Age-related clonal hematopoiesis associated with adverse outcomes
Jaiswal, S., Fontanillas, P., Flannick, J., Manning, A., Grauman, P. V., Mar, B. G., Lindsley, R. C., Mermel, C. H., Burtt, N., Chavez, A., et al. (2014) · New England Journal of Medicine · doi:10.1056/nejmoa1408617 · Cited by 4,841
Clonal hematopoiesis and blood-cancer risk inferred from blood DNA sequence
Genovese, G., Kähler, A. K., Handsaker, R. E., Lindberg, J., Rose, S. A., Bakhoum, S. F., Chambert, K., Mick, E., Neale, B. M., Fromer, M., et al. (2014) · New England Journal of Medicine · doi:10.1056/nejmoa1409405 · Cited by 3,531
Standards and Guidelines for the Interpretation and Reporting of Sequence Variants in Cancer
Li, M. M., Datto, M., Duncavage, E. J., Kulkarni, S., Lindeman, N. I., Roy, S., Tsimberidou, A. M., Vnencak‐Jones, C. L., Wolff, D. J., Younes, A., et al. (2016) · Journal of Molecular Diagnostics · doi:10.1016/j.jmoldx.2016.10.002 · Cited by 2,113
Morin, R. D., Johnson, N. A., Severson, T. M., Mungall, A. J., An, J., Goya, R., Paul, J. E., Boyle, M., Woolcock, B. W., Kuchenbauer, F., et al. (2010) · Nature Genetics · doi:10.1038/ng.518 · Cited by 1,521
Clonal hematopoiesis in human aging and disease
Jaiswal, S., & Ebert, B. L. (2019) · Science · doi:10.1126/science.aan4673 · Cited by 1,156
Mutational signatures associated with tobacco smoking in human cancer
Alexandrov, L. B., Ju, Y. S., Haase, K., Van Loo, P., Martincorena, I., Nik-Zainal, S., Totoki, Y., Fujimoto, A., Nakagawa, H., Shibata, T., et al. (2016) · Science · doi:10.1126/science.aag0299 · Cited by 1,100 · cited 2×
“8% of non- smokers with lung cancers (Alexandrov et al., 2016).”
BackgroundQuivoron, C., Couronné, L., Della Valle, V., Lopez, C. K., Plo, I., Wagner-Ballon, O., Do Cruzeiro, M., Delhommeau, F., Arnulf, B., Stern, M.-H., et al. (2011) · Cancer Cell · doi:10.1016/j.ccr.2011.06.003 · Cited by 924
Research works printed but not linked: 1
- Cheng, 2017, Targeted sequencing of recurrently mutated genes in myeloid neoplasms using the Raindance Thunderstorm-Illumina Miseq Platform: My Heme (Myeloid Hematologic Malignancy) Panel (abstract, The Journal of Molecular Diagnostics, 19
Cited by
Zhao, A., Zhou, H., Yang, J., Li, M., & Niu, T. (2023) · Signal Transduction and Targeted Therapy · doi:10.1038/s41392-023-01342-6 · Cited by 154
Andrades, Á., Peinado, P., Álvarez-Pérez, J. C., Sanjuán‐Hidalgo, J., García, D. J., Arenas, A. M., Matia‐González, A. M., & Medina, P. P. (2023) · Molecular Cancer · doi:10.1186/s12943-023-01736-8 · Cited by 82
Aggressive Lymphoma after CD19 CAR T-Cell Therapy
Kobbe, G., Brüggemann, M., Baermann, B., Wiegand, L., Trautmann, H., Yousefian, S., Libertini, S., Menssen, H. D., Maier, H. J., Ulrich, P. C., et al. (2024) · New England Journal of Medicine · doi:10.1056/nejmoa2402730 · Cited by 64
T-cell lymphomas in recipients of CAR-T cells: assessing risks and causalities
Hu, J., & Dunbar, C. E. (2024) · Blood · doi:10.1182/blood.2024025828 · Cited by 37
Filipek-Gorzała, J., Kwiecińska, P., Szade, A., & Szade, K. (2024) · Frontiers in Oncology · doi:10.3389/fonc.2024.1308709 · Cited by 25
Metadata
- Authors
- Cheng, S., Zhang, W., Inghirami, G., & Tam, W.
- Affiliations
- Weill Cornell Medicine (US)
- Corresponding author
- Tam, Wayne
- Venue
- eLife
- Publisher
- eLife Sciences Publications, Ltd
- Published
- 2021-09-29
- Volume
- 10
- ISSN
- 2050-084X (ISSN-L)
- PMC
- PMC8480981
- OpenAlex
- W3202146560
- Cited by
- 37
- References
- 50
- Citations by year
- 2026: 5 · 2025: 6 · 2024: 9 · 2023: 12 · 2022: 5
- FWCI
- 5.70
- Type
- journal article
- Language
- en
- Open access
- gold
- doi.org
- Licence
- Locations
- eLife (publishedVersion, cc-by)
- medRxiv (submittedVersion)
- Europe PMC (PubMed Central) (publishedVersion, cc-by)
- PubMed (publishedVersion)
- PubMed Central (publishedVersion, cc-by)
- DOAJ (DOAJ: Directory of Open Access Journals) (submittedVersion, cc-by-sa)
- Funders
- National Cancer Institute (R01 CA194547)
- Topics
- Health Sciences › Medicine › Pathology and Forensic Medicine › Lymphoma Diagnosis and Treatment
- Health Sciences › Medicine › Hematology › Acute Myeloid Leukemia Research
- Health Sciences › Medicine › Dermatology › Cutaneous lymphoproliferative disorders research
- Keywords
- angioimmunoblastic T-cell lymphoma, peripheral T-cell lymphoma, not otherwise specified, clonal hematopoiesis, smoking, mutational signatures, APOBEC mutagenesis, allele burden, diffuse large B-cell lymphoma, myeloid neoplasms, lymphomagenesis, risk stratification biomarkers
- MeSH terms
- Tobacco Smoking, Clonal Hematopoiesis, DNA Mutational Analysis, Female, Humans, Immunoblastic Lymphadenopathy, Male, Mutation, Lymphoma, T-Cell, Gene Expression Profiling
About these checks
Registry, retraction, Cites and statistics results are computed, not judged, with one exception: a printed reference that no index lists is read once by a model before it counts as a citation error. Claims are extracted by a model and kept only when their quote appears verbatim in the text; each cited source is then checked, with a model’s help, for whether it says what the claim relies on. Those verdicts can be wrong — read the claim’s quote and the cited source before relying on one.
A language model drew the claims from the paper on 2026-11-12, under version 3 of the claim definition (model deepseek-v4.1-flash, prompt extract-v3).
A second model labelled each claim on 2026-11-12 (model jev-1.13-20260917, definition revision gold-guideline-v0.2).
Statistics and arithmetic are recomputed, not judged.
Confidence bands are shown only for fields calibrated on our annotated test set. None is calibrated yet, so no band is shown.
What counts as a claim ›How we measure confidence ›How we check this ›
Are you an author, or do you see a problem with this page? Request a review
How to cite
Cite CoChat for the checks on this page, and the paper for its own findings.
- This page
- CoChat. (2026). Citation check: Mutation analysis links angioimmunoblastic T-cell lymphoma to clonal hematopoiesis and smoking. https://app.cochat.ai/papers/10.7554/elife.66395
- The paper
- Cheng, S., Zhang, W., Inghirami, G., & Tam, W. (2021). Mutation analysis links angioimmunoblastic T-cell lymphoma to clonal hematopoiesis and smoking. eLife. https://doi.org/10.7554/elife.66395
