

Human Biosample Authentication Using the High-Throughput, Cost-Effective SNPtraceTM System
Open accessThe DOI matches its Crossref record; 51 of the 53 references it cites were found in a registry or an index.
Abstract
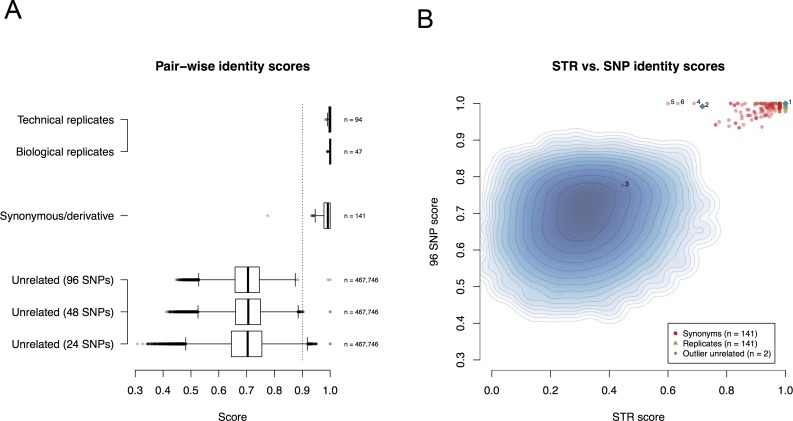
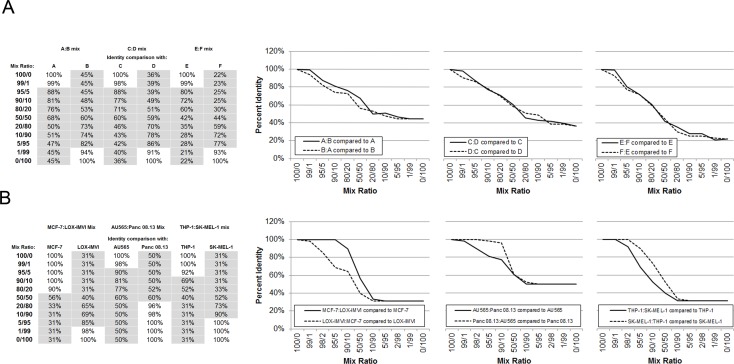
Cell lines are the foundation for much of the fundamental research into the mechanisms underlying normal biologic processes and disease mechanisms. It is estimated that 15%-35% of human cell lines are misidentified or contaminated, resulting in a huge waste of resources and publication of false or misleading data. Here we evaluate a panel of 96 single-nucleotide polymorphism (SNP) assays utilizing Fluidigm microfluidics technology for authentication and sex determination of human cell lines. The SNPtrace Panel was tested on 907 human cell lines. Pairwise comparison of these data show the SNPtrace Panel discriminated among identical, related and unrelated pairs of samples with a high degree of confidence, equivalent to short tandem repeat (STR) profiling. We also compared annotated sex calls with those determined by the SNPtrace Panel, STR and Illumina SNP arrays, revealing a high number of male samples are identified as female due to loss of the Y chromosome. Finally we assessed the sensitivity of the SNPtrace Panel to detect intra-human cross-contamination, resulting in detection of as little as 2% contaminating cell population. In conclusion, this study has generated a database of SNP fingerprints for 907 cell lines used in biomedical research and provides a reliable, fast, and economic alternative to STR profiling which can be applied to any human cell line or tissue sample.
Overview
The claims and statistics of this paper haven’t been checked yet.
Free: it reads the open-access text and checks the first 5 claims that cite a source we can check. Create a free account to check every claim.
Integrity signals
Registry
Cites
Statistics
Figures
Verification
Claims the paper makes
The claims and statistics of this paper haven’t been checked yet.
Free: it reads the open-access text and checks the first 5 claims that cite a source we can check. Create a free account to check every claim.
Claims other papers make about this one
Each is checked against this paper’s own text: does it say what the citing paper says it does?
The source backs part of the claim, not all of it — or backs it for a different population, condition or comparison.
In the citing paper
“In addition, authors are expected to check overviews of misidentified cells (such as [12, 15, 27, 31]) before conducting their experiments.”
From The ghosts of HeLa: How cell line misidentification contaminates the scientific literature (2017) · cites this paper as [31]
Experimental — accuracy not yet measuredThe source backs part of the claim, not all of it — or backs it for a different population, condition or comparison.
In the citing paper
“These thresholds were chosen to account for minor drift, such as the loss of the Y chromosome in culture, that is observed in about 45% of male-derived cell lines [45], or the occurrence of extra alleles and microsatellite instability, while still identifying biologically significant divergence [32].”
From Genetic Insights into the Economic Toll of Cell Line Misidentification: A Comprehensive Review (2026) · cites this paper as [45]
Experimental — accuracy not yet measuredThe check wasn’t confident either way, so it gives no verdict — never disputed.
In the citing paper
“We concluded that the STR and SNP profiles previously reported for M14 and MDA‐MB‐4354, 5, 16 correspond to serum from the M14 donor, a synonymous lymphoblastoid cell line, and samples of M14 cryopreserved the year before MDA‐MB‐435 was established.”
From Authentication of M14 melanoma cell line proves misidentification of MDA‐MB‐435 breast cancer cell line (2018) · cites this paper as [16]
Experimental — accuracy not yet measured
Self-check
Percentages, sums and reported differences re-computed from the paper’s own numbers.
The self-check needs the paper’s full text.
Citations
Cites
6 retracted
Retracted: Marker-independent identification of glioma-initiating cells
Clément, V., Marino, D., Cudalbu, C., Hamou, M., Mlynárik, V., de Tribolet, N., Dietrich, P., Rolf Gruetter, A., Hegi, M. E., & Radovanovic, I. (2010) · Nature Methods · doi:10.1038/nmeth.1430 · Cited by 81
RetractedLinger, R. M. A., DeRyckere, D., Brandão, L., Sawczyn, K. K., Jacobsen, K. M., Liang, X., Keating, A. K., & Graham, D. K. (2009) · Blood · doi:10.1182/blood-2009-03-209247 · Cited by 32
RetractedGao, L., Wu, G., Liu, B., Shen, M., Pan, T., Yu, C.-G., Wang, Q., Ru, Y., Liu, X., Niu, T., et al. (2013) · PLoS ONE · doi:10.1371/journal.pone.0084127 · Cited by 13
RetractedRetraction Note: Marker-independent identification of glioma-initiating cells
Clément, V., Marino, D., Cudalbu, C., Hamou, M., Mlynárik, V., de Tribolet, N., Dietrich, P., Rolf Gruetter, A., Hegi, M. E., & Radovanovic, I. (2013) · Nature Methods · doi:10.1038/nmeth1013-1035c · Cited by 5
Retracted- Retracted
Gao, L., Wu, G., Liu, B., Shen, M., Pan, T., Yu, C.-G., Wang, Q., Ru, Y., Liu, X.-P., Niu, T., et al. (2014) · PLoS ONE · doi:10.1371/journal.pone.0095904 · Cited by 2
RetractedRecurrent R-spondin fusions in colon cancer
Seshagiri, S., Stawiski, E. W., Durinck, S., Modrusan, Z., Storm, E. E., Conboy, C. B., Chaudhuri, S., Guan, Y., Janakiraman, V., Jaiswal, B. S., et al. (2012) · Nature · doi:10.1038/nature11282 · Cited by 960 · cited 1×
“2 million SNP positions following methods published previously [24,25].”
MethodSelf-citationCheck your cultures! A list of cross‐contaminated or misidentified cell lines
Capes‐Davis, A., Theodosopoulos, G., Atkin, I., Drexler, H. G., Kohara, A., MacLeod, R. A. F., Masters, J. R., Nakamura, Y., Reid, Y. A., Reddel, R. R., et al. (2010) · International Journal of Cancer · doi:10.1002/ijc.25242 · Cited by 520 · cited 3×
“STR analysis is the ANSI standard for profiling cell lines.”
MethodInfluentialA multiplex assay with 52 single nucleotide polymorphisms for human identification
Sanchez, J. J., Phillips, C., Børsting, C., Balogh, K., Bogus, M., Fondevila, M., Harrison, C. D., Musgrave‐Brown, E., Salas, A., Syndercombe‐Court, D., et al. (2006) · ELECTROPHORESIS · doi:10.1002/elps.200500671 · Cited by 516
Short tandem repeat profiling provides an international reference standard for human cell lines
Masters, J. R., Thomson, J. A., Daly-Burns, B., Reid, Y. A., Dirks, W. G., Packer, P., Toji, L. H., Ohno, T., Tanabe, H., Arlett, C. F., et al. (2001) · Proceedings of the National Academy of Sciences · doi:10.1073/pnas.121616198 · Cited by 478 · cited 1×
“STRs are the ANSI standard for cell line authentication [12,13,32].”
Background
Cited by
Dijkstra, K. K., Cattaneo, C. M., Weeber, F., Chalabi, M., van de Haar, J., Fanchi, L. F., Slagter, M., van der Velden, D. L., Kaing, S., Kelderman, S., et al. (2018) · Cell · doi:10.1016/j.cell.2018.07.009 · Cited by 1,135
“An identity score was calculated as described by (Tanabe et al., 1999) and (Liang-Chu et al., 2015).”
MethodOoft, S. N., Weeber, F., Dijkstra, K. K., McLean, C. M., Kaing, S., van Werkhoven, E., Schipper, L., Hoes, L., Vis, D. J., van de Haar, J., et al. (2019) · Science Translational Medicine · doi:10.1126/scitranslmed.aay2574 · Cited by 813
“Identity scores of tumor DNA versus DNA obtained from healthy blood were computed as described elsewhere (29).”
MethodStudying both sexes: a guiding principle for biomedicine
Clayton, J. A. (2016) · The FASEB Journal · doi:10.1096/fj.15-279554 · Cited by 358
The ghosts of HeLa: How cell line misidentification contaminates the scientific literature
Horbach, S. P. J. M., & Halffman, W. (2017) · PLOS ONE · doi:10.1371/journal.pone.0186281 · Cited by 167
“In addition, authors are expected to check overviews of misidentified cells (such as [12, 15, 27, 31]) before conducting their experiments.”
BackgroundGuidance Document on Good In Vitro Method Practices (GIVIMP)
OECD (2018) · OECD Series on Testing and Assessment · doi:10.1787/9789264304796-en · Cited by 161
Metadata
- Authors
- Liang-Chu, M. M. Y., Yu, M., Haverty, P. M., Koeman, J., Ziegle, J., Lee, M., Bourgon, R., & Neve, R. M.
- Affiliations
- Genentech (US)
- Van Andel Institute (US)
- Standard BioTools (United States) (US)
- Corresponding author
- Neve, Richard M.
- Venue
- PLOS ONE
- Publisher
- Public Library of Science (PLoS)
- Published
- 2015-02-25
- Volume
- 10
- Issue
- 2
- Pages
- e0116218
- ISSN
- 1932-6203 (ISSN-L)
- PMC
- PMC4340925
- OpenAlex
- W2016986478
- Cited by
- 62
- References
- 53
- Citations by year
- 2026: 5 · 2025: 4 · 2024: 3 · 2023: 6 · 2022: 2 · 2021: 5 · 2020: 3 · 2019: 3 · 2018: 18 · 2017: 7 · 2016: 4 · 2015: 2
- FWCI
- 7.06
- Type
- journal article
- Language
- en
- Open access
- gold
- doi.org
- Licence
- Locations
- PLoS ONE (publishedVersion, cc-by)
- Europe PMC (PubMed Central) (publishedVersion, cc-by)
- PubMed Central (publishedVersion, cc-by)
- PubMed (publishedVersion)
- DOAJ (DOAJ: Directory of Open Access Journals) (submittedVersion, cc-by-sa)
- Figshare (submittedVersion, cc-by)
- Topics
- Life Sciences › Biochemistry, Genetics and Molecular Biology › Genetics › Forensic and Genetic Research
- Life Sciences › Biochemistry, Genetics and Molecular Biology › Molecular Biology › Identification and Quantification in Food
- Life Sciences › Biochemistry, Genetics and Molecular Biology › Molecular Biology › Molecular Biology Techniques and Applications
- Keywords
- cell line authentication, human cell lines, single nucleotide polymorphisms, sex determination, Y chromosome loss, short tandem repeat profiling, cell line misidentification
- MeSH terms
- Cell Line, Female, Genotype, Humans, Male, Sex Determination Analysis, In Situ Hybridization, Fluorescence, Biological Specimen Banks, Microsatellite Repeats, Polymorphism, Single Nucleotide, Spectral Karyotyping, DNA Barcoding, Taxonomic
About these checks
Registry, retraction, Cites and statistics results are computed, not judged, with one exception: a printed reference that no index lists is read once by a model before it counts as a citation error. Claims are extracted by a model and kept only when their quote appears verbatim in the text; each cited source is then checked, with a model’s help, for whether it says what the claim relies on. Those verdicts can be wrong — read the claim’s quote and the cited source before relying on one.
Statistics and arithmetic are recomputed, not judged.
Confidence bands are shown only for fields calibrated on our annotated test set. None is calibrated yet, so no band is shown.
What counts as a claim ›How we measure confidence ›How we check this ›
Are you an author, or do you see a problem with this page? Request a review
How to cite
Cite CoChat for the checks on this page, and the paper for its own findings.
- This page
- CoChat. (2026). Citation check: Human Biosample Authentication Using the High-Throughput, Cost-Effective SNPtraceTM System. https://app.cochat.ai/papers/10.1371/journal.pone.0116218
- The paper
- Liang-Chu, M. M. Y., Yu, M., Haverty, P. M., Koeman, J., Ziegle, J., Lee, M., Bourgon, R., & Neve, R. M. (2015). Human Biosample Authentication Using the High-Throughput, Cost-Effective SNPtraceTM System. PLOS ONE. https://doi.org/10.1371/journal.pone.0116218
Data sources
Bibliographic data: Semantic Scholar, OpenAlex, Crossref.
Contains information from the Semantic Scholar Academic Graph Datasets, made available under the ODC Attribution License (ODC-BY 1.0).
Semantic Scholar’s data is described in: Kinney, R., et al. (2023). The Semantic Scholar Open Data Platform. arXiv:2301.10140.
