

The DOI matches its Crossref record; 92 of the 93 references it cites were found in a registry or an index.
Identification of Real MicroRNA Precursors with a Pseudo Structure Status Composition Approach
Open accessAbstract
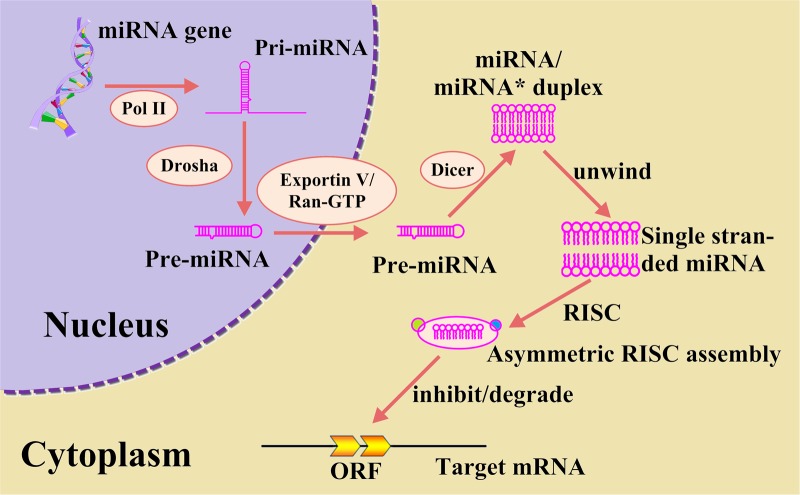
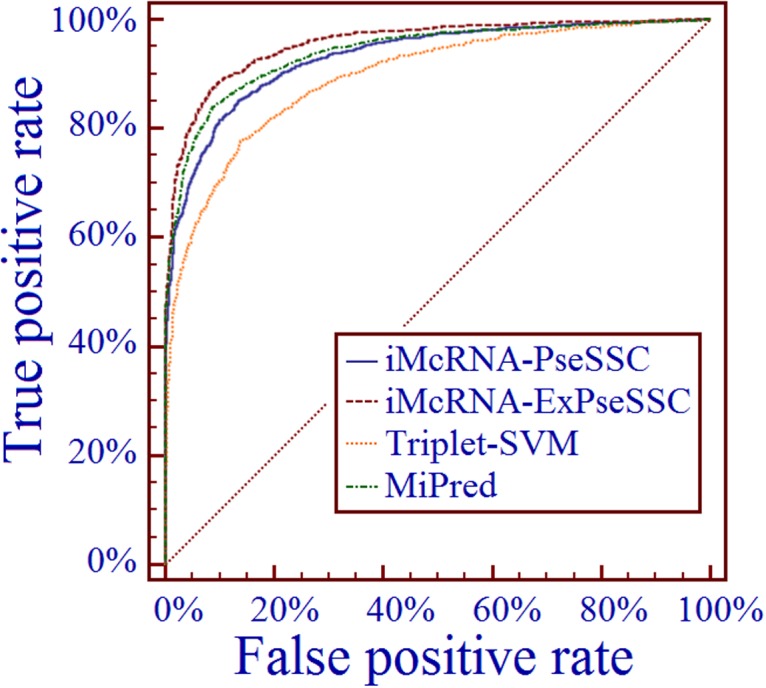
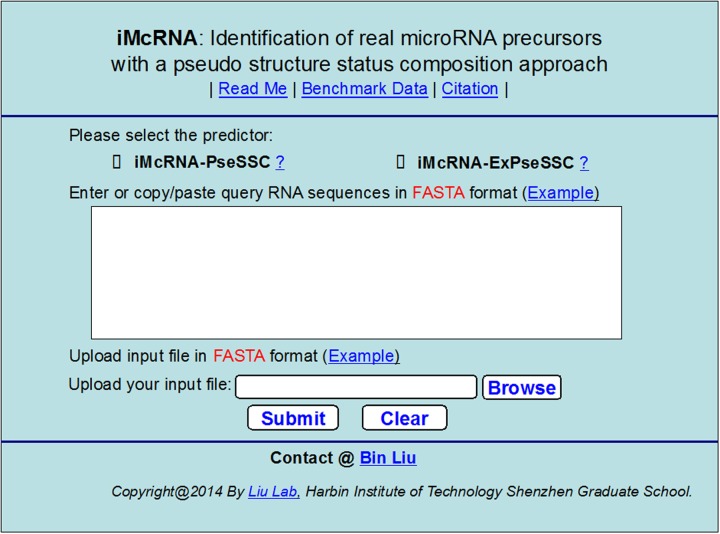
Containing about 22 nucleotides, a micro RNA (abbreviated miRNA) is a small non-coding RNA molecule, functioning in transcriptional and post-transcriptional regulation of gene expression. The human genome may encode over 1000 miRNAs. Albeit poorly characterized, miRNAs are widely deemed as important regulators of biological processes. Aberrant expression of miRNAs has been observed in many cancers and other disease states, indicating they are deeply implicated with these diseases, particularly in carcinogenesis. Therefore, it is important for both basic research and miRNA-based therapy to discriminate the real pre-miRNAs from the false ones (such as hairpin sequences with similar stem-loops). Particularly, with the avalanche of RNA sequences generated in the postgenomic age, it is highly desired to develop computational sequence-based methods in this regard. Here two new predictors, called "iMcRNA-PseSSC" and "iMcRNA-ExPseSSC", were proposed for identifying the human pre-microRNAs by incorporating the global or long-range structure-order information using a way quite similar to the pseudo amino acid composition approach. Rigorous cross-validations on a much larger and more stringent newly constructed benchmark dataset showed that the two new predictors (accessible at http://bioinformatics.hitsz.edu.cn/iMcRNA/) outperformed or were highly comparable with the best existing predictors in this area.
Overview
The claims and statistics of this paper haven’t been checked yet.
Run the check — free, no account needed. It reads the open-access text and checks the sources it cites.
Integrity signals
Registry
Cites
Statistics
Figures
Verification
Claims the paper makes
The claims and statistics of this paper haven’t been checked yet.
Run the check — free, no account needed. It reads the open-access text and checks the sources it cites.
Claims other papers make about this one
Each is checked against this paper’s own text: does it say what the citing paper says it does?
In the citing paper
“Most works in bioinformatics [41,46,47,48,49,50,51,52,53,54,55,56,57,58,59] also use SVM for classification.”
From An Efficient Classifier for Alzheimer’s Disease Genes Identification (2018) · cites this paper as [46]
Self-check
Percentages, sums and reported differences re-computed from the paper’s own numbers.
The self-check needs the paper’s full text.
Citations
Cites
LIBSVM: A library for support vector machines
Chang, C.-C., & Lin, C.-J. (2011) · ACM Transactions on Intelligent Systems and Technology · doi:10.1145/1961189.1961199 · Cited by 40,918
Wu, Y., & Vapnik, V. N. (1999) · Technometrics · doi:10.2307/1271368 · Cited by 27,236
An Introduction to Support Vector Machines and Other Kernel-based Learning Methods
Cristianini, N., & Shawe-Taylor, J. (2000) · doi:10.1017/cbo9780511801389 · Cited by 13,855
Cd-hit: a fast program for clustering and comparing large sets of protein or nucleotide sequences
Li, W.-Z., & Godzik, A. (2006) · Bioinform. · doi:10.1093/bioinformatics/btl158 · Cited by 10,996
The nuclear RNase III Drosha initiates microRNA processing
Lee, Y., Ahn, C., Han, J., Choi, H., Kim, J., Yim, J., Lee, J., Provost, P., Rådmark, O., Kim, S., et al. (2003) · Nature · doi:10.1038/nature01957 · Cited by 5,299
Role for a bidentate ribonuclease in the initiation step of RNA interference
Bernstein, E., Caudy, A. A., Hammond, S. M., & Hannon, G. J. (2001) · Nature · doi:10.1038/35053110 · Cited by 5,018
MicroRNA genes are transcribed by RNA polymerase II
Lee, Y., Kim, M., Han, J., Yeom, K.-H., Lee, S., Baek, S. H., & Kim, V. N. (2004) · The EMBO Journal · doi:10.1038/sj.emboj.7600385 · Cited by 4,556
miRBase: integrating microRNA annotation and deep-sequencing data
Kozomara, A., & Griffiths-Jones, S. (2011) · Nucleic Acids Research · doi:10.1093/nar/gkq1027 · Cited by 3,634
Exportin-5 mediates the nuclear export of pre-microRNAs and short hairpin RNAsPreprint
Yi, R., Qin, Y., Macara, I. G., & Cullen, B. R. (2003) · Genes & Development · doi:10.1101/gad.1158803 · Cited by 3,158
Hutvágner, G., McLachlan, J., Pasquinelli, A. E., Bálint, E., Tuschl, T., & Zamore, P. D. (2001) · Science · doi:10.1126/science.1062961 · Cited by 2,781
Research works printed but not linked: 1
- SX Lin, 2013, Theoretical and experimental biology in one, J Biomedical Science and Engineering, 6, 435
Cited by
Sorted by citations
Items 101–200 of 238
Ma, X., Guo, J., & Sun, X. S. (2016) · PLoS ONE · doi:10.1371/journal.pone.0167345 · Cited by 50
Effective DNA binding protein prediction by using key features via Chou’s general PseAAC
Adilina, S., Farid, D. M., & Shatabda, S. (2018) · Journal of Theoretical Biology · doi:10.1016/j.jtbi.2018.10.027 · Cited by 49
HMMBinder: DNA-Binding Protein Prediction Using HMM Profile Based Features
Zaman, R., Chowdhury, S. Y., Rashid, M. A., Sharma, A. K., Dehzangi, A., & Shatabda, S. (2017) · BioMed Research International · doi:10.1155/2017/4590609 · Cited by 48
He, X., Han, K., Hu, J. S., Yan, H., Yang, J.-Y., Shen, H., & Yu, D. (2015) · The Journal of Membrane Biology · doi:10.1007/s00232-015-9811-z · Cited by 48
Srivastava, A., Kumar, R., & Kumar, M. (2018) · Journal of Theoretical Biology · doi:10.1016/j.jtbi.2018.08.030 · Cited by 46
Mei, J., Fu, Y., & Zhao, J. J. (2018) · Journal of Theoretical Biology · doi:10.1016/j.jtbi.2018.07.040 · Cited by 45
Chiu, C., Wu, C.-M., Chien, T.-N., Kao, L., Li, C., & Chu, C.-M. (2023) · International Journal of Environmental Research and Public Health · doi:10.3390/ijerph20054340 · Cited by 50
Niu, B., Liang, C., Lu, Y., Zhao, M., Chen, Q., Zhang, Y., Zheng, L., & Chou, K. (2019) · Genomics · doi:10.1016/j.ygeno.2019.05.024 · Cited by 44
Self-citationBP Neural Network Could Help Improve Pre-miRNA Identification in Various Species
Jiang, L., Zhang, J., Xuan, P., & Zou, Q. (2016) · BioMed Research International · doi:10.1155/2016/9565689 · Cited by 43
Predicting novel microRNA: a comprehensive comparison of machine learning approaches
Stegmayer, G. S., Persia, L. E. D., Rubiolo, M., Gerard, M. F., Pividori, M., Yones, C., Bugnon, L. A., Rodriguez, T., Raad, J., & Milone, D. H. (2018) · Briefings in Bioinformatics · doi:10.1093/bib/bby037 · Cited by 42
Improved Pre-miRNAs Identification Through Mutual Information of Pre-miRNA Sequences and Structures
Fu, X., Zhu, W. Q., Cai, L., Liao, B., Peng, L., Chen, Y., & Yang, J. (2019) · Frontiers in Genetics · doi:10.3389/fgene.2019.00119 · Cited by 40
Wang, S., & Liu, S. (2015) · International Journal of Molecular Sciences · doi:10.3390/ijms161226237 · Cited by 41
Hameed, S. S., hassan, R. B., & Muhammad, F. F. (2017) · PLoS ONE · doi:10.1371/journal.pone.0187371 · Cited by 43
Learning Multimodal Networks From Heterogeneous Data for Prediction of lncRNA–miRNA Interactions
Hu, P., Huang, Y., Chan, K. C. C., & You, Z. (2019) · IEEE Transactions on Computational Biology and Bioinformatics · doi:10.1109/tcbb.2019.2957094 · Cited by 40
Tang, W., Liao, Z., & Zou, Q. (2016) · Oncotarget · doi:10.18632/oncotarget.12828 · Cited by 39
Pan, Y., Wang, S., Zhang, Q., Lu, Q., Su, D., Zuo, Y., & Yang, L. (2018) · Journal of Theoretical Biology · doi:10.1016/j.jtbi.2018.11.010 · Cited by 39
Jiao, Y.-S., & Du, P.-F. (2015) · Journal of Theoretical Biology · doi:10.1016/j.jtbi.2015.11.009 · Cited by 39
Impacts of Pseudo Amino Acid Components and 5-steps Rule to Proteomics and Proteome Analysis
Chou, K. (2019) · Current Topics in Medicinal Chemistry · doi:10.2174/1568026619666191018100141 · Cited by 38
Self-citationProtein fold recognition using HMM–HMM alignment and dynamic programming
Lyons, J., Paliwal, K. K., Dehzangi, A., Heffernan, R., Tsunoda, T., & Sharma, A. K. (2016) · Journal of Theoretical Biology · doi:10.1016/j.jtbi.2015.12.018 · Cited by 38
Liang, Y., & Zhang, S. (2018) · Journal of Theoretical Biology · doi:10.1016/j.jtbi.2018.05.035 · Cited by 38
Selecting Essential MicroRNAs Using a Novel Voting Method
Ru, X., Cao, P., Li, L., & Zou, Q. (2019) · Molecular Therapy — Nucleic Acids · doi:10.1016/j.omtn.2019.07.019 · Cited by 38
Ju, Z., Cao, J.-Z., & Gu, H. (2015) · Journal of Theoretical Biology · doi:10.1016/j.jtbi.2015.07.030 · Cited by 35
Identification of DNA-binding proteins by auto-cross covariance transformation
Dong, Q., Wang, S., Wang, K., Liu, X., & Liu, B. (2015) · IEEE International Conference on Bioinformatics and Biomedicine (BIBM) · doi:10.1109/bibm.2015.7359730 · Cited by 35
Self-citationLiu, G., Shen, H., & Yu, D. (2015) · The Journal of Membrane Biology · doi:10.1007/s00232-015-9856-z · Cited by 35
An efficient method for protein function annotation based on multilayer protein networks
Zhao, B., Hu, S., Li, X., Zhang, F., Tian, Q., & Ni, W. (2016) · Human Genomics · doi:10.1186/s40246-016-0087-x · Cited by 35
Wahid, A. M. S., Khan, D. M., Iqbal, N., Khan, S. A., Ali, A., Khan, M., & Khan, Z. (2020) · Chemometrics and Intelligent Laboratory Systems · doi:10.1016/j.chemolab.2020.103958 · Cited by 35
Zhang, J., Yang, H. J., Huang, T., Yang, S., & Chen, L. (2016) · Neurocomputing · doi:10.1016/j.neucom.2015.09.136 · Cited by 33
LNRLMI: Linear neighbour representation for predicting lncRNA‐miRNA interactions
Wong, L., Huang, Y., You, Z., Chen, Z., & Cao, M. (2019) · Journal of Cellular and Molecular Medicine · doi:10.1111/jcmm.14583 · Cited by 33
Tyagi, A., Nigam, D., V., A. M. S., Solanke, A. U., Singh, N. K., Sharma, T. R., & Gaikwad, K. (2017) · Plant Biotechnology Journal · doi:10.1111/pbi.12866 · Cited by 33
Zhang, S., Yang, K., Lei, Y., & Song, K. (2018) · Genomics · doi:10.1016/j.ygeno.2018.11.031 · Cited by 32
Kabir, M., Iqbal, M. J., Ahmad, S., & Hayat, M. (2015) · Computers in Biology and Medicine · doi:10.1016/j.compbiomed.2015.09.010 · Cited by 32
Application of Machine Learning Approaches for the Design and Study of Anticancer Drugs
Hu, Y., Lu, Y., Wang, S., Zhang, M., Qu, X., & Niu, B. (2018) · Current Drug Targets · doi:10.2174/1389450119666180809122244 · Cited by 32
mLASSO-Hum: A LASSO-based interpretable human-protein subcellular localization predictor
Wan, S., Mak, M., & Kung, S. (2015) · Journal of Theoretical Biology · doi:10.1016/j.jtbi.2015.06.042 · Cited by 32
mGOF-loc: A novel ensemble learning method for human protein subcellular localization prediction
Wei, L., Liao, M., Gao, X. H., Wang, J., & Lin, W. (2016) · Neurocomputing · doi:10.1016/j.neucom.2015.09.137 · Cited by 32
A balanced secondary structure predictor
Islam, M. N., Iqbal, S., Katebi, A., & Hoque, M. T. (2015) · Journal of Theoretical Biology · doi:10.1016/j.jtbi.2015.10.015 · Cited by 31
Prediction of MicroRNA Subcellular Localization by Using a Sequence-to-Sequence Model
Xiao, Y., Cai, J., Yang, Y., Zhao, H., & Shen, H. (2018) · Proceedings · doi:10.1109/icdm.2018.00181 · Cited by 31
Kumar, R., Kumari, B., & Kumar, M. (2017) · Mitochondrion · doi:10.1016/j.mito.2017.10.004 · Cited by 30
Identification and characterization of WD40 superfamily genes in peach
Feng, R., Zhang, C., Ma, R., Cai, Z., Lin, Y., & Yu, M. (2019) · Gene · doi:10.1016/j.gene.2019.06.010 · Cited by 30
The Multiple Applications and Possible Mechanisms of the Hyperbaric Oxygenation Therapy
Wan, C., Liang, X., Nong, Z., Li, Y., Pan, X., Chen, C., & Huang, L. (2019) · Medicinal Chemistry · doi:10.2174/1573406415666181219101328 · Cited by 30
GNMFLMI: Graph Regularized Nonnegative Matrix Factorization for Predicting LncRNA-MiRNA Interactions
Wang, M.-N., You, Z., Li, L.-P., Wong, L., Chen, Z., & Cheng-zhi, G. (2020) · IEEE Access · doi:10.1109/access.2020.2974349 · Cited by 30
Li, J., Shi, X., You, Z., Yi, H.-C., Chen, Z., Lin, Q., & Fang, M. (2020) · IEEE Transactions on Computational Biology and Bioinformatics · doi:10.1109/tcbb.2020.2965919 · Cited by 30
Recombination spot identification Based on gapped k-mers
Wang, R., Xu, Y. D., & Liu, B. (2016) · Scientific Reports · doi:10.1038/srep23934 · Cited by 29
Self-citationRetractedPredicting protein structural classes based on complex networks and recurrence analysis
Olyaee, M. H., Yaghoubi, A. A., & Yaghoobi, M. (2016) · Journal of Theoretical Biology · doi:10.1016/j.jtbi.2016.06.018 · Cited by 29
Lasantha, D., Vidanagamachchi, S., & Nallaperuma, S. (2023) · Engineering Applications of Artificial Intelligence · doi:10.1016/j.engappai.2023.106352 · Cited by 28
Accurate prediction of nuclear receptors with conjoint triad feature
Wang, H., & Hu, X. (2015) · BMC Bioinformatics · doi:10.1186/s12859-015-0828-1 · Cited by 29
Alghamdi, W., Alzahrani, E. O., Ullah, M. Z., & Khan, Y. D. (2021) · Analytical Biochemistry · doi:10.1016/j.ab.2021.114385 · Cited by 29
Iqbal, M. J., & Hayat, M. (2016) · Computer Methods and Programs in Biomedicine · doi:10.1016/j.cmpb.2016.02.006 · Cited by 27
Barman, R. K., Mukhopadhyay, A., & Das, S. (2017) · Scientific Reports · doi:10.1038/srep46070 · Cited by 27
Chandra, A. A., Sharma, A. K., Dehzangi, A., & Tsunoda, T. (2019) · BMC Genomics · doi:10.1186/s12864-018-5383-5 · Cited by 26
Wang, S., Wang, Y., Yu, C., Cao, Y., Yao, Y., Pan, Y., Su, D., Lu, Q., Yang, W., Zuo, Y., et al. (2020) · Journal of Cellular and Molecular Medicine · doi:10.1111/jcmm.15205 · Cited by 25
Liu, B. (2016) · Neurocomputing · doi:10.1016/j.neucom.2015.12.138 · Cited by 25
Self-citationPrediction of drug’s Anatomical Therapeutic Chemical (ATC) code by integrating drug–domain network
Chen, F.-S., & Jiang, Z. (2015) · Journal of Biomedical Informatics · doi:10.1016/j.jbi.2015.09.016 · Cited by 25
Liu, G.-H., Zhang, B., Qian, G., Wang, B., Mao, B., & Bichindaritz, I. (2019) · IEEE Transactions on Computational Biology and Bioinformatics · doi:10.1109/tcbb.2019.2917429 · Cited by 23
Deep belief network–Based Matrix Factorization Model for MicroRNA-Disease Associations Prediction
Ding, Y., Wang, F., Lei, X., Liao, B., & Wu, F. (2020) · Evolutionary Bioinformatics · doi:10.1177/1176934320919707 · Cited by 23
Sc-ncDNAPred: A Sequence-Based Predictor for Identifying Non-coding DNA in Saccharomyces cerevisiae
He, W., Ju, Y., Zeng, X., Liu, X., & Zou, Q. (2018) · Frontiers in Microbiology · doi:10.3389/fmicb.2018.02174 · Cited by 22
Impact of Refractive Errors on the Academic Performance of High School Children of Lahore
Latif, M. Z., Hussain, I., Afzal, S., Naveed, M. A., Nizami, R., Shakil, M., Akhtar, A. M., Hussain, S., & Gilani, S. A. (2022) · Frontiers in Public Health · doi:10.3389/fpubh.2022.869294 · Cited by 21
Identification of miRNA, their targets and miPEPs in peanut (Arachis hypogaea L.)
Ram, M. K., Mukherjee, K., & Pandey, D. M. (2019) · Computational Biology and Chemistry · doi:10.1016/j.compbiolchem.2019.107100 · Cited by 20
Liao, Z., Wang, X., Zeng, Y., & Zou, Q. (2016) · Scientific Reports · doi:10.1038/srep39655 · Cited by 20
Self-citationIntrinsic-overlapping co-expression module detection with application to Alzheimer's Disease
Manners, H. N., Roy, S., & Kalita, J. K. (2018) · Computational Biology and Chemistry · doi:10.1016/j.compbiolchem.2018.10.014 · Cited by 20
Protein Remote Homology Detection Based on an Ensemble Learning Approach
Chen, J., Liu, B., & Huang, D. (2016) · BioMed Research International · doi:10.1155/2016/5813645 · Cited by 20
Self-citationPredicting the Mortality of ICU Patients by Topic Model with Machine-Learning Techniques
Wu, C.-M., Chih-Chou, C., Chien, T.-N., Kao, L., & Qiu, J.-T. T. (2022) · Healthcare · doi:10.3390/healthcare10061087 · Cited by 20
Predicting miRNA-disease associations based on PPMI and attention network
Xie, X., Wang, Y., He, K., & Sheng, N. (2023) · BMC Bioinformatics · doi:10.1186/s12859-023-05152-z · Cited by 19
Predicting Disease Related microRNA Based on Similarity and Topology
Chen, Z., Wang, X., Gao, P., Liu, H., & Song, B. (2019) · Cells · doi:10.3390/cells8111405 · Cited by 19
Self-citationDephosSite: a machine learning approach for discovering phosphotase-specific dephosphorylation sites
Wang, X., Yan, R., & Song, J. (2016) · Scientific Reports · doi:10.1038/srep23510 · Cited by 19
Self-citationAn Insightful 10-year Recollection Since the Emergence of the 5-steps Rule
Chou, K. (2019) · Current Pharmaceutical Design · doi:10.2174/1381612825666191129164042 · Cited by 18
Self-citationRetractedWei, L., Bowen, Z., Chen, Z., Gao, X. H., & Liao, M. (2016) · Neurocomputing · doi:10.1016/j.neucom.2016.02.078 · Cited by 18
Shi, H., Zhang, S., & Li, X. (2022) · Briefings in Bioinformatics · doi:10.1093/bib/bbac341 · Cited by 17
BioMedR: an R/CRAN package for integrated data analysis pipeline in biomedical study
Dong, J. N., Zhu, M., Yun, Y., Lü, A., Hou, T., & Cao, D. (2019) · Briefings in Bioinformatics · doi:10.1093/bib/bbz150 · Cited by 17
CPPred-sORF: Coding Potential Prediction of sORF based on non-AUGPreprint
Tong, X., Hong, X., Xie, J., & Liu, S. (2020) · bioRxiv (Cold Spring Harbor Laboratory) · doi:10.1101/2020.03.31.017525 · Cited by 17
Using weighted features to predict recombination hotspots in Saccharomyces cerevisiae
Liu, G., Xing, Y., & Cai, L. (2015) · Journal of Theoretical Biology · doi:10.1016/j.jtbi.2015.06.030 · Cited by 16
Tahir, M., Jan, B., Hayat, M., Shah, S. U., & Amin, M. (2018) · Computer Methods and Programs in Biomedicine · doi:10.1016/j.cmpb.2018.01.021 · Cited by 16
Zhuang, Y., Liu, H. J., Song, X., Ju, Y., & Peng, H. (2019) · Molecular Therapy — Nucleic Acids · doi:10.1016/j.omtn.2019.10.001 · Cited by 16
PGlcS: Prediction of protein O-GlcNAcylation sites with multiple features and analysis
Zhao, X., Qiao, N., Chai, H., Ai, M., & Ma, Z. (2015) · Journal of Theoretical Biology · doi:10.1016/j.jtbi.2015.06.026 · Cited by 16
Reconstructing evolutionary trees in parallel for massive sequences
Zou, Q., Wan, S., Zeng, X., & Ma, Z. S. (2017) · BMC Systems Biology · doi:10.1186/s12918-017-0476-3 · Cited by 15
Identification of hormone-binding proteins using a novel ensemble classifier
Wang, K., Li, S., Wang, Q., & Hou, C. (2018) · Computing · doi:10.1007/s00607-018-0682-x · Cited by 16
pLoc_Deep-mHum: Predict Subcellular Localization of Human Proteins by Deep Learning
Shao, Y., Liu, X., Lu, Z., & Chou, K. (2020) · Natural Science · doi:10.4236/ns.2020.127042 · Cited by 14
Self-citationStructure-aware machine learning identifies microRNAs operating as Toll-like receptor 7/8 ligands
Raden, M., Wallach, T., Miladi, M., Zhai, Y., Krüger, C., Mossmann, Z. J., Dembny, P., Backofen, R., & Lehnardt, S. (2021) · RNA Biology · doi:10.1080/15476286.2021.1940697 · Cited by 14
Qiu, H., Guo, Y., Yu, L., Pu, X., & Li, M. (2018) · Chemometrics and Intelligent Laboratory Systems · doi:10.1016/j.chemolab.2018.05.007 · Cited by 14
Improving classification of mature microRNA by solving class imbalance problem
Wang, Y., Li, X., & Tao, B. (2016) · Scientific Reports · doi:10.1038/srep25941 · Cited by 13
LQTA-R: A new 3D-QSAR methodology applied to a set of DGAT1 inhibitors
Patil, R. B., Barbosa, E. G., Sangshetti, J. N., Sawant, S. D., & Zambre, V. P. (2018) · Computational Biology and Chemistry · doi:10.1016/j.compbiolchem.2018.02.021 · Cited by 13
Su, W., Li, Q., Zuo, Y., & Zhang, L.-Q. (2015) · Gene · doi:10.1016/j.gene.2015.08.041 · Cited by 13
Ramírez-Malule, H., Restrepo, A. A., Cardona, W., Junne, S. G., Neubauer, P. B., & Ríos‐Estepa, R. (2016) · Journal of Theoretical Biology · doi:10.1016/j.jtbi.2016.01.028 · Cited by 12
Ma, Y., Yu, Z., Han, G.-S., Li, J., & Anh, V. (2018) · BMC Bioinformatics · doi:10.1186/s12859-018-2518-2 · Cited by 13
Huang, H. (2016) · Journal of Theoretical Biology · doi:10.1016/j.jtbi.2016.03.004 · Cited by 12
Jue, N. K., Foley, R. J., Reznick, D. N., O'Neill, R. J. W., & O’Neill, M. J. (2018) · G3 Genes Genomes Genetics · doi:10.1534/g3.118.200270 · Cited by 11
The Cradle of Gordon Life Science Institute and its Development and Driving Force
Chou, K. C. (2019) · Biomedical Journal of Scientific & Technical Research · doi:10.26717/bjstr.2019.23.003978 · Cited by 11
Self-citationThe role of MicroRNAs in defense against viral phytopathogens
Hajieghrari, B., Farrokhi, N., Goliaei, B., & Kavousi, K. (2019) · Physiological and Molecular Plant Pathology · doi:10.1016/j.pmpp.2019.04.008 · Cited by 11
pLoc_Deep-mEuk: Predict Subcellular Localization of Eukaryotic Proteins by Deep Learning
Shao, Y., & Chou, K. (2020) · Natural Science · doi:10.4236/ns.2020.126034 · Cited by 10
Self-citationSaini, S., Khurana, S., Saini, D., Rajput, S., Thakur, C. J., Singh, J., Jaswal, A., Kapoor, Y., Kumar, V., & Saini, A. (2022) · Gene · doi:10.1016/j.gene.2022.147097 · Cited by 10
Wang, Y., Ru, J., Jiang, Y., & Zhang, J. (2019) · Scientific Reports · doi:10.1038/s41598-018-38048-7 · Cited by 10
Benchmark data for identifying N 6 -methyladenosine sites in the Saccharomyces cerevisiae genome
Chen, W., Feng, P., Ding, H., Lin, H., & Chou, K. (2015) · Data in Brief · doi:10.1016/j.dib.2015.09.008 · Cited by 10
Self-citationFu, X., Liao, B., Zhu, W. Q., & Cai, L. (2018) · RSC Advances · doi:10.1039/c8ra04138e · Cited by 9
iR5hmcSC: Identifying RNA 5-hydroxymethylcytosine with multiple features based on stacking learning
Zhang, S., & Shi, H. (2021) · Computational Biology and Chemistry · doi:10.1016/j.compbiolchem.2021.107583 · Cited by 9
GaoShan, K., & Feng, Y. (2015) · Journal of Theoretical Biology · doi:10.1016/j.jtbi.2015.06.006 · Cited by 9
An Insightful Recollection for Predicting Protein Subcellular Locations in Multi-Label Systems
Chou, K. (2020) · Natural Science · doi:10.4236/ns.2020.127036 · Cited by 8
Self-citationZhao, X., Qiao, N., Ai, M., Chai, H., & Yang, G. (2016) · Journal of Theoretical Biology · doi:10.1016/j.jtbi.2016.03.030 · Cited by 8
Wang, H., Huang, L., Jing, R., Yang, Y., Liu, K., Li, M., & Wen, Z. (2015) · Chemometrics and Intelligent Laboratory Systems · doi:10.1016/j.chemolab.2015.07.004 · Cited by 8
Lu, F., Zhu, M., Lin, Y. C., Zhong, H., Cai, L., He, L., & Chou, K. (2019) · Journal of Theoretical Biology · doi:10.1016/j.jtbi.2019.03.017 · Cited by 7
Self-citationSueta, D., Ito, M., Uchiba, M., Sakamoto, K., Yamamoto, E., Izumiya, Y., Kojima, S., Kaikita, K., Shinriki, S., Hokimoto, S., et al. (2017) · Thrombosis Journal · doi:10.1186/s12959-017-0132-6 · Cited by 7
A functional module-based exploration between inflammation and cancer in esophagus
Liu, N., Li, C., Huang, Y., Yi, Y., Wan-lan, B., Li, C., Li, Y., Hu, Y., Li, K., Wang, H., et al. (2015) · Scientific Reports · doi:10.1038/srep15340 · Cited by 6
Metadata
- Authors
- Liu, B., Fang, L., Liu, F., Wang, X., Chen, J., & Chou, K.-C.
- Affiliations
- Harbin Institute of Technology (CN)
- King Abdulaziz University (SA)
- Corresponding author
- Liu, Bin
- Venue
- PLOS ONE
- Publisher
- Public Library of Science (PLoS)
- Published
- 2015-03-30
- Volume
- 10
- Issue
- 3
- Pages
- e0121501
- ISSN
- 1932-6203 (ISSN-L)
- PMC
- PMC4378912
- OpenAlex
- W2001168095
- Cited by
- 238
- References
- 93
- Citations by year
- 2026: 1 · 2025: 4 · 2024: 1 · 2023: 3 · 2022: 6 · 2021: 9 · 2020: 19 · 2019: 29 · 2018: 46 · 2017: 26 · 2016: 48 · 2015: 46
- FWCI
- 24.01
- Type
- journal article
- Language
- en
- Open access
- gold
- doi.org
- Licence
- Locations
- PLoS ONE (publishedVersion, cc-by)
- PubMed Central (publishedVersion, cc-by)
- PubMed (publishedVersion)
- RePEc: Research Papers in Economics (submittedVersion)
- DOAJ (DOAJ: Directory of Open Access Journals) (submittedVersion, cc-by-sa)
- Funders
- National Natural Science Foundation of China (HIT.NSRIF.2013103, 61272383, 61300112)
- Harbin Institute of Technology
- Topics
- Life Sciences › Biochemistry, Genetics and Molecular Biology › Molecular Biology › Machine Learning in Bioinformatics
- Life Sciences › Biochemistry, Genetics and Molecular Biology › Molecular Biology › RNA and protein synthesis mechanisms
- Life Sciences › Biochemistry, Genetics and Molecular Biology › Molecular Biology › Fractal and DNA sequence analysis
- Keywords
- pseudo amino acid composition, RNA secondary structure, human miRNAs, sequence-based prediction, benchmark dataset
- MeSH terms
- Amino Acids, Base Sequence, Humans, Nucleic Acid Conformation, Nucleotides, RNA Precursors, Genome, Human, Computational Biology, MicroRNAs, RNA, Small Untranslated
About these checks
Registry, retraction, Cites and statistics results are computed, not judged, with one exception: a printed reference that no index lists is read once by a model before it counts as a citation error. Claims are extracted by a model and kept only when their quote appears verbatim in the text; each cited source is then checked, with a model’s help, for whether it says what the claim relies on. Those verdicts can be wrong — read the claim’s quote and the cited source before relying on one.
Statistics and arithmetic are recomputed, not judged.
Confidence bands are shown only for fields calibrated on our annotated test set. None is calibrated yet, so no band is shown.
What counts as a claim ›How we measure confidence ›How we check this ›
Are you an author, or do you see a problem with this page? Request a review
