

The DOI matches its Crossref record; 61 of the 62 references it cites were found in a registry or an index.
Muscle Releases Alpha-Sarcoglycan Positive Extracellular Vesicles Carrying miRNAs in the Bloodstream
Open accessAbstract
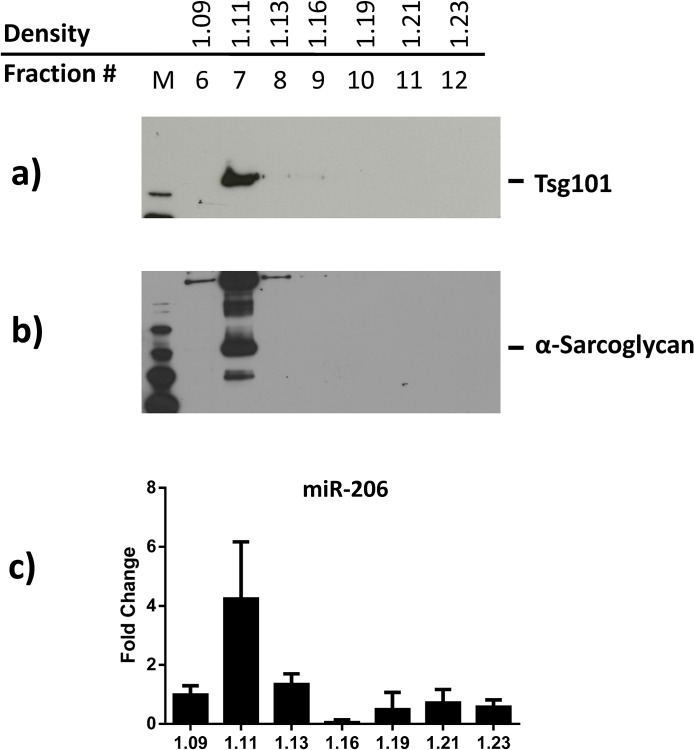
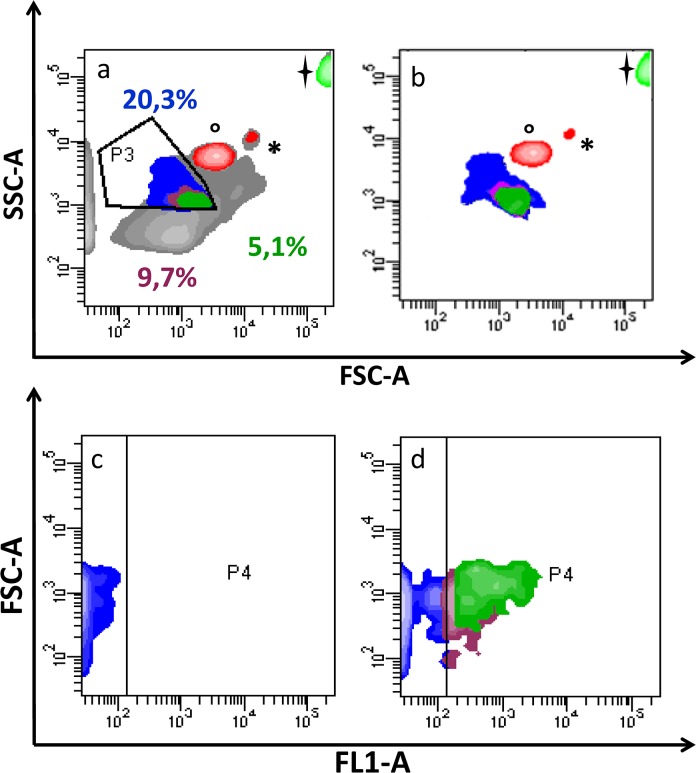
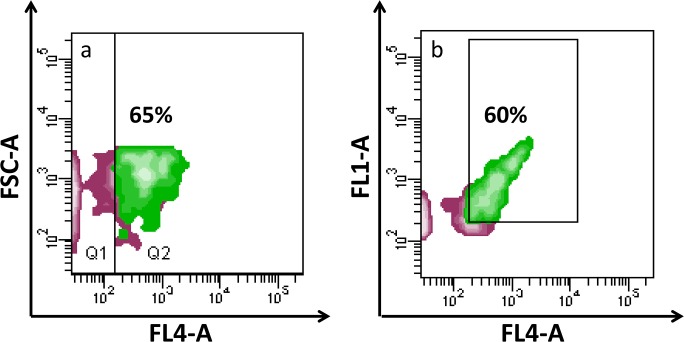
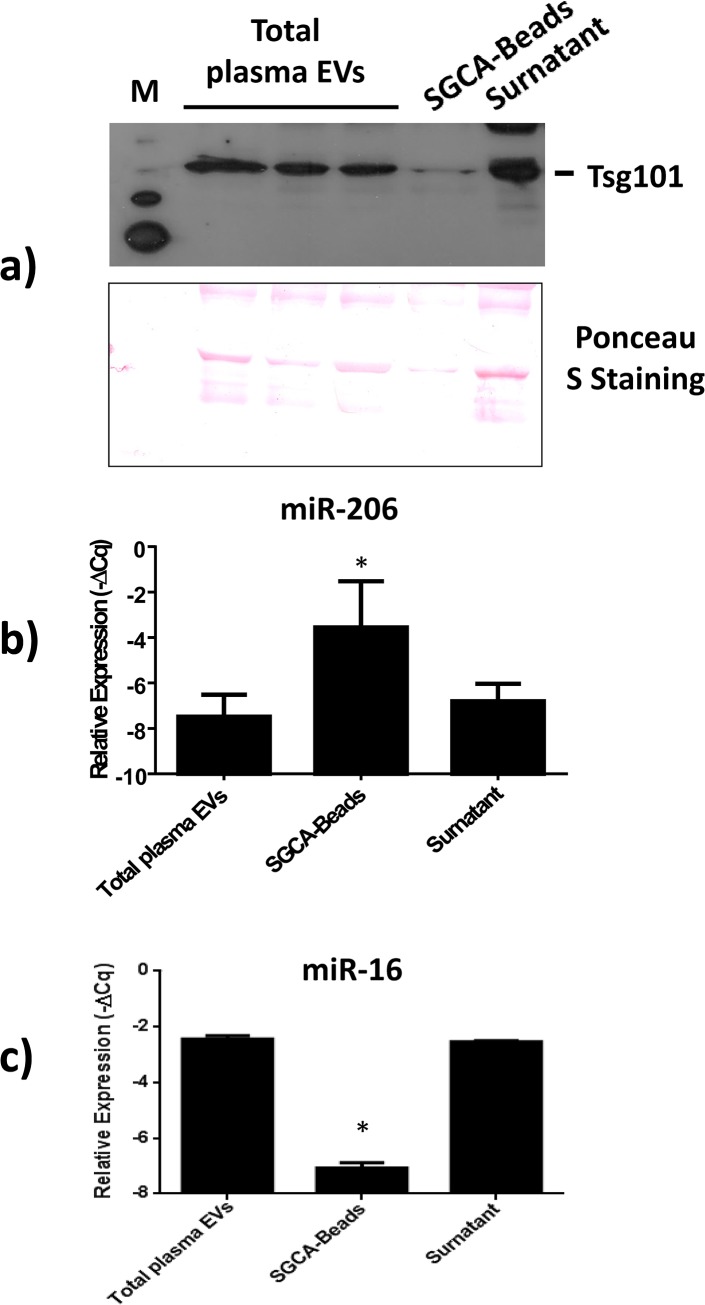
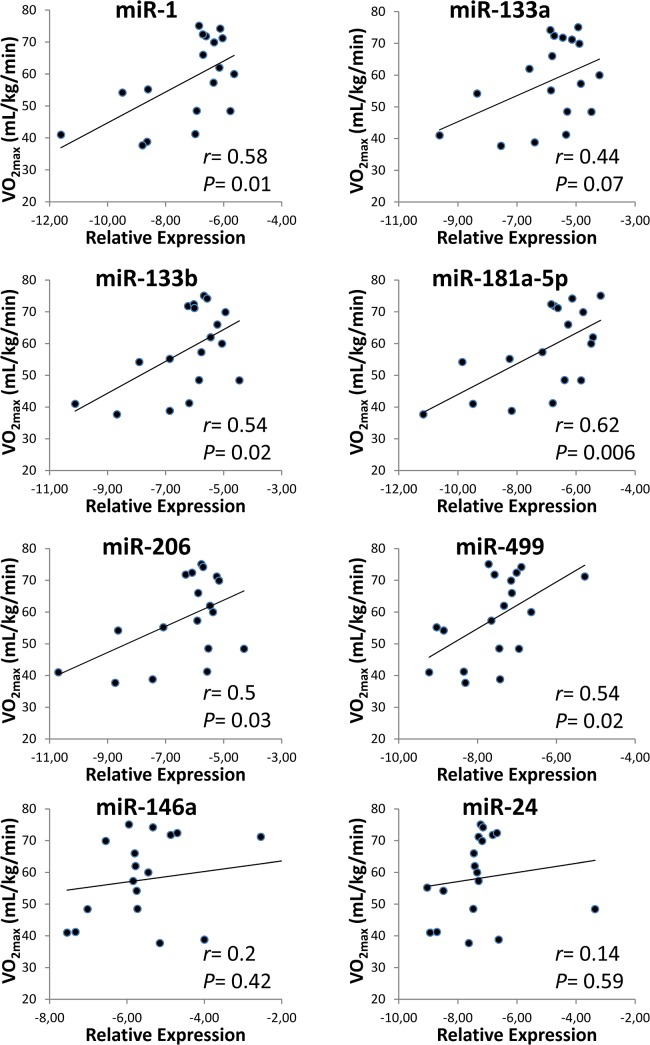
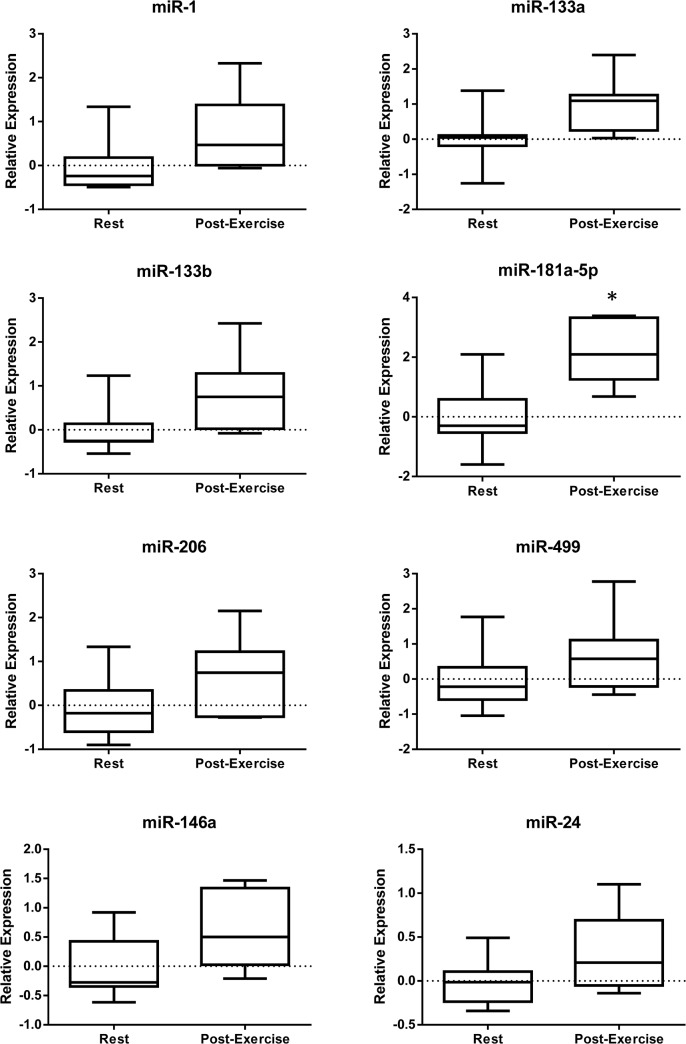
In the past few years, skeletal muscle has emerged as an important secretory organ producing soluble factors, called myokines, that exert either autocrine, paracrine or endocrine effects. Moreover, recent studies have shown that muscle releases microRNAs into the bloodstream in response to physical exercise. These microRNAs affect target cells, such as hormones and cytokines. The mechanisms underlying microRNA secretion are poorly characterized at present. Here, we investigated whether muscle tissue releases extracellular vesicles (EVs), which carry microRNAs in the bloodstream under physiological conditions such as physical exercise. Using density gradient separation of plasma from sedentary and physically fit young men we found EVs positive for TSG101 and alpha-sarcoglycan (SGCA), and enriched for miR-206. Cytometric analysis showed that the SGCA+ EVs account for 1-5% of the total and that 60-65% of these EVs were also positive for the exosomal marker CD81. Furthermore, the SGCA-immuno captured sub-population of EVs exhibited higher levels of the miR-206/miR16 ratio compared to total plasma EVs. Finally, a significant positive correlation was found between the aerobic fitness and muscle-specific miRNAs and EV miR-133b and -181a-5p were significantly up-regulated after acute exercise. Thus, our study proposes EVs as a novel means of muscle communication potentially involved in muscle remodeling and homeostasis.
Overview
The claims and statistics of this paper haven’t been checked yet.
Run the check — free, no account needed. It reads the open-access text and checks the sources it cites.
Integrity signals
Registry
Cites
Statistics
Figures
Verification
Claims the paper makes
The claims and statistics of this paper haven’t been checked yet.
Run the check — free, no account needed. It reads the open-access text and checks the sources it cites.
Claims other papers make about this one
Each is checked against this paper’s own text: does it say what the citing paper says it does?
In the citing paper
“These ELVs were also positive for CD81, TSG101 and miR-206”
From Skeletal Muscle-Released Extracellular Vesicles: State of the Art (2019) · cites this paper as Guescini et al., 2015
In the citing paper
“ELVs containing alpha-sarcoglycan (SGCA) a component of the dystrophin-glycoprotein complex involved in the stability of muscle fiber membranes, were found in human plasma”
From Skeletal Muscle-Released Extracellular Vesicles: State of the Art (2019) · cites this paper as Guescini et al., 2015
Self-check
Percentages, sums and reported differences re-computed from the paper’s own numbers.
The self-check needs the paper’s full text.
Citations
Cites
Bradford, M. M. (1976) · Analytical Biochemistry · doi:10.1016/0003-2697(76)90527-3 · Cited by 255,302 · cited 1×
“After centrifugation at 18,000 g, protein concentration was determined by the Bradford assay [35].”
MethodAnalysis of Relative Gene Expression Data Using Real-Time Quantitative PCR and the 2−ΔΔCT Method
Livak, K. J., & Schmittgen, T. D. (2001) · Methods · doi:10.1006/meth.2001.1262 · Cited by 180,860 · cited 1×
“Quantification was performed according to the ΔCq method [34], miR-16 or the exogenously added spike-in cel-miR-39 were used as a reference.”
MethodValadi, H., Ekström, K., Bossios, A., Sjöstrand, M., Lee, J. J., & Lötvall, J. O. (2007) · Nature Cell Biology · doi:10.1038/ncb1596 · Cited by 12,834 · cited 1×
“Numerous studies indicate that circulating miRNAs may be protected from degradation by several complementary mechanisms, including their incorporation into secreted membrane vesicles such as microvesicles, exosomes or apoptotic bodies [16–18], or via the formation of RNA-binding protein complexes [19].”
Background(2014) · Medical Entomology and Zoology · Cited by 9,400
Skog, J., Würdinger, T., van Rijn, S., Meijer, D. H., Gainche, L., Curry, W. T., Carter, B. S., Krichevsky, A. M., & Breakefield, X. O. (2008) · Nature Cell Biology · doi:10.1038/ncb1800 · Cited by 5,001
Mutation of the mouse klotho gene leads to a syndrome resembling ageing
Kuro-o, M., Matsumura, Y., Aizawa, H., Kawaguchi, H., Suga, T., Utsugi, T., Ohyama, Y., Kurabayashi, M., Kaname, T., Kume, E., et al. (1997) · Nature · doi:10.1038/36285 · Cited by 3,837
Arroyo, J. D., Chevillet, J. R., Kroh, E. M., Ruf, I. K., Pritchard, C. C., Gibson, D. F., Mitchell, P. S., Bennett, C. F., Pogosova-Agadjanyan, E. L., Stirewalt, D. L., et al. (2011) · Proceedings of the National Academy of Sciences · doi:10.1073/pnas.1019055108 · Cited by 3,294 · cited 1×
“Numerous studies indicate that circulating miRNAs may be protected from degradation by several complementary mechanisms, including their incorporation into secreted membrane vesicles such as microvesicles, exosomes or apoptotic bodies [16–18], or via the formation of RNA-binding protein complexes [19].”
BackgroundMuscles, exercise and obesity: skeletal muscle as a secretory organ
Pedersen, B. K., & Febbraio, M. A. (2012) · Nature Reviews Endocrinology · doi:10.1038/nrendo.2012.49 · Cited by 2,909 · cited 1×
“Therefore, the discovery that contracting muscle is a myokine-producing organ has opened up a whole new field of research on skeletal muscle [6].”
BackgroundMicroRNAs are transported in plasma and delivered to recipient cells by high-density lipoproteins
Vickers, K. C., Palmisano, B. T., Shoucri, B. M., Shamburek, R. D., & Remaley, A. T. (2011) · Nature Cell Biology · doi:10.1038/ncb2210 · Cited by 2,741 · cited 2×
“In the extracellular environment, miRNAs could be stabilized by EVs (such as exosomes, microvesicles or apoptotic bodies), HDL/LDLs, or protected by RNA-binding proteins (reviewed in [14,45]).”
BackgroundExosomes: Extracellular organelles important in intercellular communication
Mathivanan, S., Ji, H. L., & Simpson, R. J. (2010) · Journal of Proteomics · doi:10.1016/j.jprot.2010.06.006 · Cited by 2,581 · cited 1×
“11 g/mL, as previously described [37].”
Cited by
Sorted by citations
Extracellular Vesicles Provide a Means for Tissue Crosstalk during Exercise
Whitham, M., Parker, B. L., Friedrichsen, M. H., Hingst, J. R., Hjorth, M., Hughes, W. E., Egan, C. L., Cron, L., Watt, K. I., Kuchel, R. P., et al. (2018) · Cell Metabolism · doi:10.1016/j.cmet.2017.12.001 · Cited by 700
Brahmer, A., Neuberger, E. W. I., Esch-Heisser, L., Haller, N., Jørgensen, M. M., Bæk, R., Möbius, W., Simon, P. D., & Krämer‐Albers, E. (2019) · Journal of Extracellular Vesicles · doi:10.1080/20013078.2019.1615820 · Cited by 251
“exercise-related cell types such as muscle cells [alphasarcoglycan, [39], Figure 4(a)] or hepatocytes (asialoglycoprotein receptor, not shown) could not be detected.”
BackgroundFulzele, S., Mendhe, B., Khayrullin, A., Johnson, M. H., Kaiser, H., Liu, Y., Isales, C. M., & Hamrick, M. W. (2019) · Aging · doi:10.18632/aging.101874 · Cited by 220
Bei, Y., Xu, T., Lv, D., Yu, P., Xu, J., Che, L., Das, A., Tigges, J., Toxavidis, V., Ghiran, I. C., et al. (2017) · Basic Research in Cardiology · doi:10.1007/s00395-017-0628-z · Cited by 201
“In this regard, exercise-induced EVs derived from skeletal muscle deserve further investigation [1, 21, 40].”
Extracellular Vesicles and Exosomes: Insights From Exercise Science
Nederveen, J. P., Warnier, G., Carlo, A. D., Nilsson, M. I., & Tarnopolsky, M. A. (2021) · Frontiers in Physiology · doi:10.3389/fphys.2020.604274 · Cited by 200
“…of anaerobic threshold (Sossdorf et al., 2010, 2011), ∼70% of VO2max (Lansford et al., 2016) and a single bout of high intensity interval exercise (Guiraud et al., 2013) all appear to increase PMVs. Work by Wilhelm et al. (2016) examined PMVs during a 1 h bout of heavy intensity exercise (∼65%…”
Background
Metadata
- Authors
- Guescini, M., Canonico, B., Lucertini, F., Maggio, S., Annibalini, G., Barbieri, E., Luchetti, F., Papa, S., & Stocchi, V.
- Affiliations
- University of Urbino (IT)
- Corresponding author
- Guescini, Michele
- ORCID
- Venue
- PLoS ONE
- Publisher
- Public Library of Science (PLoS)
- Published
- 2015-05-08
- Volume
- 10
- Issue
- 5
- Pages
- e0125094
- ISSN
- 1932-6203 (ISSN-L)
- PMC
- PMC4425492
- OpenAlex
- W219060072
- Cited by
- 228
- References
- 62
- Citations by year
- 2026: 19 · 2025: 31 · 2024: 26 · 2023: 27 · 2022: 33 · 2021: 24 · 2020: 22 · 2019: 18 · 2018: 11 · 2017: 11 · 2016: 5 · 2015: 1
- FWCI
- 4.05
- Type
- journal article
- Language
- en
- Open access
- gold
- doi.org
- Licence
- Locations
- PLoS ONE (publishedVersion, cc-by)
- Europe PMC (PubMed Central) (publishedVersion, cc-by)
- PubMed Central (publishedVersion, cc-by)
- PubMed (publishedVersion)
- DOAJ (DOAJ: Directory of Open Access Journals) (submittedVersion, cc-by-sa)
- Figshare (submittedVersion, cc-by)
- CINECA IRIS Institutional Research information system (University of Urbino) (submittedVersion, cc-by)
- Funders
- Regione Marche
- Università degli Studi di Urbino Carlo Bo
- Topics
- Life Sciences › Biochemistry, Genetics and Molecular Biology › Molecular Biology › Extracellular vesicles in disease
- Health Sciences › Medicine › Physiology (medical) › Exercise and Physiological Responses
- Life Sciences › Biochemistry, Genetics and Molecular Biology › Molecular Biology › Muscle Physiology and Disorders
- Keywords
- extracellular vesicles, alpha-sarcoglycan, miR-206, microRNA secretion, myokines, skeletal muscle, physical activity, cardiorespiratory fitness, miR-133b, miR-181a-5p, TSG101, CD81, plasma vesicles, muscle remodeling, muscle homeostasis
- MeSH terms
- Extracellular Vesicles, Tsg101 Protein, Adult, Cell Communication, Centrifugation, Density Gradient, DNA-Binding Proteins, Gene Expression Regulation, Humans, Male, Transcription Factors, Signal Transduction, Exercise, Muscle, Skeletal, MicroRNAs, Sarcoglycans, Exosomes, Endosomal Sorting Complexes Required for Transport, Sedentary Behavior, Tetraspanin 28
About these checks
Registry, retraction, Cites and statistics results are computed, not judged, with one exception: a printed reference that no index lists is read once by a model before it counts as a citation error. Claims are extracted by a model and kept only when their quote appears verbatim in the text; each cited source is then checked, with a model’s help, for whether it says what the claim relies on. Those verdicts can be wrong — read the claim’s quote and the cited source before relying on one.
Statistics and arithmetic are recomputed, not judged.
Confidence bands are shown only for fields calibrated on our annotated test set. None is calibrated yet, so no band is shown.
What counts as a claim ›How we measure confidence ›How we check this ›
Are you an author, or do you see a problem with this page? Request a review
