

The DOI matches its Crossref record; 48 of the 51 references it cites were found in a registry or an index, and 1 are not checked yet.
The “majority illusion” in social networks
Open accessAbstract
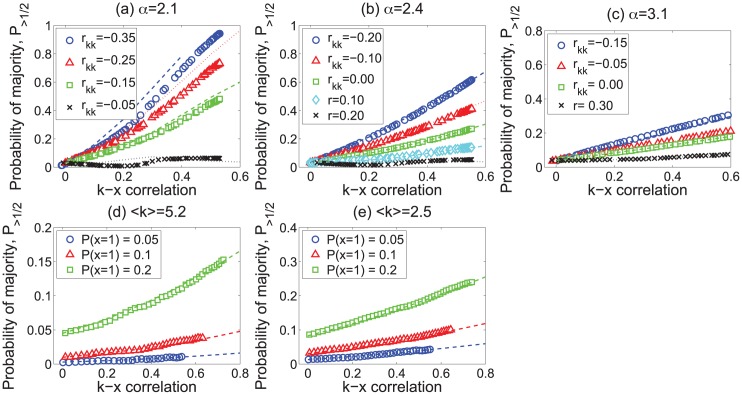
Individual's decisions, from what product to buy to whether to engage in risky behavior, often depend on the choices, behaviors, or states of other people. People, however, rarely have global knowledge of the states of others, but must estimate them from the local observations of their social contacts. Network structure can significantly distort individual's local observations. Under some conditions, a state that is globally rare in a network may be dramatically over-represented in the local neighborhoods of many individuals. This effect, which we call the "majority illusion," leads individuals to systematically overestimate the prevalence of that state, which may accelerate the spread of social contagions. We develop a statistical model that quantifies this effect and validate it with measurements in synthetic and real-world networks. We show that the illusion is exacerbated in networks with a heterogeneous degree distribution and disassortative structure.
Overview
The claims and statistics of this paper haven’t been checked yet.
Run the check — free, no account needed. It reads the open-access text and checks the sources it cites.
Integrity signals
Registry
Cites
Statistics
Figures
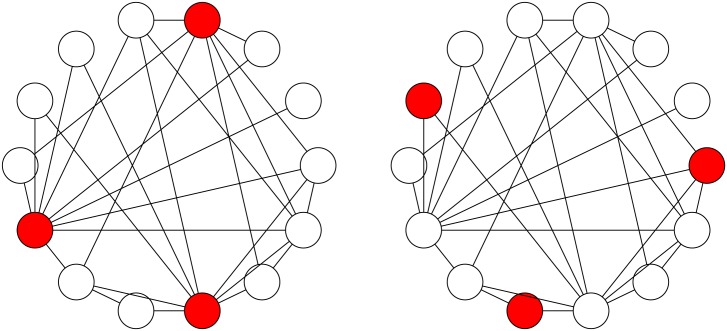
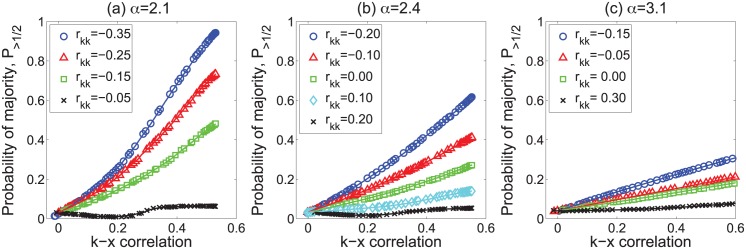
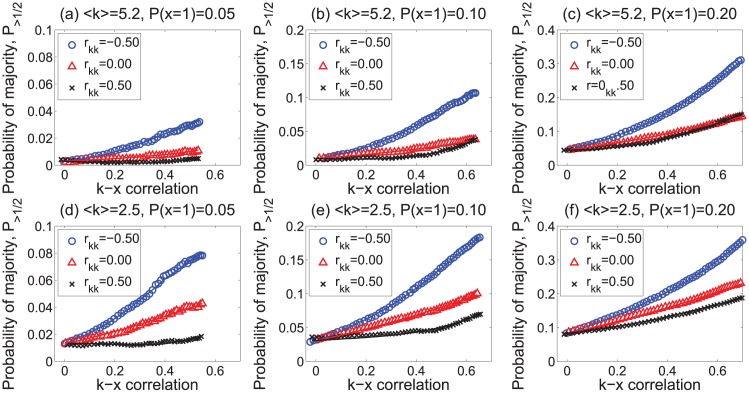
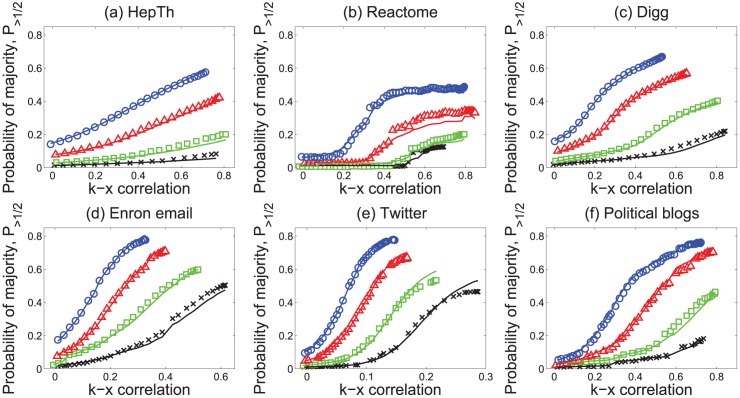
Verification
Claims the paper makes
The claims and statistics of this paper haven’t been checked yet.
Run the check — free, no account needed. It reads the open-access text and checks the sources it cites.
Claims other papers make about this one
Each is checked against this paper’s own text: does it say what the citing paper says it does?
The source backs part of the claim, not all of it — or backs it for a different population, condition or comparison.
In the citing paper
“homophily—the tendency of similar people to interact and connect (McPherson et al., 2001)—can systematically bias the perceptions of networked users, resulting in under- or over-estimations of the prevalence of user attributes within a population”
From Social Data: Biases, Methodological Pitfalls, and Ethical Boundaries (2019) · cites this paper as Lerman et al., 2016
Experimental — accuracy not yet measuredThe cited source says what the claim attributes to it.
In the citing paper
“On social platforms, they may also result in systematically biased perceptions about users or content”
From Social Data: Biases, Methodological Pitfalls, and Ethical Boundaries (2019) · cites this paper as Lerman et al., 2016
Self-check
Percentages, sums and reported differences re-computed from the paper’s own numbers.
The self-check needs the paper’s full text.
Citations
Cites
Birds of a Feather: Homophily in Social Networks
McPherson, M., Smith-Lovin, L., & Cook, J. M. (2001) · Annual Review of Sociology · doi:10.1146/annurev.soc.27.1.415 · Cited by 18,567
Availability: A heuristic for judging frequency and probability
Tversky, A., & Kahneman, D. (1973) · Cognitive Psychology · doi:10.1016/0010-0285(73)90033-9 · Cited by 9,984 · cited 1×
“For example, when making social inferences, individuals may use themselves as examples for estimating the states of others (using the “ availability ” heuristic [45]).”
Maximizing the spread of influence through a social network
Kempe, D., Kleinberg, J. M., & Eva Tardos, D. (2003) · ACM SIGKDD Conference on Knowledge Discovery and Data Mining (KDD) · doi:10.1145/956750.956769 · Cited by 7,541
Threshold models of collective behavior
Granovetter, M. (1978) · American Journal of Sociology · doi:10.1086/226707 · Cited by 6,072
Assortative Mixing in Networks
Newman, M. E. J. (2002) · Physical Review Letters · doi:10.1103/physrevlett.89.208701 · Cited by 5,034
The spread of behavior in an online social network experiment
Centola, D. (2010) · Science · doi:10.1126/science.1185231 · Cited by 2,692
A simple model of global cascades on random networks
Watts, D. J. (2002) · Proceedings of the National Academy of Sciences · doi:10.1073/pnas.082090499 · Cited by 2,673
The political blogosphere and the 2004 U.S. election: divided they blog
Adamic, L. A., & Glance, N. (2005) · Proceedings of the 3rd international workshop on Link discovery · doi:10.1145/1134271.1134277 · Cited by 2,619
Superspreading and the effect of individual variation on disease emergence
Lloyd-Smith, J. O., Schreiber, S. J., Kopp, P. E., & Getz, W. M. (2005) · Nature · doi:10.1038/nature04153 · Cited by 2,514
Leskovec, J., Kleinberg, J. M., & Faloutsos, C. (2007) · ACM Transactions on Knowledge Discovery from Data · doi:10.1145/1217299.1217301 · Cited by 2,494
Research works printed but not linked: 2
- AD Berkowitz, 2005, An overview of the social norms approach, Changing the culture of college drinking: A socially situated health communication campaign, 193
- B Latané, 1969, Bystander ‘Apathy’, American Scientist, 57, 244
Cited by
Sorted by citations
Items 301–400 of 667
Canive, M., Fernández‐Jiménez, N., Casais, R., Vázquez, P., Lavín, J. L., Bilbao, J. R., Vázquez, C. B., Garrido, J. M., Juste, R. A., & Alonso‐Hearn, M. (2021) · Scientific Reports · doi:10.1038/s41598-020-79619-x · Cited by 18
An improved layer of protection analysis based on a cloud model: Methodology and case study
Yan, F., Xu, K., Cui, Z., & Yao, X. (2017) · Journal of Loss Prevention in the Process Industries · doi:10.1016/j.jlp.2017.04.006 · Cited by 17
Pro‐survival redox signalling in progesterone‐mediated retinal neuroprotection
Ruiz‐Lopez, A. M., Roche, S. L., Jackson, A. C. W., Moloney, J. N., Byrne, A. M., & Cotter, T. G. (2017) · European Journal of Neuroscience · doi:10.1111/ejn.13604 · Cited by 17
Perceived uncertainty and use of environmental information in decision making
Abu-Rahma, A., & Jaleel, B. (2019) · International journal of organizational analysis · doi:10.1108/ijoa-07-2017-1205 · Cited by 16
de la Haye, K., Shin, H., Yon, G. G. V., & Valente, T. W. (2019) · Journal of Health and Social Behavior · doi:10.1177/0022146519870521 · Cited by 16
Guymer, C., Damp, L., Chidlow, G., Wood, J. P. M., Tang, Y. F., & Casson, R. J. (2020) · Translational Vision Science & Technology · doi:10.1167/tvst.9.6.28 · Cited by 16
Cantón, R., Huarte, R., Morata, L., Trillo-Mata, J. L., Muñoz, R., González, J., Tort, M., & Badia, X. C. (2020) · Enfermedades Infecciosas y Microbiología Clínica · doi:10.1016/j.eimc.2020.04.009 · Cited by 16
Omega‐3 fatty acids and neurocognitive ability in young people at ultra‐high risk for psychosis
McLaverty, A., Allott, K., Berger, M., Hester, R., McGorry, P. D., Nelson, B., Markulev, C., Yuen, H. P., Schäfer, M. R., Mossaheb, N., et al. (2020) · Early Intervention in Psychiatry · doi:10.1111/eip.13025 · Cited by 16
Bao, S., Lin, J., Xie, M., Wang, C., & Nie, X. (2020) · Chemosphere · doi:10.1016/j.chemosphere.2020.128725 · Cited by 16
Grutters, L. A., Smith, E. C., Casteleijn, C. W., van Dongen, E. P., Ruven, H. J. T., van der Vis, J. J., & Veltkamp, M. (2020) · Journal of Bronchology & Interventional Pulmonology · doi:10.1097/lbr.0000000000000741 · Cited by 16
Openness to experience moderates psychological contract breach–job satisfaction tie-in
Mensah, A. O., & Koomson, S. (2021) · PSU Research Review · doi:10.1108/prr-03-2020-0008 · Cited by 16
Rolls, K., Hansen, M. M., Jackson, D. W., & Elliott, D. (2016) · JMIR Research Protocols · doi:10.2196/resprot.5323 · Cited by 19
The performance of China’s stock market price limits: noise mitigator or noise maker?
Tao, J., Wu, Y., & Jingyi, Z. (2017) · China Finance Review International · doi:10.1108/cfri-07-2016-0096 · Cited by 16
Organizational health management through metaphor: a mission-based approach
Woodside, J. M. (2018) · Journal of Health Organization and Management · doi:10.1108/jhom-05-2017-0098 · Cited by 16
Narrating hostility, challenging hostile narratives
Baider, F. H., & Kopytowska, M. (2018) · Lodz Papers in Pragmatics · doi:10.1515/lpp-2018-0001 · Cited by 18
Nettasinghe, B., Krishnamurthy, V., & Lerman, K. (2019) · IEEE Transactions on Network Science and Engineering · doi:10.1109/tnse.2019.2909015 · Cited by 16
Self-citationKaloop, M. R., Yiğit, C. Ö., El‐Mowafy, A., Dindar, A. A., Bezcioğlu, M., & Hu, J. W. (2019) · Remote Sensing · doi:10.3390/rs12010079 · Cited by 16
Understanding the dynamics emerging from infodemics: a call to action for interdisciplinary research
Leitner, S., Gula, B., Jannach, D., Krieg-Holz, U., & Wall, F. (2021) · SN Business & Economics · doi:10.1007/s43546-020-00027-4 · Cited by 17
Controllability of Network Opinion in Erdös--Rényi Graphs Using Sparse Control Inputs
Joseph, G., Nettasinghe, B., Krishnamurthy, V., & Varshney, P. K. (2021) · SIAM Journal on Control and Optimization · doi:10.1137/20m1327860 · Cited by 15
The Virtual Table: A Framework for Online Teamwork, Collaboration, and Communication
Endersby, L., Phelps, K. C., & Jenkins, D. M. (2017) · New Directions for Student Leadership · doi:10.1002/yd.20231 · Cited by 15
Edge-Dual Graph Preserving Sign Prediction for Signed Social Networks
Yuan, W., He, K., Guan, D., & Han, G. (2017) · IEEE Access · doi:10.1109/access.2017.2746258 · Cited by 15
Giese, H., Stok, F. M., & Renner, B. (2018) · Psychology and Health · doi:10.1080/08870446.2018.1514118 · Cited by 15
Din, S. M. U., Samad, S., Rehman, M. A., Ali, M. Z., & Usman, A. (2019) · International Journal of Islamic and Middle Eastern Finance and Management · doi:10.1108/imefm-02-2018-0072 · Cited by 18
Santoso, D. I. I., Yolanda, S., Redjeki, S., Andraini, T., & Ivanali, K. (2019) · Comparative Exercise Physiology · doi:10.3920/cep190036 · Cited by 16
Linking Cognitive Impairment to Neuroinflammation in Multiple Sclerosis using neuroimaging tools
Barros, C., & Fernandes, A. M. A. (2020) · Multiple Sclerosis and Related Disorders · doi:10.1016/j.msard.2020.102622 · Cited by 15
Kosnik, M. B., Enroth, S., & Karlsson, O. (2021) · Environment International · doi:10.1016/j.envint.2021.106488 · Cited by 15
Subjective Tools for Burn Scar Assessment: An Integrative Review
da Costa, P. T. L., Echevarría-Guanilo, M. E., Gonçalves, N., Girondi, J. B. R., & Gonçalves, A. D. C. (2021) · Advances in Skin & Wound Care · doi:10.1097/01.asw.0000749732.09228.a9 · Cited by 15
Developmental conditions have intergenerational effects on corticosterone levels in a passerine
Kraft, F.-L. H., Crino, O. L., & Buchanan, K. L. (2021) · Hormones and Behavior · doi:10.1016/j.yhbeh.2021.105023 · Cited by 15
Anuracpreeda, P., Chawengkirttikul, R., Ngamniyom, A., Panyarachun, B., Puttarak, P., Koedrith, P., & Intaratat, N. (2017) · Parasitology · doi:10.1017/s0031182017001445 · Cited by 15
Determinants of infant mortality in Sierra Leone: applying Cox proportional hazards model
Naz, L., & Patel, K. K. (2020) · International Journal of Social Economics · doi:10.1108/ijse-08-2019-0478 · Cited by 14
Information content of note transitions in the music of J. S. Bach
Kulkarni, S., David, S. U., Lynn, C. W., & Bassett, D. S. (2024) · Physical Review Research · doi:10.1103/physrevresearch.6.013136 · Cited by 14
Lai, S., Cheok, Z. Y., Bouma, T. J., Yaakub, S. M., & Todd, P. A. (2019) · Estuarine Coastal and Shelf Science · doi:10.1016/j.ecss.2019.106430 · Cited by 14
Nguyen, H.-T., Grenier, T., Leporq, B., Goff, C. M. L., Gilles, B., Grange, S., Grange, R., Millet, G. P., Beuf, O., Croisille, P., et al. (2020) · Medicine & Science in Sports & Exercise · doi:10.1249/mss.0000000000002535 · Cited by 14
Imajo, K., Honda, Y., Yoneda, M., Saito, S., & Nakajima, A. (2020) · Journal of Medical Ultrasonics · doi:10.1007/s10396-020-01059-x · Cited by 14
Yamanis, T. J., del Río‐González, A. M., Rapoport, L., Norton, C., Little, C., Barker, S. L., & Ornelas, I. J. (2021) · Advances in medical sociology · doi:10.1108/s1057-629020210000021010 · Cited by 14
Limbeck, J., Bisdom, K., Lanz, F., Park, T., Bárbaro, E., Bourne, S., Király, F. J., Bierman, S. M., Harris, C., Nevenzeel, K., et al. (2021) · Computational Geosciences · doi:10.1007/s10596-020-10023-0 · Cited by 15
Influence of Sex on Neuroretinal Degeneration: Six-Month Follow-Up in Rats With Chronic Glaucoma
Rodrigo, M. J., Martínez, T., Subías, M., Méndez-Martínez, S., Pablo, L. E., Polo, V., Aragón-Navas, A., García-Herranz, D., Feijoo, J. G., Bravo‐Osuna, I., et al. (2021) · Investigative Ophthalmology & Visual Science · doi:10.1167/iovs.62.13.9 · Cited by 14
How social learning shapes the efficacy of preventative health behaviors in an outbreak
Carrignon, S., Bentley, R. A., Silk, M. J., & Fefferman, N. H. (2022) · PLoS ONE · doi:10.1371/journal.pone.0262505 · Cited by 14
Adult content consumption in online social networks
Coletto, M., Aiello, L. M., Lucchese, C., & Silvestri, F. (2017) · Social Network Analysis and Mining · doi:10.1007/s13278-017-0449-y · Cited by 16
A systematic review of micro correlates of maternal mortality
Yakubu, Y., Nor, N. M., & Abidin, E. Z. (2018) · Reviews on Environmental Health · doi:10.1515/reveh-2017-0050 · Cited by 14
Gender and water management in Mexico
Miguel, J. A. S. R. D. S. (2018) · Management of Environmental Quality An International Journal · doi:10.1108/meq-10-2017-0112 · Cited by 14
A distance sampling approach to estimate density and abundance of gibbon groups
Vu, T. T., Tran, L. M., Nguyen, M. D., Tran, D. V., Doherty, P. F., Giang, T. T., & Dong, H. T. (2018) · American Journal of Primatology · doi:10.1002/ajp.22903 · Cited by 14
Wang, W., Li, R., Wang, H., Qi, B., Jiang, X., Zhu, Q., Cai, D., Tang, X., & Zhao, Q. (2019) · GCB Bioenergy · doi:10.1111/gcbb.12600 · Cited by 14
Pervez, H., Khan, N., Zaib, S., Yaqub, M., Naseer, M. M., Tahir, M. N., & Iqbal, J. (2016) · Bioorganic & Medicinal Chemistry · doi:10.1016/j.bmc.2016.12.012 · Cited by 14
Nettasinghe, B., & Krishnamurthy, V. (2021) · ACM Transactions on Knowledge Discovery from Data · doi:10.1145/3451166 · Cited by 14
Improving the visibility of minorities through network growth interventions
Neuhäuser, L., Karimi, F., Bachmann, J., Strohmaier, M., & Schaub, M. T. (2023) · Communications Physics · doi:10.1038/s42005-023-01218-9 · Cited by 15
The forgotten adaptive social benefits of social learning in animals
Harrison, R. A., Dongre, P., van Schaik, C. P., & van de Waal, E. (2024) · Biological reviews/Biological reviews of the Cambridge Philosophical Society · doi:10.1111/brv.13086 · Cited by 14
Orsucci, M., Audiot, P., Nidelet, S., Dorkeld, F., Pommier, A., Vabre, M., Séverac, D., Rohmer, M., Gschloessl, B., & Streiff, R. (2018) · BMC Evolutionary Biology · doi:10.1186/s12862-018-1257-3 · Cited by 13
Borrego, A. (2018) · Online Information Review · doi:10.1108/oir-04-2018-0136 · Cited by 13
Majority vote and monopolies in social networks
Avin, C., Lotker, Z., Mizrachi, A., & Peleg, D. (2019) · International Conference on Distributed Computing and Networking (ICDCN) · doi:10.1145/3288599.3288633 · Cited by 13
How harmful are online firestorms for brands?
Delgado‐Ballester, E., López-López, I., & Bernal-Palazón, A. (2019) · Spanish Journal of Marketing - ESIC · doi:10.1108/sjme-07-2019-0044 · Cited by 17
Alqahtani, A. M., Adnan, Khan, U., Ahmed, N., Mohyud‐Din, S. T., & Khan, I. (2020) · Mathematical Problems in Engineering · doi:10.1155/2020/2475831 · Cited by 13
Explaining the effects of distractor statistics in visual search
Calder-Travis, J. M., & Ma, W. J. (2020) · Journal of Vision · doi:10.1167/jov.20.13.11 · Cited by 14
The effect of nWOM firestorms on South African retail banking
Lappeman, J., Clark, R., Evans, J., & Sierra-Rubia, L. (2021) · International Journal of Bank Marketing · doi:10.1108/ijbm-07-2020-0403 · Cited by 13
Givi, M. E., Saberi, M. K., Talafidaryani, M., Abdolhamid, M., Nikandish, R., & Fattahi, A. (2021) · Journal of Intellectual Capital · doi:10.1108/jic-02-2020-0057 · Cited by 13
Anuracpreeda, P., Chawengkirttikul, R., & Sobhon, P. (2016) · Parasitology · doi:10.1017/s0031182016001104 · Cited by 13
On the Behaviour of Deviant Communities in Online Social Networks
Coletto, M., Aiello, L. M., Lucchese, C., & Silvestri, F. (2021) · Proceedings of the International AAAI Conference on Web and Social Media · doi:10.1609/icwsm.v10i1.14726 · Cited by 13
Triglycerides Revisited to the Serial
Viecili, P. R. N., da Silva, B., Hirsch, G. E., Porto, F. G., Parisi, M. M., Castanho, A. R., Wender, M., & Klafke, J. Z. (2017) · Advances in clinical chemistry · doi:10.1016/bs.acc.2016.11.001 · Cited by 14
Bournazel, M., Lessire, M., van der Klein, S. A. S., Même, N., Peyronnet, C., Quinsac, A., Duclos, M. J. M. J., & Narcy, A. (2018) · Poultry Science · doi:10.3382/ps/pex446 · Cited by 13
van Dijk, I. A., Veerman, E. C. I., Reits, E. A., Bolscher, J. G. M., & Stap, J. (2018) · Biological Chemistry · doi:10.1515/hsz-2018-0246 · Cited by 13
Aziz, A. F. A., Ali, M. F., Yusof, M. F., Man, Z. C., Sulong, S., & Aljunid, S. M. (2018) · Scientific Reports · doi:10.1038/s41598-018-36154-0 · Cited by 13
Egonets as systematically biased windows on society
Feld, S. L., & McGail, A. (2020) · Network Science · doi:10.1017/nws.2020.5 · Cited by 13
Gundlach, H., & Hofmann, U. (2020) · Journal of Media Business Studies · doi:10.1080/16522354.2020.1854602 · Cited by 13
Zhang, Y., Oshita, K., Takaoka, M., Kawasaki, Y., Minami, D., Inoue, G., & Tanaka, T. (2021) · Water Science & Technology · doi:10.2166/wst.2021.083 · Cited by 13
Engl, E., & Sgaier, S. K. (2019) · Gates Open Research · doi:10.12688/gatesopenres.12923.2 · Cited by 13
Neighbor-Neighbor Correlations Explain Measurement Bias in Networks
Wu, X.-Z., Percus, A. G., & Lerman, K. (2017) · Scientific Reports · doi:10.1038/s41598-017-06042-0 · Cited by 12
Self-citationA novel amino acid signaling process governs glucose-6-phosphatase transcription
Fukushima, S., Nishi, H., Kumano, M., Yamanaka, D., Kataoka, N., Hakuno, F., & Takahashi, S. (2021) · iScience · doi:10.1016/j.isci.2021.102778 · Cited by 12
The Effect of Streaming Chat on Perceptions of Political Debates
Asbury-Kimmel, V. S., Chang, K.-C., McCabe, K. T., Munger, K., & Ventura, T. (2021) · Journal of Communication · doi:10.1093/joc/jqab041 · Cited by 12
Tannin-sorghum flours in cream cheese: Physicochemical, antioxidant and sensory characterization
Correia, V. T. D. V., D’Angelis, D. F., dos Santos, A. N., Roncheti, E. F. S., Queiróz, V. A. V., Figueiredo, J. E. F., da Silva, W. A., Ferreira, A. A., & Fante, C. A. (2021) · LWT · doi:10.1016/j.lwt.2021.112672 · Cited by 12
Zaragoza, C. A., García, I. F., García, I. M., Poyato, E. C., & Díaz, J. A. R. (2021) · Agricultural Water Management · doi:10.1016/j.agwat.2021.107353 · Cited by 12
To what is the review process relevant?
Babin, B. J., & Moulard, J. G. (2018) · European Business Review · doi:10.1108/ebr-09-2017-0162 · Cited by 12
Fitting in and breaking up: A nonlinear version of coevolving voter models
Kureh, Y. H., & Porter, M. A. (2020) · Physical review. E · doi:10.1103/physreve.101.062303 · Cited by 12
Aguirre-Rojas, L. M., Scully, E. D., Trick, H. N., Zhu, K. Y., & Smith, C. M. (2021) · Scientific Reports · doi:10.1038/s41598-021-90932-x · Cited by 12
Anuracpreeda, P., TEPSUPORNKUL, K., & Chawengkirttikul, R. (2017) · Parasitology · doi:10.1017/s003118201600264x · Cited by 12
Modeling opinion misperception and the emergence of silence in online social system
Vilone, D., & di Sorrentino, E. P. (2024) · PLoS ONE · doi:10.1371/journal.pone.0296075 · Cited by 12
Perfectionism in occupational science students: occupational therapy implications
Wagner, M. E., & Causey-Upton, R. (2017) · Irish Journal of Occupational Therapy · doi:10.1108/ijot-06-2017-0014 · Cited by 11
Fagotti, A., Rossi, R., Canestrelli, D., Porta, G. L., Paracucchi, R., Lucentini, L., Simoncelli, F., & Rosa, I. D. (2019) · Parasitology · doi:10.1017/s0031182019000076 · Cited by 11
Mohammad, I.-L., Mateos, B., & Pons, M. (2019) · BioMolecular Concepts · doi:10.1515/bmc-2019-0003 · Cited by 11
Research on impact evaluation of academic journals from multidimensional perspective
Zhao, R., & Wang, X. (2019) · Library Hi Tech · doi:10.1108/lht-03-2019-0067 · Cited by 11
Emerging sustainable facilities management practices in health-care sector
Nazeer, F. S., Ramachandra, T., Gunatilake, S., & Senaratne, S. (2020) · Journal of Facilities Management · doi:10.1108/jfm-10-2019-0056 · Cited by 13
Yang, K., Qi, H., & Huang, Q. (2021) · Industrial Management & Data Systems · doi:10.1108/imds-03-2021-0178 · Cited by 11
Nikopoulos, J. (2016) · Humor - International Journal of Humor Research · doi:10.1515/humor-2016-0062 · Cited by 11
Beautiful and Damned. Combined Effect of Content Quality and Social Ties on User Engagement
Aiello, L. M., Schifanella, R., Реди, М., Svetlichnaya, S., Liu, F., & Osindero, S. (2017) · IEEE Transactions on Knowledge and Data Engineering · doi:10.1109/tkde.2017.2747552 · Cited by 12
Khan, U., Abbasi, A., Ahmed, N., & Mohyud‐Din, S. T. (2017) · Engineering Computations · doi:10.1108/ec-04-2017-0127 · Cited by 11
Novel approaches to vaccine development in lower-middle income countries
Siagian, R. C., & Osorio, J. E. (2018) · International Journal of Health Governance · doi:10.1108/ijhg-03-2018-0011 · Cited by 11
Akthar, F., Harvey, H., Subramanian, A., Liversedge, S. P., & Walker, R. (2021) · Journal of Vision · doi:10.1167/jov.21.12.5 · Cited by 11
Ma, N., Chen, L., Hu, L., Dai, W., Bu, Z., & Sun, Y. (2017) · Andrologia · doi:10.1111/and.12826 · Cited by 11
The transsortative structure of networks
Ngo, S.-C., Percus, A. G., Burghardt, K., & Lerman, K. (2020) · Proceedings of the Royal Society A Mathematical Physical and Engineering Sciences · doi:10.1098/rspa.2019.0772 · Cited by 11
Self-citationHalal Malaysia brand equity mishap
Ismail, W. R. W., Othman, M., Nor, N. M., Badiuzaman, A. F., & Nor, N. M. S. N. M. (2020) · Journal of Islamic marketing · doi:10.1108/jima-04-2019-0073 · Cited by 10
Neo, R. L. (2021) · Journal of Information Technology & Politics · doi:10.1080/19331681.2021.1881016 · Cited by 13
Does a single consumption imagery event increase food desire?
Devos, E., Pandelaere, M., & Kerckhove, A. V. (2021) · Appetite · doi:10.1016/j.appet.2021.105773 · Cited by 10
A Self‐organizing System for Innovation in Large Organizations
Foss, R. A. (2017) · Systems Research and Behavioral Science · doi:10.1002/sres.2503 · Cited by 10
Zakrzewska, M., Stebner, F., Puchalski, M., Singh, H., & Giłka, W. (2016) · Earth and Environmental Science Transactions of the Royal Society of Edinburgh · doi:10.1017/s1755691017000421 · Cited by 10
The state of the responsible research and innovation programme
Ogoh, G., & Fairweather, N. B. (2019) · Journal of Information Communication and Ethics in Society · doi:10.1108/jices-12-2018-0093 · Cited by 10
Hybrid data-based modelling in oncology: successes, challenges and hopes
Stéphanou, A., Ballet, P., & Powathil, G. (2020) · Mathematical Modelling of Natural Phenomena · doi:10.1051/mmnp/2019026 · Cited by 14
The ecomuseum and solidarity tourism: a case study from northeast Turkey
Doğan, M. (2019) · Journal of Cultural Heritage Management and Sustainable Development · doi:10.1108/jchmsd-12-2017-0086 · Cited by 10
Perkins, J. M., Perkins, H. W., & Craig, D. W. (2019) · Journal of Youth and Adolescence · doi:10.1007/s10964-019-01127-7 · Cited by 10
Optical Coherence Tomography Findings in the Retinas of SOD1 Knockout Mice
Augustin, M., Harper, D. J., Merkle, C. W., Glösmann, M., Hitzenberger, C. K. F., & Baumann, B. (2020) · Translational Vision Science & Technology · doi:10.1167/tvst.9.4.15 · Cited by 10
Le capital psychologique : un construit d’intérêt majeur pour les psychologues du travail
Choisay, F., Fouquereau, E., & Chevalier, S. (2020) · Pratiques Psychologiques · doi:10.1016/j.prps.2019.12.001 · Cited by 10
The paradox of second-order homophily in networks
Evtushenko, A., & Kleinberg, J. M. (2021) · Scientific Reports · doi:10.1038/s41598-021-92719-6 · Cited by 10
Metadata
- Authors
- Lerman, K., Yan, X., & Wu, X.-Z.
- Affiliations
- University of Southern California (US)
- Corresponding author
- Lerman, Kristina
- Venue
- PLOS ONE
- Publisher
- Public Library of Science (PLoS)
- Published
- 2016-02-17
- Volume
- 11
- Issue
- 2
- Pages
- e0147617
- ISSN
- 1932-6203 (ISSN-L)
- PMC
- PMC4757419
- OpenAlex
- W1552468722
- Cited by
- 669
- References
- 51
- Citations by year
- 2026: 11 · 2025: 13 · 2024: 15 · 2023: 26 · 2022: 22 · 2021: 135 · 2020: 123 · 2019: 119 · 2018: 94 · 2017: 78 · 2016: 30
- FWCI
- 60.61
- Type
- journal article
- Language
- en
- Open access
- gold
- doi.org
- Licence
- Locations
- PLoS ONE (publishedVersion, cc-by)
- Europe PMC (PubMed Central) (publishedVersion, cc-by)
- PubMed Central (publishedVersion, cc-by)
- PubMed (publishedVersion)
- arXiv (Cornell University) (submittedVersion)
- RePEc: Research Papers in Economics (submittedVersion)
- DOAJ (DOAJ: Directory of Open Access Journals) (submittedVersion, cc-by-sa)
- Figshare (submittedVersion, cc-by)
- arXiv (Cornell University)
- Funders
- National Science Foundation (1217605)
- Defense Advanced Research Projects Agency (W911NF- 12-1-0034)
- Advanced Research Projects Agency
- Air Force Office of Scientific Research (FA9550-, FA9550-10-1-, FA9550-10-1-0569)
- Topics
- Physical Sciences › Physics and Astronomy › Statistical and Nonlinear Physics › Complex Network Analysis Techniques
- Physical Sciences › Physics and Astronomy › Statistical and Nonlinear Physics › Opinion Dynamics and Social Influence
- Social Sciences › Economics, Econometrics and Finance › Economics and Econometrics › Complex Systems and Time Series Analysis
- Keywords
- social networks, prevalence estimation, social contagion, network structure, degree heterogeneity, disassortative mixing, statistical models
- MeSH terms
- Humans, Illusions, Normal Distribution, Social Networking
About these checks
Registry, retraction, Cites and statistics results are computed, not judged, with one exception: a printed reference that no index lists is read once by a model before it counts as a citation error. Claims are extracted by a model and kept only when their quote appears verbatim in the text; each cited source is then checked, with a model’s help, for whether it says what the claim relies on. Those verdicts can be wrong — read the claim’s quote and the cited source before relying on one.
Statistics and arithmetic are recomputed, not judged.
Confidence bands are shown only for fields calibrated on our annotated test set. None is calibrated yet, so no band is shown.
What counts as a claim ›How we measure confidence ›How we check this ›
Are you an author, or do you see a problem with this page? Request a review
