Student or educator? Sign up with your school email and get 6 months of Pro free.
CoChat

The DOI matches its Crossref record; 77 of the 78 references it cites were found in a registry or an index.

Diffusion Modelling Reveals the Decision Making Processes Underlying Negative Judgement Bias in Rats

Open access

Abstract

Human decision making is modified by emotional state. Rodents exhibit similar biases during interpretation of ambiguous cues that can be altered by affective state manipulations. In this study, the impact of negative affective state on judgement bias in rats was measured using an ambiguous-cue interpretation task. Acute treatment with an anxiogenic drug (FG7142), and chronic restraint stress and social isolation both induced a bias towards more negative interpretation of the ambiguous cue. The diffusion model was fit to behavioural data to allow further analysis of the underlying decision making processes. To uncover the way in which parameters vary together in relation to affective state manipulations, independent component analysis was conducted on rate of information accumulation and distances to decision threshold parameters for control data. Results from this analysis were applied to parameters from negative affective state manipulations. These projected components were compared to control components to reveal the changes in decision making processes that are due to affective state manipulations. Negative affective bias in rodents induced by either FG7142 or chronic stress is due to a combination of more negative interpretation of the ambiguous cue, reduced anticipation of the high reward and increased anticipation of the low reward.

Overview

The claims and statistics of this paper haven’t been checked yet.

Free: it reads the open-access text and checks the first 5 claims that cite a source we can check. Create a free account to check every claim.

A few free checks a day · papers already verified open instantly · results are public

Integrity signals

Registry

Crossref · 10.1371/journal.pone.0152592

Cites

77 of 77 references verified0 citation errors · 0 not checkable

Statistics

Figures

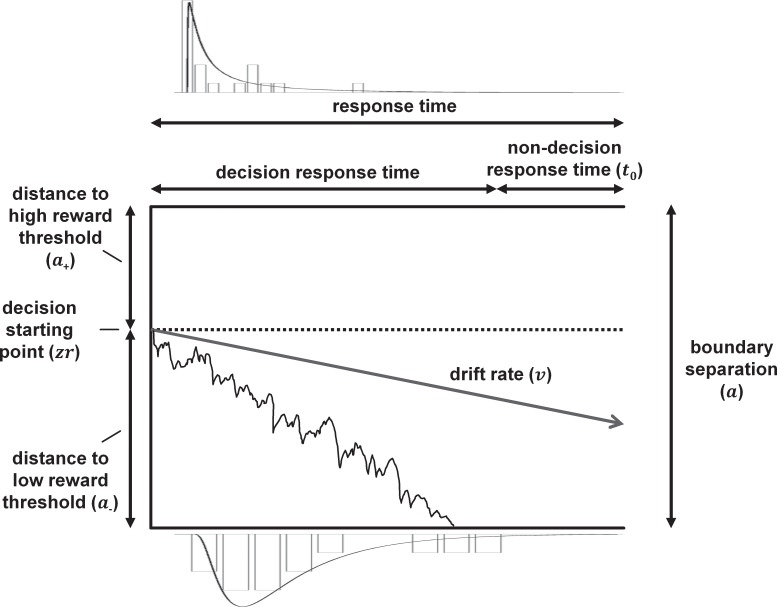
Fig 1 Diagrammatic representation of the diffusion model for a simple two-choice response time task. The vertical axis shows boundary separation (a): the distance between the two decision thresholds. The upper boundary corresponds to a decision to press the high reward lever, while the lower boundary corresponds to a decision to press the low reward lever. The decision is made through information accumulation, which begins from a starting point (zr) located somewhere between the two boundaries. a+ is the distance between the decision starting point and the upper boundary, while a- is the distance between the starting point and lower boundary. a+ = a- would mean the decision starting point is exactly halfway between the two boundaries (signifying no bias). The horizontal axis is the total response time (RT), made up of the decision time plus the non-decision RT (t0). Representative RT distributions with behavioural data (bars) and RT curves used by the model to calculate parameters (black lines) for the midpoint tone are shown above and below the model for decisions cumulating in high and low reward lever presses respectively. The RT distributions are from a single rat on a single control session, which was chosen by selecting the data point with median goodness of fit p-value (p = 0.862) from all control data. The jagged line shows an example decision making process which is noisy, and has an average rate of information accumulation called the drift rate (v). The relative positions of boundaries, starting point and gradient of the drift rate are drawn scaled to the average parameter values for all control data for the midpoint tone.
Fig 1 Diagrammatic representation of the diffusion model for a simple two-choice response time task. The vertical axis shows boundary separation (a): the distance between the two decision thresholds. The upper boundary corresponds to a decision to press the high reward lever, while the lower boundary corresponds to a decision to press the low reward lever. The decision is made through information accumulation, which begins from a starting point (zr) located somewhere between the two boundaries. a+ is the distance between the decision starting point and the upper boundary, while a- is the distance between the starting point and lower boundary. a+ = a- would mean the decision starting point is exactly halfway between the two boundaries (signifying no bias). The horizontal axis is the total response time (RT), made up of the decision time plus the non-decision RT (t0). Representative RT distributions with behavioural data (bars) and RT curves used by the model to calculate parameters (black lines) for the midpoint tone are shown above and below the model for decisions cumulating in high and low reward lever presses respectively. The RT distributions are from a single rat on a single control session, which was chosen by selecting the data point with median goodness of fit p-value (p = 0.862) from all control data. The jagged line shows an example decision making process which is noisy, and has an average rate of information accumulation called the drift rate (v). The relative positions of boundaries, starting point and gradient of the drift rate are drawn scaled to the average parameter values for all control data for the midpoint tone.CC BY · PubMed Central
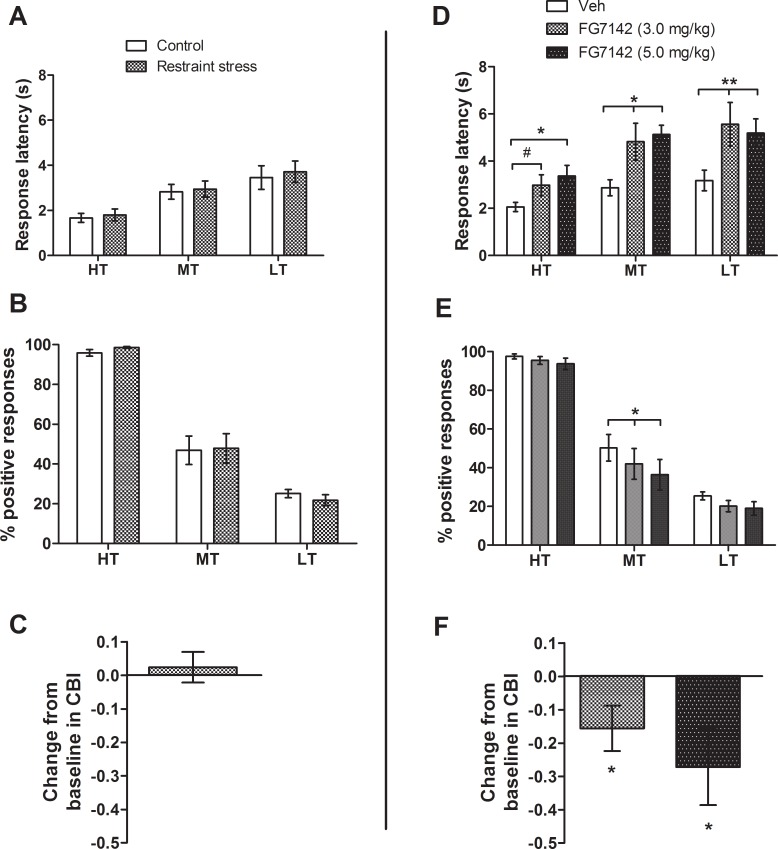
Fig 2 The effect of acute negative affective state manipulations on judgement bias. Acute restraint stress does not alter behaviour on the task, but an acute pharmacological negative affective state manipulation induces a negative bias. For the acute stress manipulation rats were placed in a restraint tube for 15 min immediately prior to testing on the task. For the acute pharmacological manipulation two doses of the anxiogenic drug, FG7142 (a GABAA receptor partial inverse agonist), were administered acutely 30 min prior to testing on the task. (A) Acute restraint stress had no effect on the response latency, did not alter (B) the percentage positive responding, and there was no change in (C) change from baseline in cognitive bias index (CBI). (D) Both doses of FG7142 (3.0 and 5.0 mg/kg) increased response latency across all three tones. (E) FG7142 caused a significant reduction in percentage positive responding for the midpoint tone only for both doses. (F) This is supported by the negative change from baseline in CBI for both doses of FG7142. Data represent mean ± SEM; Acute restraint stress: n = 11; FG7142: n = 10. **p < 0.01, *p < 0.05, #p < 0.06. Veh–vehicle; HT—high reward tone; MT—midpoint tone; LT—low reward tone.
Fig 2 The effect of acute negative affective state manipulations on judgement bias. Acute restraint stress does not alter behaviour on the task, but an acute pharmacological negative affective state manipulation induces a negative bias. For the acute stress manipulation rats were placed in a restraint tube for 15 min immediately prior to testing on the task. For the acute pharmacological manipulation two doses of the anxiogenic drug, FG7142 (a GABAA receptor partial inverse agonist), were administered acutely 30 min prior to testing on the task. (A) Acute restraint stress had no effect on the response latency, did not alter (B) the percentage positive responding, and there was no change in (C) change from baseline in cognitive bias index (CBI). (D) Both doses of FG7142 (3.0 and 5.0 mg/kg) increased response latency across all three tones. (E) FG7142 caused a significant reduction in percentage positive responding for the midpoint tone only for both doses. (F) This is supported by the negative change from baseline in CBI for both doses of FG7142. Data represent mean ± SEM; Acute restraint stress: n = 11; FG7142: n = 10. **p < 0.01, *p < 0.05, #p < 0.06. Veh–vehicle; HT—high reward tone; MT—midpoint tone; LT—low reward tone.CC BY · PubMed Central
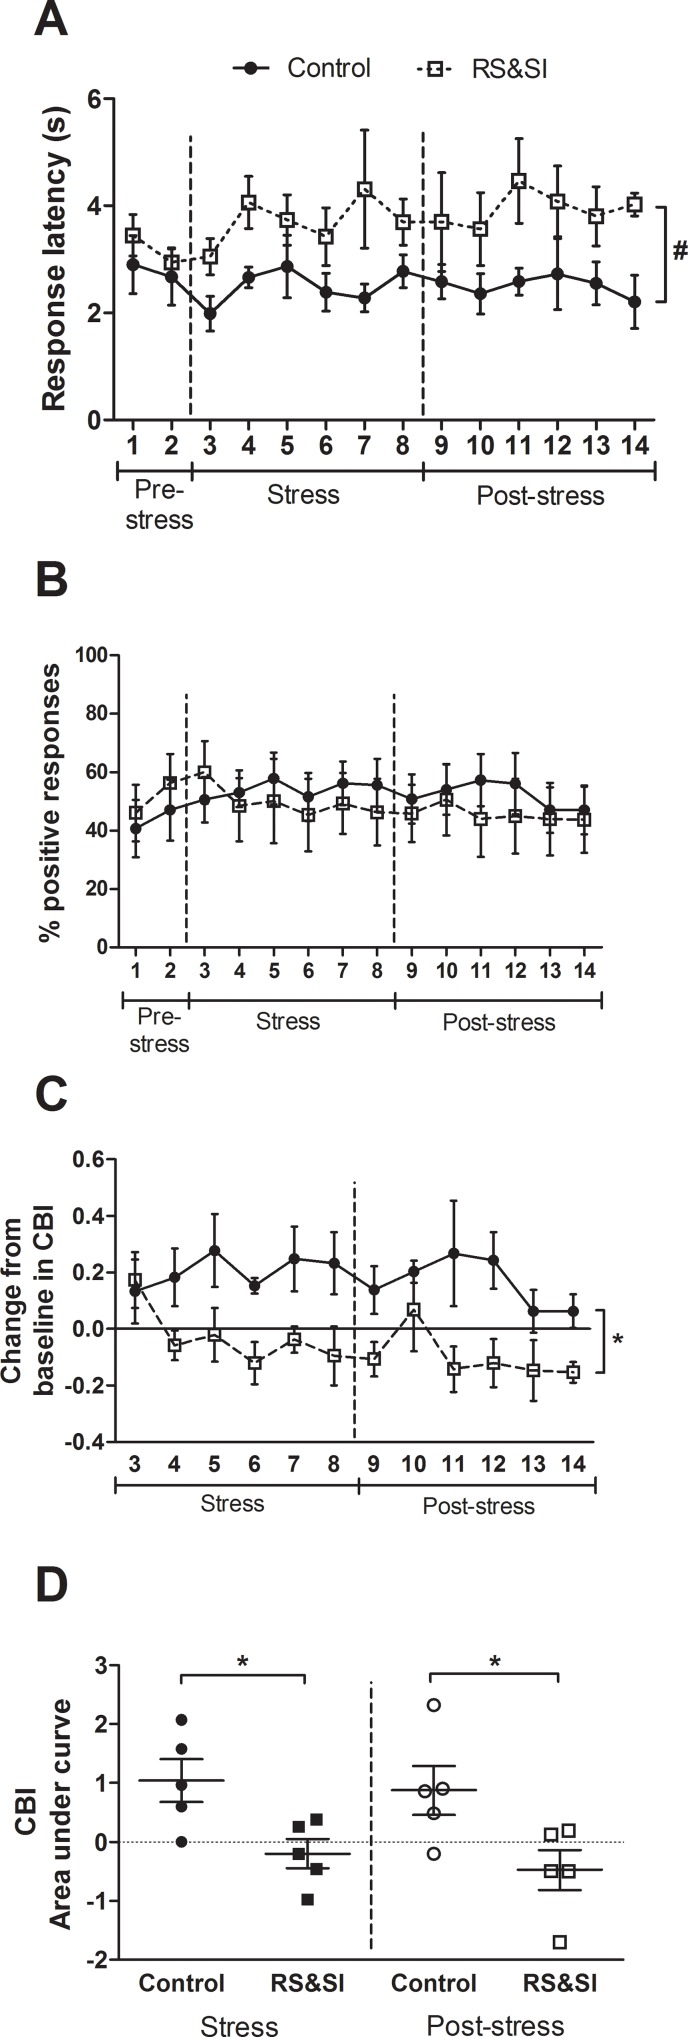
Fig 3 The effect of a chronic negative affective state manipulation on judgement bias. Rats assigned to the stress group experienced repeated restraint stress and social isolation (RS&SI) for three weeks. Twice weekly test sessions were conducted one week prior to stress (pre-stress; sessions 1–2), for the three weeks during RS&SI (stress; sessions 3–8) and for three weeks following return to control conditions (post-stress; sessions 9–14). Data are shown for the midpoint tone only. (A) RS&SI seemed to make rats slower to respond during stress and post-stress sessions. (B) There was no clear effect of RS&SI on the percentage positive responding. (C) Rats in the RS&SI group showed a significantly negative change from baseline in cognitive bias index (CBI) compared to controls. (D) Summarising the change from baseline in CBI over the six stress and six post-stress session by calculating the area under the curve for this measure for individual rats indicated that RS&SI caused a significant negative bias, during both the stress and post-stress periods. Data represent mean ± SEM; n = 5 per group. *p < 0.05, #p < 0.06.
Fig 3 The effect of a chronic negative affective state manipulation on judgement bias. Rats assigned to the stress group experienced repeated restraint stress and social isolation (RS&SI) for three weeks. Twice weekly test sessions were conducted one week prior to stress (pre-stress; sessions 1–2), for the three weeks during RS&SI (stress; sessions 3–8) and for three weeks following return to control conditions (post-stress; sessions 9–14). Data are shown for the midpoint tone only. (A) RS&SI seemed to make rats slower to respond during stress and post-stress sessions. (B) There was no clear effect of RS&SI on the percentage positive responding. (C) Rats in the RS&SI group showed a significantly negative change from baseline in cognitive bias index (CBI) compared to controls. (D) Summarising the change from baseline in CBI over the six stress and six post-stress session by calculating the area under the curve for this measure for individual rats indicated that RS&SI caused a significant negative bias, during both the stress and post-stress periods. Data represent mean ± SEM; n = 5 per group. *p < 0.05, #p < 0.06.CC BY · PubMed Central
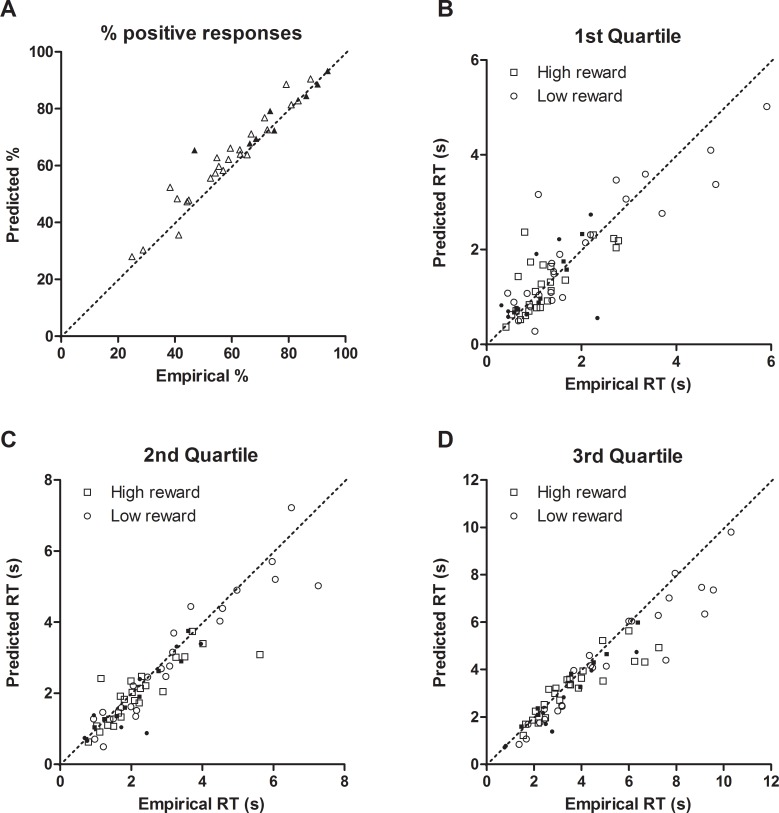
Fig 4 Diffusion model fit validation comparing empirical and predicted data. Graphical analysis of model fit comparing behavioural (empirical) and model (predicted) data. Data points lie close to the main diagonal (dotted line) for both (A) the percentage of positive responses and (B/C/D) the values for response times (RTs) from the three quartiles of the cumulative distribution functions for the midpoint tone, indicating good model fit. For RTs, squares represent the distribution for high reward responses, while circles represent the distribution for low reward responses. Each symbol corresponds to the data value for one rat on one probe test session. Filled symbols represent rats that were then consistently excluded from all behavioural experiments, and were therefore not included in any further analysis. Importantly, these points are randomly distributed amongst the data.
Fig 4 Diffusion model fit validation comparing empirical and predicted data. Graphical analysis of model fit comparing behavioural (empirical) and model (predicted) data. Data points lie close to the main diagonal (dotted line) for both (A) the percentage of positive responses and (B/C/D) the values for response times (RTs) from the three quartiles of the cumulative distribution functions for the midpoint tone, indicating good model fit. For RTs, squares represent the distribution for high reward responses, while circles represent the distribution for low reward responses. Each symbol corresponds to the data value for one rat on one probe test session. Filled symbols represent rats that were then consistently excluded from all behavioural experiments, and were therefore not included in any further analysis. Importantly, these points are randomly distributed amongst the data.CC BY · PubMed Central
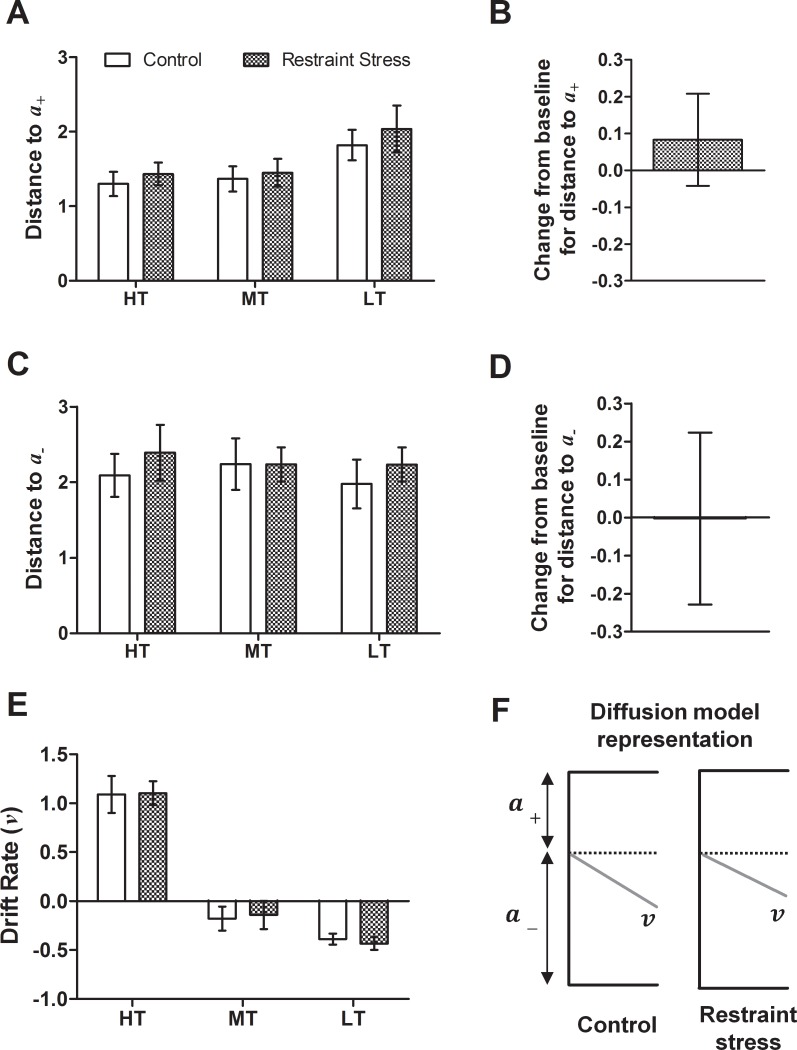
Fig 5 Diffusion model parameters for data from the acute restraint stress manipulation. Three parameters—distance to the upper boundary (a+; A/B), distance to the lower boundary (a-; C/D) and drift rate (v) were analysed for each tone. Change from baseline (control session) for a+ and a- was also calculated for the midpoint tone only to take into account individual differences in underlying bias. Acute restraint stress did not alter (A/B) a+; (C/D) a- or (E) v. (F) Diagrammatic representation of diffusion model parameters for the midpoint tone only for this manipulation. Illustrations are to scale representing mean values for each measure, and are aligned to decision starting point (dotted line). Drift rate is scaled 5:1. Data represent mean ± SEM; n = 11. HT—high reward tone; MT—midpoint tone; LT—low reward tone.
Fig 5 Diffusion model parameters for data from the acute restraint stress manipulation. Three parameters—distance to the upper boundary (a+; A/B), distance to the lower boundary (a-; C/D) and drift rate (v) were analysed for each tone. Change from baseline (control session) for a+ and a- was also calculated for the midpoint tone only to take into account individual differences in underlying bias. Acute restraint stress did not alter (A/B) a+; (C/D) a- or (E) v. (F) Diagrammatic representation of diffusion model parameters for the midpoint tone only for this manipulation. Illustrations are to scale representing mean values for each measure, and are aligned to decision starting point (dotted line). Drift rate is scaled 5:1. Data represent mean ± SEM; n = 11. HT—high reward tone; MT—midpoint tone; LT—low reward tone.CC BY · PubMed Central
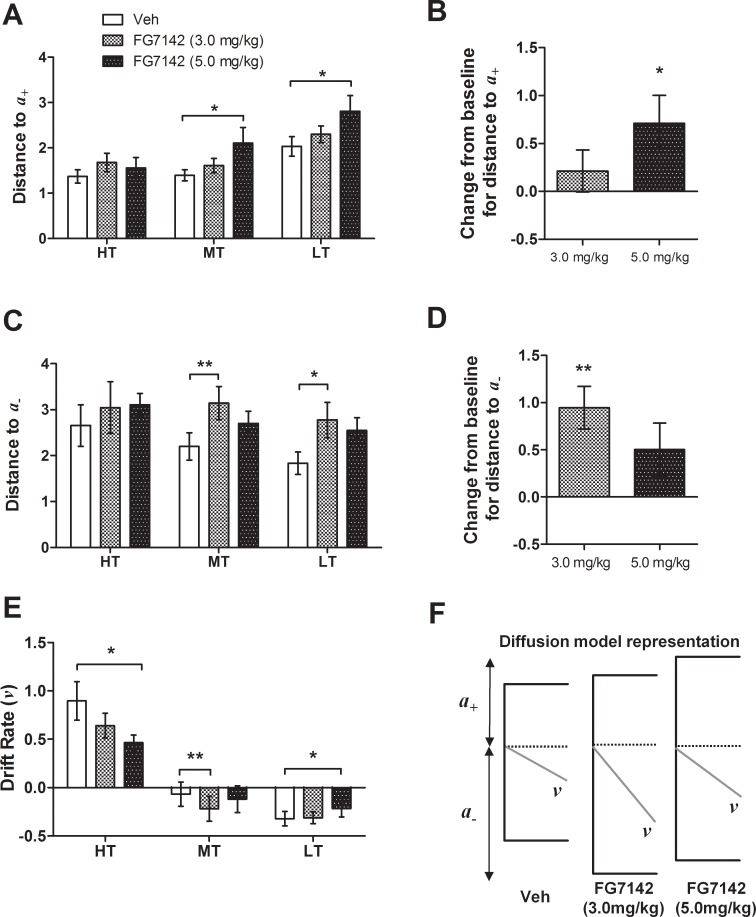
Fig 6 Diffusion model parameters for data from acute FG7142 treatment. Three parameters—distance to the upper boundary (a+; A/B), distance to the lower boundary (a-; C/D) and drift rate (v) were analysed for each tone. Change from baseline (control session) for a+ and a- was also calculated for the midpoint tone only to take into account individual differences in underlying bias. (A/B) The higher dose of FG7142 (5.0 mg/kg) only caused a significant increase and positive change from baseline in a+ for the midpoint and low reward tones. (C/D) The lower dose of FG7142 (3.0 mg/kg) only caused a significant increase and positive change from baseline in a- for the midpoint and low reward tones. (E) FG7142 differentially altered v dependent on both tone and dose. (F) Diagrammatic representation of the diffusion model parameters for the midpoint tone only for this manipulation. Illustrations are to scale representing mean values for each measure, and are aligned to decision starting point (dotted line). Drift rate is scaled 10:1 to more clearly illustrate changes. Graph data represent means ± SEM; n = 10. **p < 0.01, *p < 0.05. Veh–vehicle; HT—high reward tone; MT—midpoint tone; LT—low reward tone.
Fig 6 Diffusion model parameters for data from acute FG7142 treatment. Three parameters—distance to the upper boundary (a+; A/B), distance to the lower boundary (a-; C/D) and drift rate (v) were analysed for each tone. Change from baseline (control session) for a+ and a- was also calculated for the midpoint tone only to take into account individual differences in underlying bias. (A/B) The higher dose of FG7142 (5.0 mg/kg) only caused a significant increase and positive change from baseline in a+ for the midpoint and low reward tones. (C/D) The lower dose of FG7142 (3.0 mg/kg) only caused a significant increase and positive change from baseline in a- for the midpoint and low reward tones. (E) FG7142 differentially altered v dependent on both tone and dose. (F) Diagrammatic representation of the diffusion model parameters for the midpoint tone only for this manipulation. Illustrations are to scale representing mean values for each measure, and are aligned to decision starting point (dotted line). Drift rate is scaled 10:1 to more clearly illustrate changes. Graph data represent means ± SEM; n = 10. **p < 0.01, *p < 0.05. Veh–vehicle; HT—high reward tone; MT—midpoint tone; LT—low reward tone.CC BY · PubMed Central
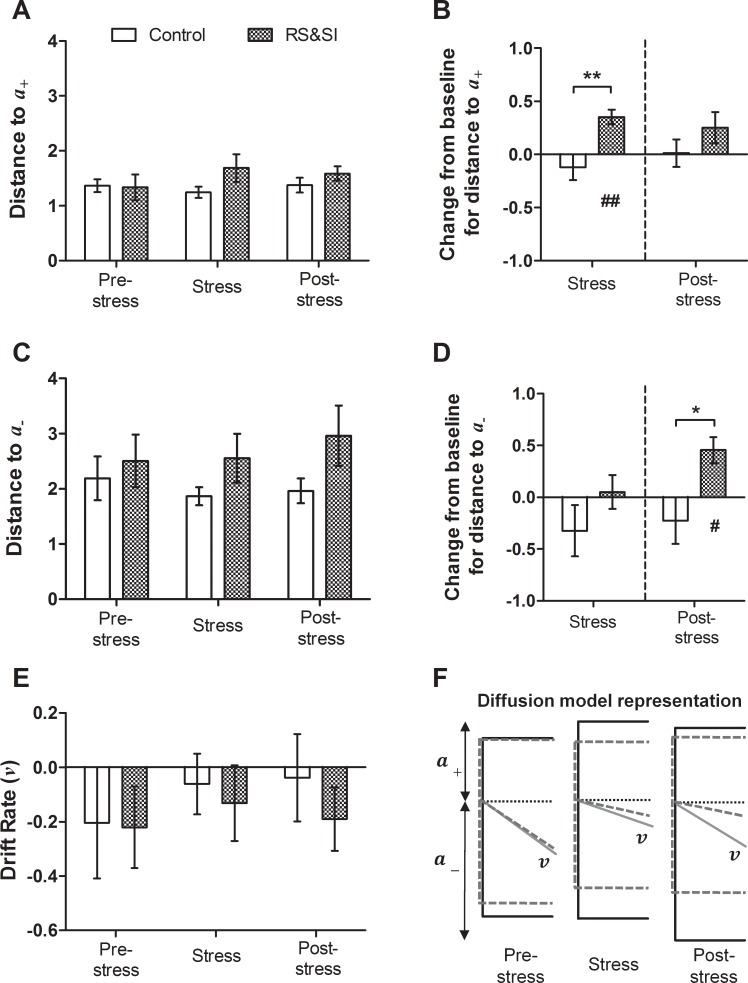
Fig 7 Diffusion model parameters for data from Experiment 2. Three parameters—distance to the upper boundary (a+; A/B), distance to the lower boundary (a-; C/D) and drift rate (v) were analysed for each tone. Change from baseline (control session) for a+ and a- was also calculated for the midpoint tone only to take into account individual differences in underlying bias. Data shown are averages for all probe sessions during that experimental period. (A) Changes in a+ in the restraint stress and social isolation (RS&SI) group compared to control group were unclear from the overall analysis of this measure. (B) However, during stress only, change from baseline in a+ was positive in the RS&SI group, and significantly larger compared to controls. (C) The effect of RS&SI on the a- was again unclear from the overall analysis. (D) During the post-stress period only, a positive change from baseline in a- was seen in the RS&SI group, and was also significantly larger compared to controls. (E) There was no difference in v between the RS&SI and control group during any stage of the manipulation. (F) Diagrammatic representation of diffusion model parameters for the control (dashed lines) and RS&SI group (solid lines) for the midpoint tone only for this manipulation. Illustrations are to scale representing mean values for each parameter, and are aligned to decision starting point (dotted line). Drift rate is scaled 5:1. Graph data represent mean ± SEM; n = 5 per group. Independent samples t-tests to compare groups: **p < 0.01, *p < 0.05; one-sample t-tests to compare to baseline: ##p < 0.01, #p < 0.05.
Fig 7 Diffusion model parameters for data from Experiment 2. Three parameters—distance to the upper boundary (a+; A/B), distance to the lower boundary (a-; C/D) and drift rate (v) were analysed for each tone. Change from baseline (control session) for a+ and a- was also calculated for the midpoint tone only to take into account individual differences in underlying bias. Data shown are averages for all probe sessions during that experimental period. (A) Changes in a+ in the restraint stress and social isolation (RS&SI) group compared to control group were unclear from the overall analysis of this measure. (B) However, during stress only, change from baseline in a+ was positive in the RS&SI group, and significantly larger compared to controls. (C) The effect of RS&SI on the a- was again unclear from the overall analysis. (D) During the post-stress period only, a positive change from baseline in a- was seen in the RS&SI group, and was also significantly larger compared to controls. (E) There was no difference in v between the RS&SI and control group during any stage of the manipulation. (F) Diagrammatic representation of diffusion model parameters for the control (dashed lines) and RS&SI group (solid lines) for the midpoint tone only for this manipulation. Illustrations are to scale representing mean values for each parameter, and are aligned to decision starting point (dotted line). Drift rate is scaled 5:1. Graph data represent mean ± SEM; n = 5 per group. Independent samples t-tests to compare groups: **p < 0.01, *p < 0.05; one-sample t-tests to compare to baseline: ##p < 0.01, #p < 0.05.CC BY · PubMed Central
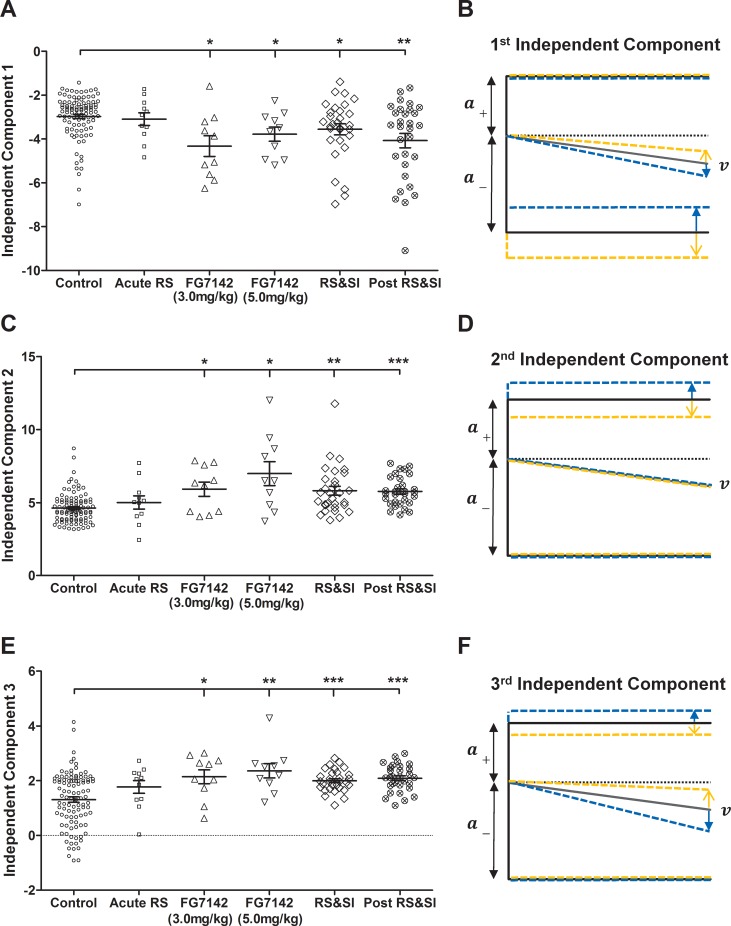
Fig 8 Independent Component Analysis scores calculated from diffusion model parameter data. Independent Component Analysis (ICA) was conducted on distance to the upper boundary (a+), distance to the lower boundary (a-) and drift rate (v) data for control data for the midpoint tone only. Negative manipulation data was then projected using the independent components found. (A/C/E) Independent component scores showing the distribution of parameter data for each manipulation. Scores for all three independent components are significantly different for both doses of FG7142 and the stress and post-stress periods of Experiment 2. Control data from all negative affective state manipulations are shown together. Each symbol represents the data from a single session for a single rat for that manipulation, mean ± SEM is shown by the black line and error bar for each manipulation. (B/D/F) Diagrammatic representations of the direction of change of diffusion model parameter values for control data (yellow) and negative affective state manipulation data (blue) described by the independent component. Black lines represent mean values for parameters from all data (control and negative manipulations). (B) The first independent component describes increased expectation for the low reward and more negative interpretation of the ambiguous cue for negative affective state manipulations compared to control. (D) The second independent component reflects reduced anticipation for the high reward for negative manipulation data. (F) The third independent component comprises reduced expectation for the high reward and more negative interpretation of the ambiguous cue for the negative affective state manipulations. ***p < 0.001, **p < 0.01, *p < 0.05. RS—restraint stress; RS&SI—restraint stress and social isolation.
Fig 8 Independent Component Analysis scores calculated from diffusion model parameter data. Independent Component Analysis (ICA) was conducted on distance to the upper boundary (a+), distance to the lower boundary (a-) and drift rate (v) data for control data for the midpoint tone only. Negative manipulation data was then projected using the independent components found. (A/C/E) Independent component scores showing the distribution of parameter data for each manipulation. Scores for all three independent components are significantly different for both doses of FG7142 and the stress and post-stress periods of Experiment 2. Control data from all negative affective state manipulations are shown together. Each symbol represents the data from a single session for a single rat for that manipulation, mean ± SEM is shown by the black line and error bar for each manipulation. (B/D/F) Diagrammatic representations of the direction of change of diffusion model parameter values for control data (yellow) and negative affective state manipulation data (blue) described by the independent component. Black lines represent mean values for parameters from all data (control and negative manipulations). (B) The first independent component describes increased expectation for the low reward and more negative interpretation of the ambiguous cue for negative affective state manipulations compared to control. (D) The second independent component reflects reduced anticipation for the high reward for negative manipulation data. (F) The third independent component comprises reduced expectation for the high reward and more negative interpretation of the ambiguous cue for the negative affective state manipulations. ***p < 0.001, **p < 0.01, *p < 0.05. RS—restraint stress; RS&SI—restraint stress and social isolation.CC BY · PubMed Central

Verification

Claims the paper makes

The claims and statistics of this paper haven’t been checked yet.

Free: it reads the open-access text and checks the first 5 claims that cite a source we can check. Create a free account to check every claim.

A few free checks a day · papers already verified open instantly · results are public

Claims other papers make about this one

Each is checked against this paper’s own text: does it say what the citing paper says it does?

Self-check

Percentages, sums and reported differences re-computed from the paper’s own numbers.

The self-check needs the paper’s full text.

Citations

Cites

Show all 78 references

Cited by

See all 58

Metadata

Authors
Hales, C. A., Robinson, E. S. J., & Houghton, C. J.
Affiliations
University of Bristol (GB)
Corresponding author
Houghton, Conor J.
Venue
PLOS ONE
Published
2016-03-29
Volume
11
Issue
3
Pages
e0152592
ISSN
1932-6203 (ISSN-L)
OpenAlex
W2335145190
Cited by
49
References
78
Citations by year
2026: 3 · 2025: 3 · 2024: 2 · 2023: 1 · 2022: 10 · 2021: 7 · 2020: 8 · 2019: 5 · 2018: 5 · 2017: 4
FWCI
2.97
Type
journal article
Language
en
Open access
Locations
  • PLoS ONE (publishedVersion, cc-by)
  • PubMed Central (publishedVersion, cc-by)
  • PubMed (publishedVersion)
  • RePEc: Research Papers in Economics (submittedVersion, cc-by)
  • DOAJ (DOAJ: Directory of Open Access Journals) (submittedVersion, cc-by-sa)
  • Figshare (submittedVersion, cc-by)
  • Explore Bristol Research (submittedVersion, cc-by)
  • Bristol Research (University of Bristol) (submittedVersion, cc-by)
Funders
  • James S. McDonnell Foundation (JSMF #220020239, 220020239)
  • Eli Lilly and Company
  • Pfizer
  • Wellcome Trust (099699/Z/12/Z, 097822/Z/11/ZR, 097822, 099699)
  • International Seafood Sustainability Foundation
  • Cancer Research UK
  • British Pharmacological Society
  • Research Councils UK
  • University of Bristol
  • Medical Research Council
  • Biotechnology and Biological Sciences Research Council
Topics
  • Life Sciences › Neuroscience › Cognitive Neuroscience › Neural and Behavioral Psychology Studies
  • Social Sciences › Decision Sciences › General Decision Sciences › Decision-Making and Behavioral Economics
  • Life Sciences › Neuroscience › Cognitive Neuroscience › Memory and Neural Mechanisms
Keywords
judgment bias, negative emotions, decision-making, diffusion models, FG 7142, anxiogenic drugs, chronic restraint stress, social isolation, decision threshold, reward anticipation, rats
MeSH terms
Animals, Behavior, Animal, Decision Making, Diffusion, Judgment, Male, Models, Theoretical, Task Performance and Analysis, Reproducibility of Results, Bias, Principal Component Analysis, Rats

About these checks

Registry, retraction, Cites and statistics results are computed, not judged, with one exception: a printed reference that no index lists is read once by a model before it counts as a citation error. Claims are extracted by a model and kept only when their quote appears verbatim in the text; each cited source is then checked, with a model’s help, for whether it says what the claim relies on. Those verdicts can be wrong — read the claim’s quote and the cited source before relying on one.

Statistics and arithmetic are recomputed, not judged.

Confidence bands are shown only for fields calibrated on our annotated test set. None is calibrated yet, so no band is shown.

What counts as a claim ›How we measure confidence ›How we check this ›

Are you an author, or do you see a problem with this page? Request a review

How to cite

Cite CoChat for the checks on this page, and the paper for its own findings.

This page
CoChat. (2026). Citation check: Diffusion Modelling Reveals the Decision Making Processes Underlying Negative Judgement Bias in Rats. https://app.cochat.ai/papers/10.1371/journal.pone.0152592
The paper
Hales, C. A., Robinson, E. S. J., & Houghton, C. J. (2016). Diffusion Modelling Reveals the Decision Making Processes Underlying Negative Judgement Bias in Rats. PLOS ONE. https://doi.org/10.1371/journal.pone.0152592

Data sources

Bibliographic data: Semantic Scholar, OpenAlex, Crossref.

Contains information from the Semantic Scholar Academic Graph Datasets, made available under the ODC Attribution License (ODC-BY 1.0).

Semantic Scholar’s data is described in: Kinney, R., et al. (2023). The Semantic Scholar Open Data Platform. arXiv:2301.10140.