

A Robust Protocol for Using Multiplexed Droplet Digital PCR to Quantify Somatic Copy Number Alterations in Clinical Tissue Specimens
Open accessThe DOI matches its Crossref record; 53 of the 53 references it cites were found in a registry or an index.
Abstract
The ability of droplet digital PCR (ddPCR) to accurately determine the concentrations of amplifiable targets makes it a promising platform for measuring copy number alterations (CNAs) in genomic biomarkers. However, its application to clinical samples, particularly formalin-fixed paraffin-embedded specimens, will require strategies to reliably determine CNAs in DNA of limited quantity and quality. When applied to cancerous tissue, those methods must also account for global genetic instability and the associated probability that the abundance(s) of one or more chosen reference loci do not represent the average ploidy of cells comprising the specimen. Here we present an experimental design strategy and associated data analysis tool that enables accurate determination of CNAs in a panel of biomarkers using multiplexed ddPCR. The method includes strategies to optimize primer and probes design to cleanly segregate droplets in the data output from reaction wells amplifying multiple independent templates, and to correct for bias from artifacts such as DNA fragmentation. We demonstrate how a panel of reference loci can be used to determine a stable CNA-neutral benchmark. These innovations, when taken together, provide a comprehensive strategy that can be used to reliably detect biomarker CNAs in DNA extracted from either frozen or FFPE tissue biopsies.
Overview
The claims and statistics of this paper haven’t been checked yet.
Free: it reads the open-access text and checks the first 5 claims that cite a source we can check. Create a free account to check every claim.
Integrity signals
Registry
Cites
Statistics
Figures

Verification
Claims the paper makes
The claims and statistics of this paper haven’t been checked yet.
Free: it reads the open-access text and checks the first 5 claims that cite a source we can check. Create a free account to check every claim.
Claims other papers make about this one
Each is checked against this paper’s own text: does it say what the citing paper says it does?
The source backs part of the claim, not all of it — or backs it for a different population, condition or comparison.
In the citing paper
“In addition, end-point measurement enables nucleic acid quantitation independently of the reaction efficiency, resulting in a positive-negative call for every droplet and greater amenability to multiplexed detection of target molecules14.”
From Droplet Digital PCR versus qPCR for gene expression analysis with low abundant targets: from variable nonsense to publication quality data (2017) · cites this paper as [14]
Experimental — accuracy not yet measured
Self-check
Percentages, sums and reported differences re-computed from the paper’s own numbers.
The self-check needs the paper’s full text.
Citations
Cites
Hallmarks of Cancer: The Next Generation
Hanahan, D., & Weinberg, R. A. (2011) · Cell · doi:10.1016/j.cell.2011.02.013 · Cited by 66,590
The Human Genome Browser at UCSC
Kent, W. J., Sugnet, C. W., Furey, T. S., Roskin, K. M., Pringle, T. H., Zahler, A. M., & Haussler, A. D. (2002) · Genome Research · doi:10.1101/gr.229102 · Cited by 10,400 · cited 1×
“CGH array probes overlaying and/or proximal to each biomarker were identified using the UCSC Genome Browser NCBI35/hg17 assembly [40], and the resulting set of log 2 values for the probes were then averaged for comparison to CNAs for the corresponding biomarker(s) in that locus assayed by…”
Multiple comparisons among means
Dunn, O. J. (1961) · Journal of the American Statistical Association · doi:10.1080/01621459.1961.10482090 · Cited by 5,006
The landscape of somatic copy-number alteration across human cancers
Beroukhim, R., Mermel, C. H., Porter, D., Wei, G., Raychaudhuri, S., Donovan, J., Barretina, J., Boehm, J. S., Dobson, J., Urashima, M., et al. (2010) · Nature · doi:10.1038/nature08822 · Cited by 4,017
Comparative Genomic Hybridization for Molecular Cytogenetic Analysis of Solid Tumors
Kallioniemi, A., Kallioniemi, O.-P., Sudar, D., Rutovitz, D., Gray, J. W., Waldman, F., & Pinkel, D. (1992) · Science · doi:10.1126/science.1359641 · Cited by 3,297
High-throughput droplet digital PCR system for absolute quantitation of DNA copy number
Hindson, B. J., Ness, K. D., Masquelier, D. A., Belgrader, P., Heredia, N. J., Makarewicz, A. J., Bright, I. J., Lucero, M. Y., Hiddessen, A. L., Legler, T. C., et al. (2011) · Analytical Chemistry · doi:10.1021/ac202028g · Cited by 2,792 · cited 2×
“RPP30 , which has often been used as a single reference locus for determining CNAs from digital PCR data [17, 22, 26], does not remain stable in all tissue samples.”
Schouten, J. P. (2002) · Nucleic Acids Research · doi:10.1093/nar/gnf056 · Cited by 2,699
Pan-cancer patterns of somatic copy number alteration
Zack, T. I., Schumacher, S. E., Carter, S. L., Cherniack, A. D., Saksena, G., Tabak, B., Lawrence, M. S., Zhang, C.-Z., Wala, J., Mermel, C. H., et al. (2013) · Nature Genetics · doi:10.1038/ng.2760 · Cited by 1,870
Vogelstein, B., & Kinzler, K. W. (1999) · Proceedings of the National Academy of Sciences · doi:10.1073/pnas.96.16.9236 · Cited by 1,770 · cited 1×
“Digital PCR [16], most notably droplet digital PCR (ddPCR) [17], is an emerging technology that has been used to quantify CNAs within a genomic target (biomarker) [18], including gains in HER2 prognostic of breast cancer [19, 20] and in the fibroblast growth factor receptor 2 ( FGFR2 ) associated…”
Assembly of microarrays for genome-wide measurement of DNA copy number
Snijders, A. M., Nowak, N., Segraves, R., Blackwood, S., Brown, N., Conroy, J., Hamilton, G., Hindle, A. K., Huey, B., Kimura, K., et al. (2001) · Nature Genetics · doi:10.1038/ng754 · Cited by 999
Pan-cancer analysis of the extent and consequences of intratumor heterogeneity
Andor, N., Graham, T. A., Jansen, M., Xia, L. C., Aktipis, C. A., Petritsch, C., Ji, H. P., & Maley, C. C. (2016) · Nature Medicine · doi:10.1038/nm.3984 · Cited by 768
Sequence Artifacts in DNA from Formalin-Fixed Tissues: Causes and Strategies for Minimization
Do, H., & Dobrovic, A. (2015) · Clinical Chemistry · doi:10.1373/clinchem.2014.223040 · Cited by 572
High-resolution genomic profiling of chromosomal aberrations using Infinium whole-genome genotyping
Peiffer, D. A., Le, J. M., Steemers, F. J., Chang, W., Jenniges, T., Garcia, F., Haden, K., Li, J., Shaw, C. A., Belmont, J., et al. (2006) · Genome Research · doi:10.1101/gr.5402306 · Cited by 519
Scheinin, I., Sie, D., Bengtsson, H., van de Wiel, M. A., Olshen, A. B., van Thuijl, H. F., van Essen, H. F., Eijk, P. P., Rustenburg, F., Meijer, G. A., et al. (2014) · Genome Research · doi:10.1101/gr.175141.114 · Cited by 518
Whale, A. S., Huggett, J. F., Cowen, S., Speirs, V., Shaw, J., Ellison, S., Foy, C. A., & Scott, D. J. (2012) · Nucleic Acids Research · doi:10.1093/nar/gks203 · Cited by 453
Hedegaard, J., Thorsen, K., Lund, M. K., Hein, A.-M. K., Hamilton-Dutoit, S. J., Vang, S., Nordentoft, I., Birkenkamp-Demtröder, K., Kruhøffer, M., Hager, H., et al. (2014) · PLoS ONE · doi:10.1371/journal.pone.0098187 · Cited by 378
Accurate and objective copy number profiling using real-time quantitative PCR
D’haene, B., Vandesompele, J., & Hellemans, J. (2010) · Methods · doi:10.1016/j.ymeth.2009.12.007 · Cited by 336
Heyries, K. A., Tropini, C., VanInsberghe, M., Doolin, C., Petriv, O. I., Singhal, A., Leung, K., Hughesman, C. B., & Hansen, C. L. (2011) · Nature Methods · doi:10.1038/nmeth.1640 · Cited by 305
Self-citationDube, S., Qin, J., & Ramakrishnan, R. (2008) · PLoS ONE · doi:10.1371/journal.pone.0002876 · Cited by 302
Multiplex digital PCR: breaking the one target per color barrier of quantitative PCR
Zhong, Q., Bhattacharya, S., Kotsopoulos, S., Olson, J., Taly, V., Griffiths, A. D., Link, D. R., & Larson, J. W. (2011) · Lab on a Chip · doi:10.1039/c1lc20126c · Cited by 297
源��쁽�꽍 (2016) · YUHSpace (Yonsei University Medical Library) · doi:10.1158/1940-6207 · Cited by 256
Miotke, L., Lau, B. T., Rumma, R. T., & Ji, H. P. (2014) · Analytical Chemistry · doi:10.1021/ac403843j · Cited by 235
Genomic instability and cancer: an introduction
Shen, Z. (2011) · Journal of Molecular Cell Biology · doi:10.1093/jmcb/mjq057 · Cited by 229 · cited 1×
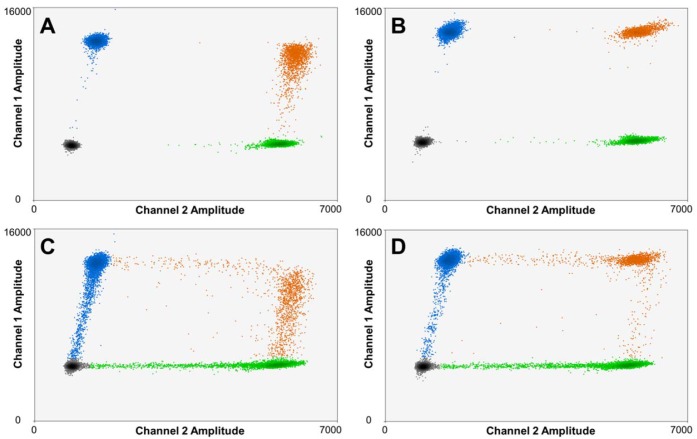
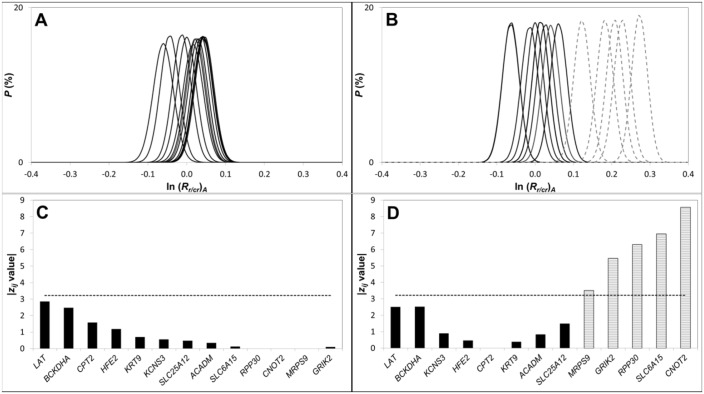
“As a result, only a subset of the N tot candidate reference loci then have a z ij value below z crit (Fig 4D), presumably due to CNAs in some of these loci as a consequence of global genetic instability associated with disease progression [47, 48].”
Loss of Heterozygosity (LOH) Profiles—Validated Risk Predictors for Progression to Oral Cancer
Zhang, L., Poh, C. F., Williams, M., Laronde, D. M., Berean, K., Gardner, P. J., Jiang, H., Wu, L., Lee, J. J., & Rosin, M. P. (2012) · Cancer Prevention Research · doi:10.1158/1940-6207.capr-12-0173 · Cited by 212
Self-citationYlstra, B. (2006) · Nucleic Acids Research · doi:10.1093/nar/gkj456 · Cited by 207
Abbas, T., Keaton, M. A., & Dutta, A. (2013) · Cold Spring Harbor Perspectives in Biology · doi:10.1101/cshperspect.a012914 · Cited by 195
Day, E., Dear, P. H., & McCaughan, F. (2013) · Methods · doi:10.1016/j.ymeth.2012.08.001 · Cited by 191
Multiplexed Target Detection Using DNA-Binding Dye Chemistry in Droplet Digital PCR
McDermott, G. P., Do, D., Litterst, C. M., Maar, D., Hindson, C. M., Steenblock, E. R., Legler, T. C., Jouvenot, Y., Marrs, S. H., Bemis, A., et al. (2013) · Analytical Chemistry · doi:10.1021/ac403061n · Cited by 190
ddpcRquant: threshold determination for single channel droplet digital PCR experiments
Trypsteen, W., Vynck, M., Neve, J. D., Bonczkowski, P., Kiselinova, M., Malatinková, E., Vervisch, K., Thas, O., Vandekerckhove, L., & Spiegelaere, W. D. (2015) · Analytical and Bioanalytical Chemistry · doi:10.1007/s00216-015-8773-4 · Cited by 154
Current approaches and future directions in the treatment of HER2-positive breast cancer
Hurvitz, S. A., Hu, Y., O’Brien, N., & Finn, R. S. (2013) · Cancer Treatment Reviews · doi:10.1016/j.ctrv.2012.04.008 · Cited by 150
Hu, L., Ru, K., Zhang, L., Huang, Y.-T., Zhu, X., Liu, H., Zetterberg, A., Cheng, T., & Miao, W. (2014) · Biomarker Research · doi:10.1186/2050-7771-2-3 · Cited by 134
Didelot, A., Kotsopoulos, S. K., Mansuet‐Lupo, A., Pekin, D., Li, X., Atochin, I., Srinivasan, P., Zhong, Q., Olson, J., Link, D. R., et al. (2013) · Clinical Chemistry · doi:10.1373/clinchem.2012.193409 · Cited by 122
Okello, J. B. A., Zurek, J., Devault, A. M., Kuch, M., Livex, O. A., Sewankambo, N. K., Bimenya, G. S., Poinar, D., & Poinar, H. N. (2010) · Analytical Biochemistry · doi:10.1016/j.ab.2010.01.014 · Cited by 120
Liu, B., Morrison, C. D., Johnson, C. S., Trump, D. L., Qin, M., Conroy, J., Wang, J., & Liu, S. (2013) · Oncotarget · doi:10.18632/oncotarget.1537 · Cited by 110
Droplet digital PCR measurement of HER2 in patients with gastric cancer
Kinugasa, H., Nouso, K., Tanaka, T., Miyahara, K., Morimoto, Y., Dohi, C., Matsubara, T., Okada, H., & Yamamoto, K. (2015) · British Journal of Cancer · doi:10.1038/bjc.2015.129 · Cited by 85
Current analysis platforms and methods for detecting copy number variation
Li, W., & Olivier, M. (2013) · Physiological Genomics · doi:10.1152/physiolgenomics.00082.2012 · Cited by 82
Belgrader, P., Tanner, S. C., Regan, J. F., Koehler, R. T., Hindson, B. J., & Brown, A. S. (2013) · Clinical Chemistry · doi:10.1373/clinchem.2012.197855 · Cited by 81
Patterns of Chromosomal Aberrations in Solid Tumors
Grade, M., Difilippantonio, M. J., & Camps, J. (2015) · Recent results in cancer research/Recent Results in Cancer Research · doi:10.1007/978-3-319-20291-4_6 · Cited by 70
Genomic DNA copy number alterations from precursor oral lesions to oral squamous cell carcinoma
Salahshourifar, I., Vincent–Chong, V. K., Kallarakkal, T. G., & Zain, R. B. (2014) · Oral Oncology · doi:10.1016/j.oraloncology.2014.02.005 · Cited by 54
Somatic copy number alterations predict response to platinum therapy in epithelial ovarian cancer
Despierre, E., Moisse, M., Yesilyurt, B. T., Sehouli, J., Braicu, E. I., Mahner, S., Castillo‐Tong, D. C., Zeillinger, R., Lambrechts, S., Leunen, K., et al. (2014) · Gynecologic Oncology · doi:10.1016/j.ygyno.2014.09.014 · Cited by 54
Nadauld, L. D., Regan, J. F., Miotke, L. K., Pai, R. K., Longacre, T. A., Kwok, S. S., Saxonov, S., Ford, J. M., & Ji, H. P. (2012) · Translational Medicine · doi:10.4172/2161-1025.1000107 · Cited by 47
Bidshahri, R., Attali, D., Fakhfakh, K., McNeil, K., Karsan, A., Won, J., Wolber, R. A., Bryan, J., Hughesman, C. B., & Haynes, C. A. (2016) · Journal of Molecular Diagnostics · doi:10.1016/j.jmoldx.2015.09.003 · Cited by 41
Self-citationDetermination of HER2 Amplification Status on Tumour DNA by Digital PCR
García-Murillas, I., Lambros, M. B. K., & Turner, N. C. (2013) · PLoS ONE · doi:10.1371/journal.pone.0083409 · Cited by 38
Unique FISH Patterns Associated with Cancer Progression of Oral Dysplasia
Poh, C. F.-Y., Zhu, Y., Chen, E., Berean, K. W., Wu, L., Zhang, L., & Rosin, M. P. (2011) · Journal of Dental Research · doi:10.1177/0022034511425676 · Cited by 35
Self-citationDorazio, R. M., & Hunter, M. E. (2015) · Analytical Chemistry · doi:10.1021/acs.analchem.5b02429 · Cited by 34
Incorporation of Measurement of DNA Integrity into qPCR Assays
Brisco, M. J., Latham, S., Bartley, P. A., & Morley, A. A. (2010) · BioTechniques · doi:10.2144/000113567 · Cited by 33
Tsui, I. F. L., Garnis, C., & Poh, C. F.-Y. (2009) · The American Journal of Surgical Pathology · doi:10.1097/pas.0b013e3181b669c2 · Cited by 29
Self-citationKim, M. J., Cho, S. I., Chae, J., Lim, B. C., Lee, J.-S., Lee, S. J., Seo, S. H., Park, H., Cho, A., Kim, S. Y., et al. (2015) · Journal of Molecular Diagnostics · doi:10.1016/j.jmoldx.2015.11.002 · Cited by 29
Loss of heterozygosity analysis in malignant gliomas
Mizoguchi, M., Kuga, D., Guan, Y., Hata, N., Nakamizo, A., Yoshimoto, K., & Sasaki, T. (2011) · Brain Tumor Pathology · doi:10.1007/s10014-011-0038-0 · Cited by 28
Lund, H. L., Hughesman, C. B., McNeil, K., Clemens, S., Hocken, K., Pettersson, R., Karsan, A., Foster, L. J., & Haynes, C. A. (2015) · Analytical and Bioanalytical Chemistry · doi:10.1007/s00216-015-9204-2 · Cited by 17
Self-citationIntegrative molecular characterization of head and neck cancer cell model genomes
Tsui, I. F. L., & Garnis, C. (2009) · Head & Neck · doi:10.1002/hed.21311 · Cited by 13
Lund, H. L., Hughesman, C. B., Fakhfakh, K., McNeil, K., Clemens, S., Hocken, K., Pettersson, R., Karsan, A., Foster, L. J., & Haynes, C. A. (2016) · Analytical Chemistry · doi:10.1021/acs.analchem.6b00707 · Cited by 13
Self-citationHughesman, C., Fakhfakh, K., Bidshahri, R., Lund, H. L., & Haynes, C. (2015) · Biochemistry · doi:10.1021/bi500905b · Cited by 12
Self-citation
Cited by
Taylor, S. C., Laperriere, G., & Germain, H. (2017) · Scientific Reports · doi:10.1038/s41598-017-02217-x · Cited by 638
“In addition, end-point measurement enables nucleic acid quantitation independently of the reaction efficiency, resulting in a positive-negative call for every droplet and greater amenability to multiplexed detection of target molecules 14 .”
BackgroundCurrent and Emerging Applications of Droplet Digital PCR in Oncology
Olmedillas-López, S., García-Arranz, M., & García-Olmo, D. (2017) · Molecular Diagnosis & Therapy · doi:10.1007/s40291-017-0278-8 · Cited by 201
Alcaide, M., Cheung, M. C., Hillman, J., Rassekh, S. R., Deyell, R. J., Batist, G., Karsan, A., Wyatt, A. W., Johnson, N. A., Scott, D. W., et al. (2020) · Scientific Reports · doi:10.1038/s41598-020-69432-x · Cited by 128
Gao, M., Callari, M., Beddowes, E., Sammut, S.-J., Grzelak, M., Biggs, H., Jones, L., Boumertit, A., Linn, S. C., Cortes, J., et al. (2019) · Genome Medicine · doi:10.1186/s13073-018-0611-9 · Cited by 66
Alcaide, M., Cheung, M. C., Bushell, K. R., Arthur, S. E., Wong, H., Karasinska, J. M., Renouf, D. J., Schaeffer, D. F., McNamara, S., du Tertre, M. C., et al. (2018) · Journal of Molecular Diagnostics · doi:10.1016/j.jmoldx.2018.09.007 · Cited by 41
Metadata
- Authors
- Hughesman, C. B., Lu, X. J. D., Liu, K. Y. P., Zhu, Y., Poh, C. F., & Haynes, C.
- Affiliations
- University of British Columbia (CA)
- Natural Sciences and Engineering Research Council of Canada (CA)
- Corresponding author
- Poh, Catherine F.
- Haynes, Charles
- Venue
- PLOS ONE
- Publisher
- Public Library of Science (PLoS)
- Published
- 2016-08-18
- Volume
- 11
- Issue
- 8
- Pages
- e0161274
- ISSN
- 1932-6203 (ISSN-L)
- PMC
- PMC4990255
- OpenAlex
- W2508263135
- Cited by
- 46
- References
- 52
- Citations by year
- 2026: 1 · 2025: 6 · 2024: 4 · 2023: 5 · 2022: 4 · 2021: 6 · 2020: 4 · 2019: 6 · 2018: 6 · 2017: 4
- FWCI
- 2.22
- Type
- journal article
- Language
- en
- Open access
- gold
- doi.org
- Licence
- Locations
- PLoS ONE (publishedVersion, cc-by)
- PubMed Central (publishedVersion, cc-by)
- PubMed (publishedVersion)
- DOAJ (DOAJ: Directory of Open Access Journals) (submittedVersion)
- Figshare (submittedVersion, cc-by)
- Funders
- Genome British Columbia (SOF-7-2015)
- Topics
- Life Sciences › Biochemistry, Genetics and Molecular Biology › Cancer Research › Cancer Genomics and Diagnostics
- Life Sciences › Biochemistry, Genetics and Molecular Biology › Molecular Biology › Molecular Biology Techniques and Applications
- Life Sciences › Biochemistry, Genetics and Molecular Biology › Genetics › Genomic variations and chromosomal abnormalities
- Keywords
- droplet digital PCR, copy number alterations, somatic copy number alterations, formalin-fixed paraffin-embedded tissue, ploidy, primer and probe design, genomic biomarkers, cancer genomics, experimental design
- MeSH terms
- Biopsy, DNA, Genetic Markers, Humans, Ploidies, Gene Dosage, Oligonucleotide Array Sequence Analysis, DNA Fragmentation, DNA Copy Number Variations, Multiplex Polymerase Chain Reaction
About these checks
Registry, retraction, Cites and statistics results are computed, not judged, with one exception: a printed reference that no index lists is read once by a model before it counts as a citation error. Claims are extracted by a model and kept only when their quote appears verbatim in the text; each cited source is then checked, with a model’s help, for whether it says what the claim relies on. Those verdicts can be wrong — read the claim’s quote and the cited source before relying on one.
Statistics and arithmetic are recomputed, not judged.
Confidence bands are shown only for fields calibrated on our annotated test set. None is calibrated yet, so no band is shown.
What counts as a claim ›How we measure confidence ›How we check this ›
Are you an author, or do you see a problem with this page? Request a review
Data sources
Bibliographic data: Semantic Scholar, OpenAlex, Crossref.
Contains information from the Semantic Scholar Academic Graph Datasets, made available under the ODC Attribution License (ODC-BY 1.0).
Semantic Scholar’s data is described in: Kinney, R., et al. (2023). The Semantic Scholar Open Data Platform. arXiv:2301.10140.
