CoChat

Neural mechanisms underlying sensitivity to reverse-phi motion in the fly

Open access

The DOI matches its Crossref record; 77 of the 77 references it cites were found in a registry or an index.

Abstract

Optical illusions provide powerful tools for mapping the algorithms and circuits that underlie visual processing, revealing structure through atypical function. Of particular note in the study of motion detection has been the reverse-phi illusion. When contrast reversals accompany discrete movement, detected direction tends to invert. This occurs across a wide range of organisms, spanning humans and invertebrates. Here, we map an algorithmic account of the phenomenon onto neural circuitry in the fruit fly Drosophila melanogaster. Through targeted silencing experiments in tethered walking flies as well as electrophysiology and calcium imaging, we demonstrate that ON- or OFF-selective local motion detector cells T4 and T5 are sensitive to certain interactions between ON and OFF. A biologically plausible detector model accounts for subtle features of this particular form of illusory motion reversal, like the re-inversion of turning responses occurring at extreme stimulus velocities. In light of comparable circuit architecture in the mammalian retina, we suggest that similar mechanisms may apply even to human psychophysics.

Overview

The claims and statistics of this paper haven’t been checked yet.

Free: it reads the open-access text and checks the first 5 claims that cite a source we can check. Create a free account to check every claim.

A few free checks a day · papers already verified open instantly · results are public

Integrity signals

Registry

Crossref · 10.1371/journal.pone.0189019

Cites

77 of 77 references verified0 citation errors · 0 not checkable

Statistics

Figures

Fig 1 The neural architecture of motion detection in the fruit fly. a Stylized rendering of neuropils and cells involved in generating local and global motion signals in the ON-selective T4 pathway. b Corresponding schematic for the OFF-selective T5 pathway. Briefly, optical signals are transduced by photoreceptors in the retina, split into ON and OFF signals at the lamina level, processed by an array of interneurons in the medulla, and become direction selective through interactions on T4 and T5 dendrites. Finally, lobula plate tangential cells (LPTCs) select and pool appropriate local signals from four directionally tuned layers to generate complex flow field sensitivities.
Fig 1 The neural architecture of motion detection in the fruit fly. a Stylized rendering of neuropils and cells involved in generating local and global motion signals in the ON-selective T4 pathway. b Corresponding schematic for the OFF-selective T5 pathway. Briefly, optical signals are transduced by photoreceptors in the retina, split into ON and OFF signals at the lamina level, processed by an array of interneurons in the medulla, and become direction selective through interactions on T4 and T5 dendrites. Finally, lobula plate tangential cells (LPTCs) select and pool appropriate local signals from four directionally tuned layers to generate complex flow field sensitivities.CC BY · PubMed Central
Fig 2 Spectral properties of translating motion stimuli. a Space-time plot of a one-dimensional noise pattern moving to the right at constant speed (v = 60° s-1). b Magnitude spectrum of translating noise, with darkness indicating larger frequency contribution. For rigid motion toward the right, components cluster around a line connecting first and third quadrant (in green) via the origin, with slope indicating true velocity. Little magnitude is assigned to frequencies in the quadrants signaling leftward motion (in brown). c Left, space-time plot of a discretized square-wave grating (v = 60° s-1, λ = 60°, step width = 2°). Right, quantification of energy indicating right- and leftward motion, respectively. Energy was simply averaged within quadrants color-coded above. Energy distribution is not affected by half-wave rectification (i.e., zeroing either components below or above mean luminance for ON or OFF respectively). d Corresponding illustration and quantification for discretized reverse-phi stimulus. Energy distribution reverses for full-wave stimulus but signals veridical direction when rectification is applied (ON or OFF).
Fig 2 Spectral properties of translating motion stimuli. a Space-time plot of a one-dimensional noise pattern moving to the right at constant speed (v = 60° s-1). b Magnitude spectrum of translating noise, with darkness indicating larger frequency contribution. For rigid motion toward the right, components cluster around a line connecting first and third quadrant (in green) via the origin, with slope indicating true velocity. Little magnitude is assigned to frequencies in the quadrants signaling leftward motion (in brown). c Left, space-time plot of a discretized square-wave grating (v = 60° s-1, λ = 60°, step width = 2°). Right, quantification of energy indicating right- and leftward motion, respectively. Energy was simply averaged within quadrants color-coded above. Energy distribution is not affected by half-wave rectification (i.e., zeroing either components below or above mean luminance for ON or OFF respectively). d Corresponding illustration and quantification for discretized reverse-phi stimulus. Energy distribution reverses for full-wave stimulus but signals veridical direction when rectification is applied (ON or OFF).CC BY · PubMed Central
Fig 3 Reverse-phi responses in tethered walking flies. a Average turning response for phi condition at three different stimulus velocities and two spatial wavelengths, indicated by panel title and line color. Data are from T4/T5 control flies. Control flies (N = 12) rotate syndirectionally with stimulus. Gray shaded area indicates stimulation period. b Summary statistics for phi condition (average from 1.5 to 3.0 s after trial onset). c Average turning response for reverse-phi condition. Control responses (N = 10) are inverted at low velocities. At high velocities and depending on spatial wavelength, the optomotor response reverses again. The inset depicts the first 500 ms (see black line in main panel) of the response to stimulation with a pattern velocity of 256° s-1 (λ = 90°), highlighting temporally biphasic dynamics. d Summary statistics for reverse-phi condition. Shaded areas around curves and bars around points indicate 95% confidence intervals. See Materials and Methods for details on behavioral experiments.
Fig 3 Reverse-phi responses in tethered walking flies. a Average turning response for phi condition at three different stimulus velocities and two spatial wavelengths, indicated by panel title and line color. Data are from T4/T5 control flies. Control flies (N = 12) rotate syndirectionally with stimulus. Gray shaded area indicates stimulation period. b Summary statistics for phi condition (average from 1.5 to 3.0 s after trial onset). c Average turning response for reverse-phi condition. Control responses (N = 10) are inverted at low velocities. At high velocities and depending on spatial wavelength, the optomotor response reverses again. The inset depicts the first 500 ms (see black line in main panel) of the response to stimulation with a pattern velocity of 256° s-1 (λ = 90°), highlighting temporally biphasic dynamics. d Summary statistics for reverse-phi condition. Shaded areas around curves and bars around points indicate 95% confidence intervals. See Materials and Methods for details on behavioral experiments.CC BY · PubMed Central
Fig 4 Local motion-sensitive cells T4 and T5 are required for reverse-phi responses in walking flies. a Average turning response for phi condition at two different stimulus velocities, indicated by panel title (λ = 90° and step width = 4° throughout figure). Here, control flies (N = 12/12 for shibirets and T4/T5 controls) turn with the direction of the stimulus. This behavior is abolished in T4/T5 block flies (N = 11). Gray shaded area indicates stimulation period. b Summary statistics for phi condition (average from 1.5 to 3.0 s after trial onset). c Walking speed statistics (averaged as before) for phi condition. No genotype exhibits impaired locomotion. d Average turning response for reverse-phi condition. Control responses (N = 11/10 for shibirets and T4/T5 controls) are inverted at low velocities. At high velocities, re-inversion occurs. Turning is fully abolished in T4/T5 block flies (N = 10). e Summary statistics for reverse-phi condition. f Walking speed statistics for reverse-phi condition. Shaded areas around curves and bars around points indicate 95% confidence intervals. Asterisks mark significant differences between T4/T5 block flies and both controls (Student’s t-test, P < 0.001). Note that whiskers show the full sample range. See Materials and Methods for details on behavioral experiments and statistics.
Fig 4 Local motion-sensitive cells T4 and T5 are required for reverse-phi responses in walking flies. a Average turning response for phi condition at two different stimulus velocities, indicated by panel title (λ = 90° and step width = 4° throughout figure). Here, control flies (N = 12/12 for shibirets and T4/T5 controls) turn with the direction of the stimulus. This behavior is abolished in T4/T5 block flies (N = 11). Gray shaded area indicates stimulation period. b Summary statistics for phi condition (average from 1.5 to 3.0 s after trial onset). c Walking speed statistics (averaged as before) for phi condition. No genotype exhibits impaired locomotion. d Average turning response for reverse-phi condition. Control responses (N = 11/10 for shibirets and T4/T5 controls) are inverted at low velocities. At high velocities, re-inversion occurs. Turning is fully abolished in T4/T5 block flies (N = 10). e Summary statistics for reverse-phi condition. f Walking speed statistics for reverse-phi condition. Shaded areas around curves and bars around points indicate 95% confidence intervals. Asterisks mark significant differences between T4/T5 block flies and both controls (Student’s t-test, P < 0.001). Note that whiskers show the full sample range. See Materials and Methods for details on behavioral experiments and statistics.CC BY · PubMed Central
Fig 5 Motion-sensitive tangential cells show selectively inverted responses upon reverse-phi stimulation. a-b Average membrane potential of lobula plate tangential cells (N = 23, pooled across 8 horizontal and 15 vertical system cells, with accordingly oriented direction of movement) in wild-type flies. Responses were recorded at 2 kHz and down-sampled to 50 Hz for presentation. Gray shaded area indicates stimulation period (λ = 45°, v = 128° s-1, step width = 6°). Shading around traces shows bootstrapped 95% confidence intervals. a Phi stimulation. Cells depolarize for motion in preferred direction (PD) and hyperpolarize weakly for motion in the opposite null direction (ND). b Reverse-phi stimulation. The PD response is abolished, whereas the ND response inverts. c Summary statistics (averaged across initial 2 s post-onset). Note that whiskers show the full sample range. See Materials and Methods for details on electrophysiology experiments.
Fig 5 Motion-sensitive tangential cells show selectively inverted responses upon reverse-phi stimulation. a-b Average membrane potential of lobula plate tangential cells (N = 23, pooled across 8 horizontal and 15 vertical system cells, with accordingly oriented direction of movement) in wild-type flies. Responses were recorded at 2 kHz and down-sampled to 50 Hz for presentation. Gray shaded area indicates stimulation period (λ = 45°, v = 128° s-1, step width = 6°). Shading around traces shows bootstrapped 95% confidence intervals. a Phi stimulation. Cells depolarize for motion in preferred direction (PD) and hyperpolarize weakly for motion in the opposite null direction (ND). b Reverse-phi stimulation. The PD response is abolished, whereas the ND response inverts. c Summary statistics (averaged across initial 2 s post-onset). Note that whiskers show the full sample range. See Materials and Methods for details on electrophysiology experiments.CC BY · PubMed Central
Fig 6 Architecture of four- and two-quadrant motion detection models. a Signal flow for a single four-quadrant, non-rectifying elementary motion detector (HP: first-order high-pass filter, LP: first-order low-pass filter, X: multiplication). Quadrants are possible combinations of positive (ON) and negative (OFF) signal contrast. Properties of rectification are displayed as schematic transfer functions (non-rectified in green, ON in red, OFF in blue). If no rectification between ON and OFF occurs, all four possible correlations (ON-ON, ON-OFF, OFF-ON, OFF-OFF) are directly computed. b Signal flow for two-quadrant, rectified elementary motion detector (DC: direct unfiltered input component). Here, signals of equal sign (quadrants ON-ON and OFF-OFF) are correlated.
Fig 6 Architecture of four- and two-quadrant motion detection models. a Signal flow for a single four-quadrant, non-rectifying elementary motion detector (HP: first-order high-pass filter, LP: first-order low-pass filter, X: multiplication). Quadrants are possible combinations of positive (ON) and negative (OFF) signal contrast. Properties of rectification are displayed as schematic transfer functions (non-rectified in green, ON in red, OFF in blue). If no rectification between ON and OFF occurs, all four possible correlations (ON-ON, ON-OFF, OFF-ON, OFF-OFF) are directly computed. b Signal flow for two-quadrant, rectified elementary motion detector (DC: direct unfiltered input component). Here, signals of equal sign (quadrants ON-ON and OFF-OFF) are correlated.CC BY · PubMed Central
Fig 7 A two-quadrant model admitting constant luminance accounts for behavioral and neural responses. a-b Velocity tuning of two model architectures (4Q: non-rectified four-quadrant detector; 2Q: rectified two-quadrant detector with constant luminance contribution, DC). All detectors had identical base parameters (τHP = 250 ms; τLP = 50 ms; DC = 0 or 10% for 4Q or 2Q, respectively; receptor distance = 4°). Simulations were carried out at time steps of 1.0 ms over 10 s of stimulation per velocity. Lines represent time- and space-averaged responses of 60 detectors covering 240° of visual space, normalized to +/-1 maximum/minimum per panel. Black lines: Responses to phi stimulation across 20 velocities on logarithmic scale (λ = 90°, step width = 4°). Gray lines: Responses to corresponding reverse-phi stimulation. Only the rectified two-quadrant model replicates both response reversal and re-inversion at high velocities, as indicated by experimental results. c Velocity tuning for rectified 2Q detector with DC set to zero. Reverse-phi response now indicates veridical direction across full range. d Velocity tuning for 4Q detector with DC level set to 10%. e Velocity tuning for 2Q detector when flicker and motion updates are out of phase. f-i Parameter scans for low- and high-pass time constants of 4Q and 2Q detectors. Arrows indicate default setting. The respective other time constant was kept at its default value. Qualitative tuning features appear to not depend on choice of parameters. See Materials and Methods for further details on simulations.
Fig 7 A two-quadrant model admitting constant luminance accounts for behavioral and neural responses. a-b Velocity tuning of two model architectures (4Q: non-rectified four-quadrant detector; 2Q: rectified two-quadrant detector with constant luminance contribution, DC). All detectors had identical base parameters (τHP = 250 ms; τLP = 50 ms; DC = 0 or 10% for 4Q or 2Q, respectively; receptor distance = 4°). Simulations were carried out at time steps of 1.0 ms over 10 s of stimulation per velocity. Lines represent time- and space-averaged responses of 60 detectors covering 240° of visual space, normalized to +/-1 maximum/minimum per panel. Black lines: Responses to phi stimulation across 20 velocities on logarithmic scale (λ = 90°, step width = 4°). Gray lines: Responses to corresponding reverse-phi stimulation. Only the rectified two-quadrant model replicates both response reversal and re-inversion at high velocities, as indicated by experimental results. c Velocity tuning for rectified 2Q detector with DC set to zero. Reverse-phi response now indicates veridical direction across full range. d Velocity tuning for 4Q detector with DC level set to 10%. e Velocity tuning for 2Q detector when flicker and motion updates are out of phase. f-i Parameter scans for low- and high-pass time constants of 4Q and 2Q detectors. Arrows indicate default setting. The respective other time constant was kept at its default value. Qualitative tuning features appear to not depend on choice of parameters. See Materials and Methods for further details on simulations.CC BY · PubMed Central
Fig 8 Detailed spatiotemporal tuning of 2Q detector. a Phi velocity tuning curves of 2Q detector for different spatial wavelengths. Response optima shift toward higher velocities with increased λ as predicted for Reichardt-type motion detectors. b Velocity tuning for reverse-phi condition. Here, response peaks remain fixed. Spatial wavelength affects magnitude of optimal response and modulates inversion at high pattern speeds, in line with behavioral findings. c Temporally resolved response of a summed array of 2Q detectors in response to phi motion (λ = 90°). Traces were lightly low-pass filtered (τ = 200 ms) to approximate temporal integration during visuomotor transformation. Regardless of velocity, the steady-state response indicates veridical motion. d Resolved 2Q response to reverse-phi stimulation. At low velocities the response is consistently inverted; for fast velocities, a brief inversion is rapidly followed by positive steady-state output (compare behavioral data in Fig 3C). All parameters are set to their default values. Note that we normalize response peaks per panel. See Materials and Methods for further details on simulations.
Fig 8 Detailed spatiotemporal tuning of 2Q detector. a Phi velocity tuning curves of 2Q detector for different spatial wavelengths. Response optima shift toward higher velocities with increased λ as predicted for Reichardt-type motion detectors. b Velocity tuning for reverse-phi condition. Here, response peaks remain fixed. Spatial wavelength affects magnitude of optimal response and modulates inversion at high pattern speeds, in line with behavioral findings. c Temporally resolved response of a summed array of 2Q detectors in response to phi motion (λ = 90°). Traces were lightly low-pass filtered (τ = 200 ms) to approximate temporal integration during visuomotor transformation. Regardless of velocity, the steady-state response indicates veridical motion. d Resolved 2Q response to reverse-phi stimulation. At low velocities the response is consistently inverted; for fast velocities, a brief inversion is rapidly followed by positive steady-state output (compare behavioral data in Fig 3C). All parameters are set to their default values. Note that we normalize response peaks per panel. See Materials and Methods for further details on simulations.CC BY · PubMed Central
Fig 9 Decoupling flicker and motion components. a Turning responses of wild-type flies (N = 11) for phi-type stimuli in which flicker and motion frequencies were varied independently (equivalent stimulus velocities are obtained through multiplication by the spatial step width of 4°; λ = 90°). Response sign and magnitude are a complex function of both parameters. b Response matrix for normalized data from a (with maximum set to 1.0). The first row and the diagonal correspond exactly to previously used phi and reverse-phi stimuli, respectively. Note that values are clipped at 0.5. c Response matrix for a four-quadrant detector using the same stimulus parameters as in the behavioral experiment. Critically, this model does not predict positive responses below the diagonal. d Response matrix for a two-quadrant detector. Crucial features like positive below-diagonal responses are captured faithfully. e Direct comparison of diagonal values equivalent to the standard reverse-phi stimulus. Bars around points indicate 95% confidence intervals. See Materials and Methods for details on behavioral experiments and statistics.
Fig 9 Decoupling flicker and motion components. a Turning responses of wild-type flies (N = 11) for phi-type stimuli in which flicker and motion frequencies were varied independently (equivalent stimulus velocities are obtained through multiplication by the spatial step width of 4°; λ = 90°). Response sign and magnitude are a complex function of both parameters. b Response matrix for normalized data from a (with maximum set to 1.0). The first row and the diagonal correspond exactly to previously used phi and reverse-phi stimuli, respectively. Note that values are clipped at 0.5. c Response matrix for a four-quadrant detector using the same stimulus parameters as in the behavioral experiment. Critically, this model does not predict positive responses below the diagonal. d Response matrix for a two-quadrant detector. Crucial features like positive below-diagonal responses are captured faithfully. e Direct comparison of diagonal values equivalent to the standard reverse-phi stimulus. Bars around points indicate 95% confidence intervals. See Materials and Methods for details on behavioral experiments and statistics.CC BY · PubMed Central
Fig 10 Pathway-specific responses of 2Q model. a Velocity tuning curves for reverse-phi pattern (λ = 90°) before summation of ON- and OFF-specific channels (ON subunit in red, OFF subunit in blue). Only the ON pathway shows inversion and re-inversion; the OFF pathway consistently indicates physical motion direction. b Reverse-phi velocity tuning of the ON subunit as a function of DC contribution. The balance between veridical motion signal and inversion depends on the presence of luminance information at the input; for intermediate levels, positive and negative responses are possible, depending on the particular stimulus velocity. Arrow indicates the default DC parameter of 10%. Values are normalized to a maximum absolute response of one. c Equivalent tuning for the OFF subunit. At the standard level of 10%, only positive responses occur. For negative DC, a similar picture as for the ON subunit emerges. Parameters except for DC level are set to their default values. See Materials and Methods for further details on simulations.
Fig 10 Pathway-specific responses of 2Q model. a Velocity tuning curves for reverse-phi pattern (λ = 90°) before summation of ON- and OFF-specific channels (ON subunit in red, OFF subunit in blue). Only the ON pathway shows inversion and re-inversion; the OFF pathway consistently indicates physical motion direction. b Reverse-phi velocity tuning of the ON subunit as a function of DC contribution. The balance between veridical motion signal and inversion depends on the presence of luminance information at the input; for intermediate levels, positive and negative responses are possible, depending on the particular stimulus velocity. Arrow indicates the default DC parameter of 10%. Values are normalized to a maximum absolute response of one. c Equivalent tuning for the OFF subunit. At the standard level of 10%, only positive responses occur. For negative DC, a similar picture as for the ON subunit emerges. Parameters except for DC level are set to their default values. See Materials and Methods for further details on simulations.CC BY · PubMed Central
Fig 11 Reverse-phi responses of T4 and T5 dendrites as revealed by in vivo calcium imaging. a Representative two-photon image of mean GCaMP6m activity within field of view. Only cells targeting the upward-tuned layer 3 of the lobula plate are labeled by the driver line, allowing for isolation of T4 or T5 dendrites through appropriate placement of regions of interest on either medulla or lobula dendrites, respectively. b Calcium responses in T4 dendrites (N = 9 flies) for phi stimulus at two velocities (λ = 60°, step width = 4°). Units are strongly tuned to motion in the preferred (upward) direction. c Corresponding T4 responses for reverse-phi motion. Depending on velocity, either PD or ND motion evokes stronger response. d Summary of T4 responses, quantified as difference between PD and ND signals (time-averaged between 1 and 4 s after stimulation onset). Calcium activity closely matches behavioral and model results. e-g Corresponding results for T5 dendrites. Phi responses resemble those measured in T4. For reverse-phi, a smaller inversion is found. Shaded areas around curves and bars around points indicate 95% confidence intervals. Asterisks show significant differences from zero for reverse-phi responses (Student’s t-test, P < 0.05); no tests were performed for phi signals. See Materials and Methods for further details on imaging procedures.
Fig 11 Reverse-phi responses of T4 and T5 dendrites as revealed by in vivo calcium imaging. a Representative two-photon image of mean GCaMP6m activity within field of view. Only cells targeting the upward-tuned layer 3 of the lobula plate are labeled by the driver line, allowing for isolation of T4 or T5 dendrites through appropriate placement of regions of interest on either medulla or lobula dendrites, respectively. b Calcium responses in T4 dendrites (N = 9 flies) for phi stimulus at two velocities (λ = 60°, step width = 4°). Units are strongly tuned to motion in the preferred (upward) direction. c Corresponding T4 responses for reverse-phi motion. Depending on velocity, either PD or ND motion evokes stronger response. d Summary of T4 responses, quantified as difference between PD and ND signals (time-averaged between 1 and 4 s after stimulation onset). Calcium activity closely matches behavioral and model results. e-g Corresponding results for T5 dendrites. Phi responses resemble those measured in T4. For reverse-phi, a smaller inversion is found. Shaded areas around curves and bars around points indicate 95% confidence intervals. Asterisks show significant differences from zero for reverse-phi responses (Student’s t-test, P < 0.05); no tests were performed for phi signals. See Materials and Methods for further details on imaging procedures.CC BY · PubMed Central
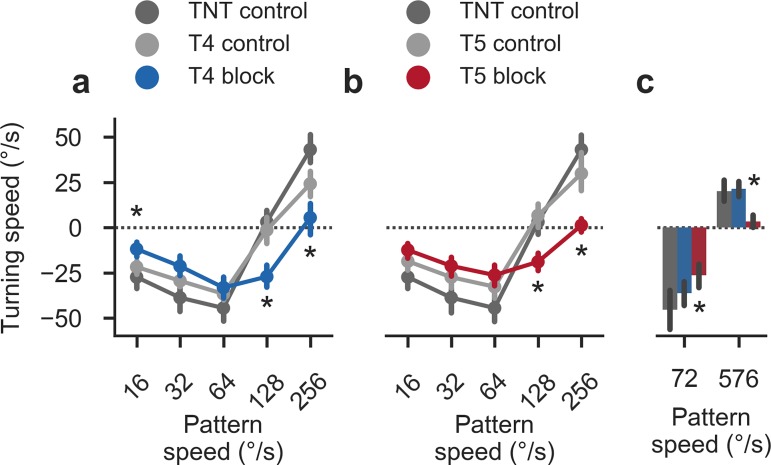
Fig 12 Behavioral responses to reverse-phi stimulation in pathway-specific block flies. a Summary statistics for reverse-phi condition (average from 1.5 to 3.0 s after trial onset; λ = 90°) in T4 block flies (N = 14) and associated controls (N = 12/18 for TNT and T4 controls). b Summary statistics for reverse-phi condition in T5 block flies (N = 15) and associated controls (N = 12/12 for TNT and T5 controls). In both T4 and T5 block flies, turning responses are reduced and re-inversion disappears. Bars around points indicate 95% confidence intervals c Secondary reverse-phi experiment with increased maximum velocity. For T4 block flies (N = 12), high-speed responses are again re-inverted and in line with TNT control flies (N = 11). In T5 block flies (N = 13), high-speed re-inversion remains abolished. Other stimulus parameters match experiments in Fig 4. Lines represent 95% confidence intervals. Asterisks indicate significant differences between T4 or T5 block flies and both appropriate controls (Student’s t-test, P < 0.01). See Materials and Methods for further details on behavioral experiments and statistics.
Fig 12 Behavioral responses to reverse-phi stimulation in pathway-specific block flies. a Summary statistics for reverse-phi condition (average from 1.5 to 3.0 s after trial onset; λ = 90°) in T4 block flies (N = 14) and associated controls (N = 12/18 for TNT and T4 controls). b Summary statistics for reverse-phi condition in T5 block flies (N = 15) and associated controls (N = 12/12 for TNT and T5 controls). In both T4 and T5 block flies, turning responses are reduced and re-inversion disappears. Bars around points indicate 95% confidence intervals c Secondary reverse-phi experiment with increased maximum velocity. For T4 block flies (N = 12), high-speed responses are again re-inverted and in line with TNT control flies (N = 11). In T5 block flies (N = 13), high-speed re-inversion remains abolished. Other stimulus parameters match experiments in Fig 4. Lines represent 95% confidence intervals. Asterisks indicate significant differences between T4 or T5 block flies and both appropriate controls (Student’s t-test, P < 0.01). See Materials and Methods for further details on behavioral experiments and statistics.CC BY · PubMed Central

Verification

Claims the paper makes

The claims and statistics of this paper haven’t been checked yet.

Free: it reads the open-access text and checks the first 5 claims that cite a source we can check. Create a free account to check every claim.

A few free checks a day · papers already verified open instantly · results are public

Claims other papers make about this one

Each is checked against this paper’s own text: does it say what the citing paper says it does?

Self-check

Percentages, sums and reported differences re-computed from the paper’s own numbers.

The self-check needs the paper’s full text.

Citations

Cites

Show all 77 references

Cited by

See all 19

Metadata

Authors
Leonhardt, A., Meier, M., Serbe, E., Eichner, H., & Borst, A.
Affiliations
Max Planck Institute of Neurobiology (DE)
Corresponding author
Leonhardt, Aljoscha
Venue
PLOS ONE
Published
2017-12-20
Volume
12
Issue
12
Pages
e0189019
ISSN
1932-6203 (ISSN-L)
OpenAlex
W2781056526
Cited by
16
References
77
Citations by year
2026: 1 · 2023: 4 · 2022: 1 · 2021: 2 · 2020: 5 · 2019: 1 · 2018: 2
FWCI
1.26
Type
journal article
Language
en
Open access
Locations
  • PLoS ONE (publishedVersion, cc-by)
  • Europe PMC (PubMed Central) (publishedVersion, cc-by)
  • PubMed Central (publishedVersion, cc-by)
  • PubMed (publishedVersion)
  • DOAJ (DOAJ: Directory of Open Access Journals) (submittedVersion, cc-by-sa)
  • Max Planck Digital Library (submittedVersion, other-oa)
  • MPG.PuRe (Max Planck Society) (submittedVersion, other-oa)
Funders
Google
Topics
  • Life Sciences › Neuroscience › Cognitive Neuroscience › Visual perception and processing mechanisms
  • Life Sciences › Neuroscience › Cellular and Molecular Neuroscience › Neurobiology and Insect Physiology Research
  • Social Sciences › Psychology › Experimental and Cognitive Psychology › Multisensory perception and integration
Keywords
motion detection, Drosophila melanogaster, contrast reversal, neural circuits
MeSH terms
Algorithms, Animals, Behavior, Animal, Drosophila melanogaster, Models, Neurological, Motion Perception, Neurons, Optical Illusions

About these checks

Registry, retraction, Cites and statistics results are computed, not judged, with one exception: a printed reference that no index lists is read once by a model before it counts as a citation error. Claims are extracted by a model and kept only when their quote appears verbatim in the text; each cited source is then checked, with a model’s help, for whether it says what the claim relies on. Those verdicts can be wrong — read the claim’s quote and the cited source before relying on one.

Statistics and arithmetic are recomputed, not judged.

Confidence bands are shown only for fields calibrated on our annotated test set. None is calibrated yet, so no band is shown.

What counts as a claim ›How we measure confidence ›How we check this ›

Are you an author, or do you see a problem with this page? Request a review

How to cite

Cite CoChat for the checks on this page, and the paper for its own findings.

This page
CoChat. (2026). Citation check: Neural mechanisms underlying sensitivity to reverse-phi motion in the fly. https://app.cochat.ai/papers/10.1371/journal.pone.0189019
The paper
Leonhardt, A., Meier, M., Serbe, E., Eichner, H., & Borst, A. (2017). Neural mechanisms underlying sensitivity to reverse-phi motion in the fly. PLOS ONE. https://doi.org/10.1371/journal.pone.0189019

Data sources

Bibliographic data: Semantic Scholar, OpenAlex, Crossref.

Contains information from the Semantic Scholar Academic Graph Datasets, made available under the ODC Attribution License (ODC-BY 1.0).

Semantic Scholar’s data is described in: Kinney, R., et al. (2023). The Semantic Scholar Open Data Platform. arXiv:2301.10140.