Cited by 22

The DOI matches its Crossref record; 4 of the 4 references it cites were found in a registry or an index.

The absence of specific yeast heat-shock proteins leads to abnormal aggregation and compromised autophagic clearance of mutant Huntingtin proteins

Higgins, Ryan, Kabbaj, Marie-Helene, Hatcher, Alexa, Wang, Yanchang·2018·PLOS ONE

Overview

The claims and statistics of this paper haven’t been checked yet.

Run the check — free, no account needed. It reads the open-access text and checks the sources it cites.

A few free checks a day · papers already verified open instantly · results are public

Integrity signals

Registry

Crossref · 10.1371/journal.pone.0191490

Cites

4 of 4 references verified0 citation errors · 0 not checkable

Statistics

Figures

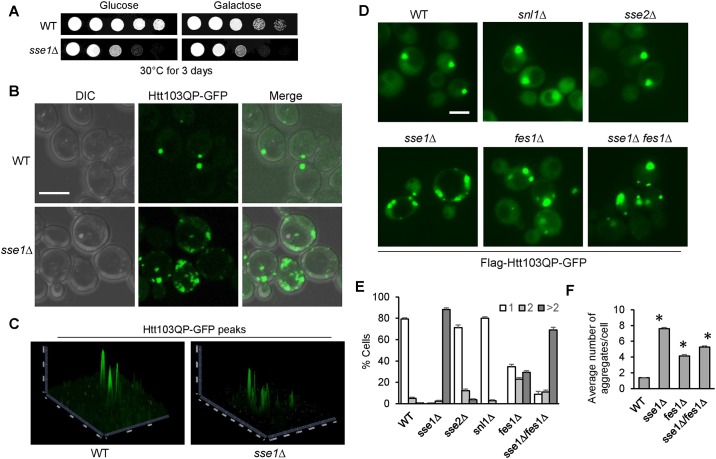
Fig 1 Cytosolic Hsp70 nucleotide exchange factors Sse1 and Fes1 are required for Htt103QP inclusion body (IB) formation. (A) Htt103QP overexpression and the growth of WT and sse1Δ cells. Cells containing PGALFlag-Htt103QP-GFP were grown to saturation, 10-fold diluted, and spotted onto glucose (YPD) or galactose (YEPG) (yeast extract peptone and galactose) plates. The plates were incubated at 30°C for 2 days. (B) Confocal DIC and fluorescent images showing Htt103QP IB formation. WT and sse1Δ cells with PGALFlag-Htt103QP-GFP were incubated at 30°C in YEPG medium for 16 hrs to induce Htt103QP-GFP expression. The cells were fixed by paraformaldehyde for 5 min and then resuspended in PBS buffer for confocal microscopy. Scale bar = 5μm. (C) 2.5-D analysis showing the intensity of fluorescent GFP peaks of the images from (B). Software used was Zen Blue from Zeiss. (D) Htt103QP IB formation in yeast mutants lacking Hsp70 nucleotide exchange factors (NEFs). Cells with the indicated genotypes were grown and treated as described above and then examined using an EVOS fluorescence microscope. Representative fluorescent images are shown for WT, snl1Δ, sse1Δ, sse2Δ, fes1Δ, and sse1Δ fes1Δ cells expressing Htt103QP-GFP. Scale bar = 5μm. (E) Cells from (D) were quantified for the number of aggregates in each cell: 1, 2 or >2 (n = 100 cells). The results are the average of three independent experiments. (F) The average number of aggregates in WT, sse1Δ, fes1Δ, and sse1Δ fes1Δ cells from (D) were quantified (n > 40 cells). The results are the average of three independent experiments. * indicates statistical comparison between WT and mutants. p < .0001 in all instances.
Fig 1 Cytosolic Hsp70 nucleotide exchange factors Sse1 and Fes1 are required for Htt103QP inclusion body (IB) formation. (A) Htt103QP overexpression and the growth of WT and sse1Δ cells. Cells containing PGALFlag-Htt103QP-GFP were grown to saturation, 10-fold diluted, and spotted onto glucose (YPD) or galactose (YEPG) (yeast extract peptone and galactose) plates. The plates were incubated at 30°C for 2 days. (B) Confocal DIC and fluorescent images showing Htt103QP IB formation. WT and sse1Δ cells with PGALFlag-Htt103QP-GFP were incubated at 30°C in YEPG medium for 16 hrs to induce Htt103QP-GFP expression. The cells were fixed by paraformaldehyde for 5 min and then resuspended in PBS buffer for confocal microscopy. Scale bar = 5μm. (C) 2.5-D analysis showing the intensity of fluorescent GFP peaks of the images from (B). Software used was Zen Blue from Zeiss. (D) Htt103QP IB formation in yeast mutants lacking Hsp70 nucleotide exchange factors (NEFs). Cells with the indicated genotypes were grown and treated as described above and then examined using an EVOS fluorescence microscope. Representative fluorescent images are shown for WT, snl1Δ, sse1Δ, sse2Δ, fes1Δ, and sse1Δ fes1Δ cells expressing Htt103QP-GFP. Scale bar = 5μm. (E) Cells from (D) were quantified for the number of aggregates in each cell: 1, 2 or >2 (n = 100 cells). The results are the average of three independent experiments. (F) The average number of aggregates in WT, sse1Δ, fes1Δ, and sse1Δ fes1Δ cells from (D) were quantified (n > 40 cells). The results are the average of three independent experiments. * indicates statistical comparison between WT and mutants. p < .0001 in all instances.CC BY · PubMed Central
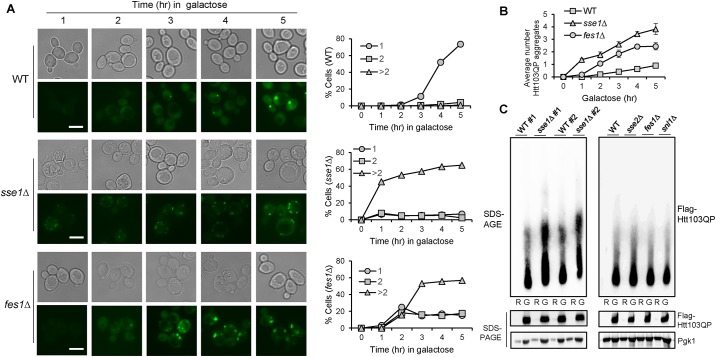
Fig 2 Cells lacking Sse1 and Fes1 exhibit accelerated Htt103QP aggregate formation. (A) WT, sse1Δ, and fes1Δ cells with PGALFlag-Htt103QP-GFP plasmid were grown in non-inducible raffinose medium (YEP + Raffinose) to mid log phase, and then galactose was added to induce the overexpression of Flag-Htt103QP-GFP. Cells were collected every hour for microscopy using the EVOS microscope. Representative DIC and fluorescence images are shown for Htt103QP aggregate formation. Scale bar = 5μm. The number of aggregates in each cell were quantified. The percentage of cells with 1, 2 or >2 aggregates (n = 100 cells) is shown. (B) Quantitation of the average number of aggregates per cell in WT, sse1Δ and fes1Δ cells. Averages are from three independent experiments (n > 50 cells). (C) Detection of Htt103QP protein aggregates using agarose gel electrophoresis. WT and mutant cells were grown in non-inducible raffinose medium (R). After galactose addition, the cells were incubated for 3 hr (G). Protein samples were prepared as described in Materials and Methods and subjected to SDS agarose gel electrophoresis (SDS-AGE) and SDS-PAGE. Two separate WT and sse1Δ strains are shown for reproducibility (left). The results for WT, sse2Δ, fes1Δ, and snl1Δ mutants are shown in the right panel. Pgk1: loading control.
Fig 2 Cells lacking Sse1 and Fes1 exhibit accelerated Htt103QP aggregate formation. (A) WT, sse1Δ, and fes1Δ cells with PGALFlag-Htt103QP-GFP plasmid were grown in non-inducible raffinose medium (YEP + Raffinose) to mid log phase, and then galactose was added to induce the overexpression of Flag-Htt103QP-GFP. Cells were collected every hour for microscopy using the EVOS microscope. Representative DIC and fluorescence images are shown for Htt103QP aggregate formation. Scale bar = 5μm. The number of aggregates in each cell were quantified. The percentage of cells with 1, 2 or >2 aggregates (n = 100 cells) is shown. (B) Quantitation of the average number of aggregates per cell in WT, sse1Δ and fes1Δ cells. Averages are from three independent experiments (n > 50 cells). (C) Detection of Htt103QP protein aggregates using agarose gel electrophoresis. WT and mutant cells were grown in non-inducible raffinose medium (R). After galactose addition, the cells were incubated for 3 hr (G). Protein samples were prepared as described in Materials and Methods and subjected to SDS agarose gel electrophoresis (SDS-AGE) and SDS-PAGE. Two separate WT and sse1Δ strains are shown for reproducibility (left). The results for WT, sse2Δ, fes1Δ, and snl1Δ mutants are shown in the right panel. Pgk1: loading control.CC BY · PubMed Central
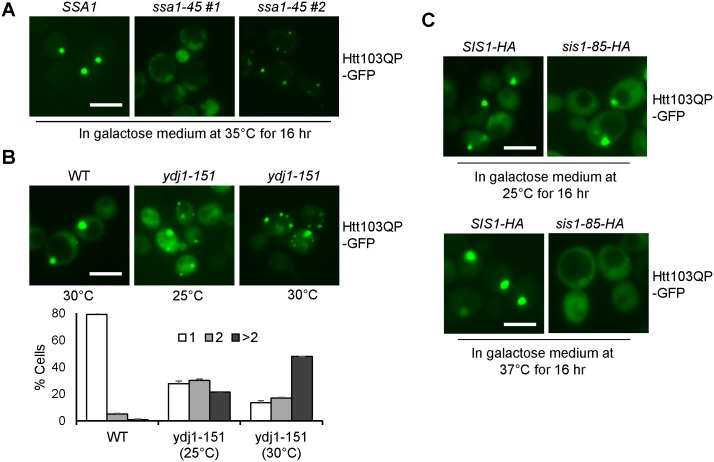
Fig 3 Hsp70 and Hsp40 chaperones participate in Htt103QP IB formation. (A) Htt103QP IB formation in yeast Hsp70 Ssa family mutants. Fluorescent images of SSA1-WT and SSA1-45 cells expressing Flag-Htt103QP-GFP at 35°C for 16 hr. Two separate fluorescent images for ssa1-45 mutants indicate two phenotypes. Scale bar = 5μm. (B) Htt103QP IB formation in Hsp40 co-chaperone mutant ydj1-151. Fluorescent images of WT and ydj1-151 cells expressing Flag-Htt103QP-GFP for 16 hrs at permissive (25°C) and semi-permissive (30°C) temperatures. Cells were quantified for the number of aggregates in each cell: 1, 2 or >2 (n = 100 cells). The results are the average of three independent experiments. Scale bar = 5μm. (C) Htt103QP IB formation in Hsp40 co-chaperone mutant sis1-85. Fluorescent images of SIS1-HA and SIS1-85-HA strains expressing Htt103QP-GFP for 16 hrs at permissive (25°C) and restrictive (37°C) temperatures. Scale bar = 5μm. All microscopy in this figure was performed on the EVOS microscope.
Fig 3 Hsp70 and Hsp40 chaperones participate in Htt103QP IB formation. (A) Htt103QP IB formation in yeast Hsp70 Ssa family mutants. Fluorescent images of SSA1-WT and SSA1-45 cells expressing Flag-Htt103QP-GFP at 35°C for 16 hr. Two separate fluorescent images for ssa1-45 mutants indicate two phenotypes. Scale bar = 5μm. (B) Htt103QP IB formation in Hsp40 co-chaperone mutant ydj1-151. Fluorescent images of WT and ydj1-151 cells expressing Flag-Htt103QP-GFP for 16 hrs at permissive (25°C) and semi-permissive (30°C) temperatures. Cells were quantified for the number of aggregates in each cell: 1, 2 or >2 (n = 100 cells). The results are the average of three independent experiments. Scale bar = 5μm. (C) Htt103QP IB formation in Hsp40 co-chaperone mutant sis1-85. Fluorescent images of SIS1-HA and SIS1-85-HA strains expressing Htt103QP-GFP for 16 hrs at permissive (25°C) and restrictive (37°C) temperatures. Scale bar = 5μm. All microscopy in this figure was performed on the EVOS microscope.CC BY · PubMed Central
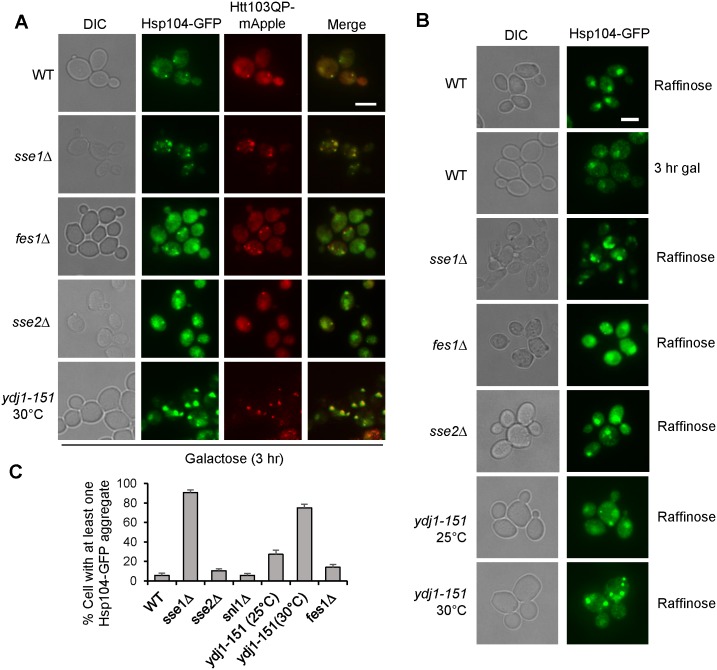
Fig 4 Hsp104-GFP positive aggregates are increased in sse1Δ and ydj1-151 mutants. (A) Hsp104 recruitment to Htt103QP aggregates is independent of chaperones. Cell with indicated genotypes were grown in non-inducible raffinose medium to mid-log phase then galactose was added. Images were taken after incubation for 3 hr. Representative fluorescence images show cellular localization of Hsp104-GFP and Htt103QP-mApple. DIC and merged images are also shown. Scale bar = 5μm. (B) Constitutive appearance of Hsp104-GFP positive aggregates in sse1Δ and ydj1-151 mutants. Cells with indicated genotypes were grown in raffinose or galactose containing medium to mid-log phase. Representative fluorescence images are shown. WT cells show predominantly nuclear localized Hsp104-GFP in the absence of Htt103QP overexpression. Scale bar = 5μm. (C) Cells from (B) were quantified based on the presence of Hsp104-GFP positive aggregate(s). Results are the average of three independent experiments (n = 100 cells). All images in this figure was obtained using the EVOS microscope.
Fig 4 Hsp104-GFP positive aggregates are increased in sse1Δ and ydj1-151 mutants. (A) Hsp104 recruitment to Htt103QP aggregates is independent of chaperones. Cell with indicated genotypes were grown in non-inducible raffinose medium to mid-log phase then galactose was added. Images were taken after incubation for 3 hr. Representative fluorescence images show cellular localization of Hsp104-GFP and Htt103QP-mApple. DIC and merged images are also shown. Scale bar = 5μm. (B) Constitutive appearance of Hsp104-GFP positive aggregates in sse1Δ and ydj1-151 mutants. Cells with indicated genotypes were grown in raffinose or galactose containing medium to mid-log phase. Representative fluorescence images are shown. WT cells show predominantly nuclear localized Hsp104-GFP in the absence of Htt103QP overexpression. Scale bar = 5μm. (C) Cells from (B) were quantified based on the presence of Hsp104-GFP positive aggregate(s). Results are the average of three independent experiments (n = 100 cells). All images in this figure was obtained using the EVOS microscope.CC BY · PubMed Central
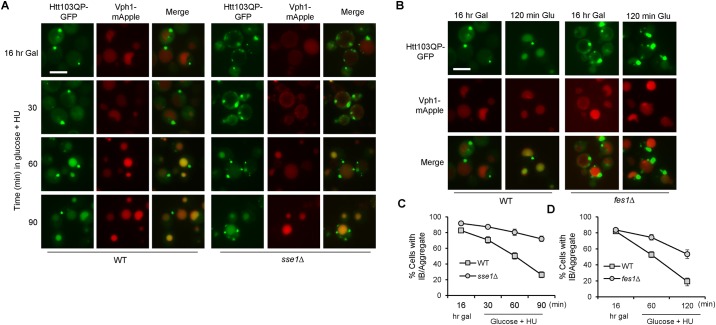
Fig 5 The autophagic degradation of Htt103QP is compromised in sse1Δ and fes1Δ mutants. (A) The autophagic disposal of Htt103QP in WT and sse1Δ mutant cells. pep4Δ VPH1-mApple (WT) and sse1Δ pep4Δ VPH1-mApple (sse1Δ) cells containing Flag-Htt103QP-GFP were grown in galactose medium (YEPG) at 30°C for 16 hr. Glucose was then added to shut off Htt103QP expression, and 100 mM hydroxyurea (HU) was added to block cell cycle progression. Representative fluorescent images are shown for the localization of Htt103QP-GFP and Vph1-mApple before and after addition of glucose and HU. Vph1-mApple was used to mark vacuole structure. Pep4 is a vacuolar protease, and pep4Δ mutant was used to slow degradation inside the vacuole to enhance visualization. (B) Htt103QP autophagic disposal in WT and fes1Δ mutant cells. A similar protocol was used to examine the vacuolar localization of Htt103QP-GFP. (C and D) Quantitation of cells with Htt103QP IB or aggregates localized outside the vacuole over time. The cells from (A) and (B) are used for the quantitation. The quantified results (three independent repeats) were obtained by counting the number of cells containing at least one IB or aggregate (n = 100). All microscopy in this figure was performed on the EVOS microscope.
Fig 5 The autophagic degradation of Htt103QP is compromised in sse1Δ and fes1Δ mutants. (A) The autophagic disposal of Htt103QP in WT and sse1Δ mutant cells. pep4Δ VPH1-mApple (WT) and sse1Δ pep4Δ VPH1-mApple (sse1Δ) cells containing Flag-Htt103QP-GFP were grown in galactose medium (YEPG) at 30°C for 16 hr. Glucose was then added to shut off Htt103QP expression, and 100 mM hydroxyurea (HU) was added to block cell cycle progression. Representative fluorescent images are shown for the localization of Htt103QP-GFP and Vph1-mApple before and after addition of glucose and HU. Vph1-mApple was used to mark vacuole structure. Pep4 is a vacuolar protease, and pep4Δ mutant was used to slow degradation inside the vacuole to enhance visualization. (B) Htt103QP autophagic disposal in WT and fes1Δ mutant cells. A similar protocol was used to examine the vacuolar localization of Htt103QP-GFP. (C and D) Quantitation of cells with Htt103QP IB or aggregates localized outside the vacuole over time. The cells from (A) and (B) are used for the quantitation. The quantified results (three independent repeats) were obtained by counting the number of cells containing at least one IB or aggregate (n = 100). All microscopy in this figure was performed on the EVOS microscope.CC BY · PubMed Central
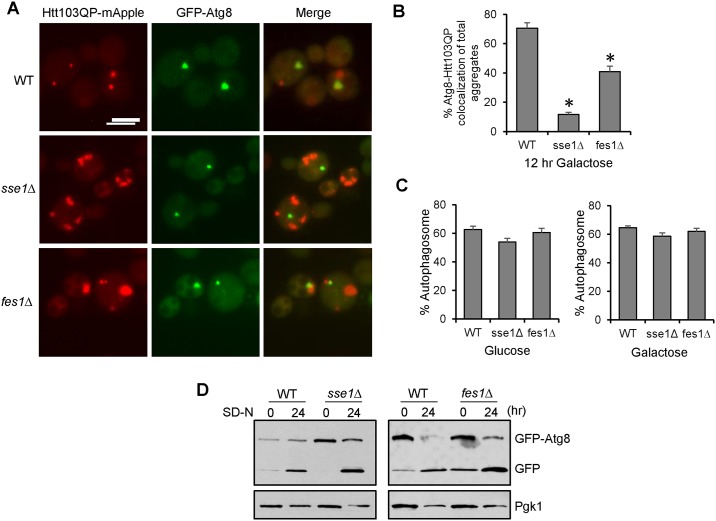
Fig 6 Sse1 and Fes1 are required for efficient recognition of Htt103QP by autophagy machinery. (A) The co-localization of Htt103QP and Atg8 in WT, sse1Δ, and fes1Δ cells. Cells containing GFP-ATG8 and PGALFlag-Htt103QP-mApple were grown in galactose medium YEPG for 16 hrs and fixed for microscopy. Representative fluorescence images show the localization of Htt103QP-mApple and GFP-Atg8. Scale bar = 5μm. (B) Quantitation of total number of Htt103QP aggregates colocalized with GFP-Atg8 in WT, sse1Δ, and fes1Δ cells (n = 100 IB/aggregates). Quantities indicate the average of three independent experiments. * indicates statistical comparison. p < .001. (C) Quantitation of the number of GFP-Atg8 autophagosomes present in WT, sse1Δ and fes1Δ cells incubated in glucose or galactose medium (n = 100 cells). Quantities indicate the average of three independent experiments. (D) Sse1 and Fes1 are not required for starvation-induced autophagy. WT, sse1Δ, and fes1Δ cells with GFP-ATG8 were grown in SC -TRP medium, and then shifted to nitrogen-deficient medium (SD-N) for 24 hr. The cells were collected to detect the presence of GFP-Atg8 and the cleavage product, monomeric GFP, using anti-GFP antibody. Pgk1: loading control. The EVOS microscope was used to obtain the images in this figure.
Fig 6 Sse1 and Fes1 are required for efficient recognition of Htt103QP by autophagy machinery. (A) The co-localization of Htt103QP and Atg8 in WT, sse1Δ, and fes1Δ cells. Cells containing GFP-ATG8 and PGALFlag-Htt103QP-mApple were grown in galactose medium YEPG for 16 hrs and fixed for microscopy. Representative fluorescence images show the localization of Htt103QP-mApple and GFP-Atg8. Scale bar = 5μm. (B) Quantitation of total number of Htt103QP aggregates colocalized with GFP-Atg8 in WT, sse1Δ, and fes1Δ cells (n = 100 IB/aggregates). Quantities indicate the average of three independent experiments. * indicates statistical comparison. p < .001. (C) Quantitation of the number of GFP-Atg8 autophagosomes present in WT, sse1Δ and fes1Δ cells incubated in glucose or galactose medium (n = 100 cells). Quantities indicate the average of three independent experiments. (D) Sse1 and Fes1 are not required for starvation-induced autophagy. WT, sse1Δ, and fes1Δ cells with GFP-ATG8 were grown in SC -TRP medium, and then shifted to nitrogen-deficient medium (SD-N) for 24 hr. The cells were collected to detect the presence of GFP-Atg8 and the cleavage product, monomeric GFP, using anti-GFP antibody. Pgk1: loading control. The EVOS microscope was used to obtain the images in this figure.CC BY · PubMed Central
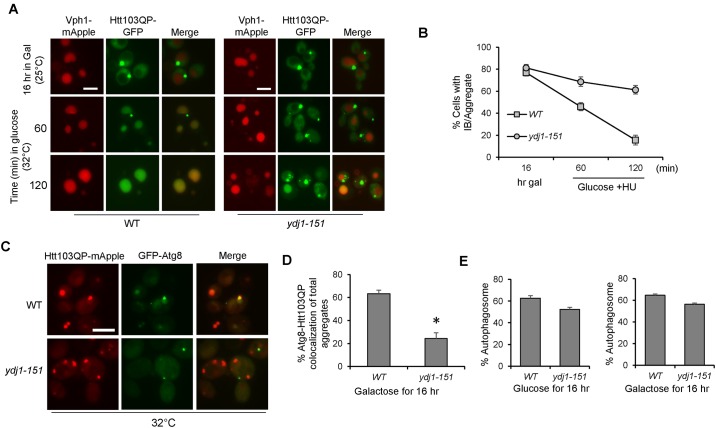
Fig 7 Hsp40 co-chaperone Ydj1 is required for efficient autophagic degradation of Htt103QP. (A) Htt103QP autophagy in WT and ydj1-151 mutant cells. pep4Δ VPH1-mApple (WT) and ydj1-151 pep4Δ VPH1-mApple (ydj1-151) cells containing PGALFlag-Htt103QP-GFP were grown in galactose medium (YEPG) at 25°C for 16 hrs. Cells were then shifted to semi-permissive temperatures (32°C) for 10 min prior to glucose and hydroxyurea (HU) addition. Representative fluorescent images are shown for the localization of Htt103QP-GFP and Vph1-mApple (vacuolar marker) before and after addition of glucose and HU. Scale bar = 5μm. (B) Quantitation of cells with Htt103QP IB or aggregates localized outside the vacuole over time. Results from three independent experiments were used for the quantitation. The quantified results were obtained by counting the number of cells containing at least one IB or aggregate (n = 100). (C) The co-localization of Htt103QP and Atg8 in WT and ydj1-151 cells. Cells containing GFP-ATG8 and PGALFlag-Htt103QP-mApple were grown in galactose medium YEPG for 16 hrs at 32°C and fixed for microscopy. Representative fluorescence images show the localization of Htt103QP-mApple and GFP-Atg8. (D) Quantitation of total number of Htt103QP aggregates colocalized with GFP-Atg8 in WT and ydj1-151 cells (n = 100 IB/aggregates). Quantities indicate the average of three independent experiments. * indicates statistical comparison. p < .005. (E) Quantitation of the number of GFP-Atg8 autophagosomes present in WT and ydj1-151 cells incubated in glucose or galactose medium (n = 100 cells). Quantities indicate the average of three independent experiments. All images in this figure were acquired using the EVOS microscope.
Fig 7 Hsp40 co-chaperone Ydj1 is required for efficient autophagic degradation of Htt103QP. (A) Htt103QP autophagy in WT and ydj1-151 mutant cells. pep4Δ VPH1-mApple (WT) and ydj1-151 pep4Δ VPH1-mApple (ydj1-151) cells containing PGALFlag-Htt103QP-GFP were grown in galactose medium (YEPG) at 25°C for 16 hrs. Cells were then shifted to semi-permissive temperatures (32°C) for 10 min prior to glucose and hydroxyurea (HU) addition. Representative fluorescent images are shown for the localization of Htt103QP-GFP and Vph1-mApple (vacuolar marker) before and after addition of glucose and HU. Scale bar = 5μm. (B) Quantitation of cells with Htt103QP IB or aggregates localized outside the vacuole over time. Results from three independent experiments were used for the quantitation. The quantified results were obtained by counting the number of cells containing at least one IB or aggregate (n = 100). (C) The co-localization of Htt103QP and Atg8 in WT and ydj1-151 cells. Cells containing GFP-ATG8 and PGALFlag-Htt103QP-mApple were grown in galactose medium YEPG for 16 hrs at 32°C and fixed for microscopy. Representative fluorescence images show the localization of Htt103QP-mApple and GFP-Atg8. (D) Quantitation of total number of Htt103QP aggregates colocalized with GFP-Atg8 in WT and ydj1-151 cells (n = 100 IB/aggregates). Quantities indicate the average of three independent experiments. * indicates statistical comparison. p < .005. (E) Quantitation of the number of GFP-Atg8 autophagosomes present in WT and ydj1-151 cells incubated in glucose or galactose medium (n = 100 cells). Quantities indicate the average of three independent experiments. All images in this figure were acquired using the EVOS microscope.CC BY · PubMed Central

Verification

Claims the paper makes

The claims and statistics of this paper haven’t been checked yet.

Run the check — free, no account needed. It reads the open-access text and checks the sources it cites.

A few free checks a day · papers already verified open instantly · results are public

Claims other papers make about this one

Each is checked against this paper’s own text: does it say what the citing paper says it does?

Self-check

Percentages, sums and reported differences re-computed from the paper’s own numbers.

The self-check needs the paper’s full text.

Citations

Cites

Show all 4 references

Research works printed but not linked: 69

  1. GA de Oliveira, 2015, Misfolding, Aggregation, and Disordered Segments in c-Abl and p53 in Human Cancer, Front Oncol, 5, 97, 10.3389/fonc.2015.00097 · DOI
  2. A Mukherjee, 2015, Type 2 diabetes as a protein misfolding disease, Trends Mol Med, 21, 439, 10.1016/j.molmed.2015.04.005 · DOI
  3. FU Hartl, 2011, Molecular chaperones in protein folding and proteostasis, Nature, 475, 324, 10.1038/nature10317 · DOI · Paper page
  4. MP Mayer, 2013, Hsp70 chaperone dynamics and molecular mechanism, Trends Biochem Sci, 38, 507, 10.1016/j.tibs.2013.08.001 · DOI
  5. R Kityk, 2012, Structure and dynamics of the ATP-bound open conformation of Hsp70 chaperones, Mol Cell, 48, 863, 10.1016/j.molcel.2012.09.023 · DOI
  6. S Ghaemmaghami, 2003, Global analysis of protein expression in yeast, Nature, 425, 737, 10.1038/nature02046 · DOI · Paper page
  7. JL Abrams, 2014, Hierarchical functional specificity of cytosolic heat shock protein 70 (Hsp70) nucleotide exchange factors in yeast, J Biol Chem, 289, 13155, 10.1074/jbc.M113.530014 · DOI
  8. B Misselwitz, 1998, J proteins catalytically activate Hsp70 molecules to trap a wide range of peptide sequences, Mol Cell, 2, 593, 10.1016/S1097-2765(00)80158-6 · DOI
  9. DM Cyr, 2015, Specification of Hsp70 function by Type I and Type II Hsp40, Subcell Biochem, 78, 91, 10.1007/978-3-319-11731-7_4 · DOI
  10. NB Nillegoda, 2015, Metazoan Hsp70-based protein disaggregases: emergence and mechanisms, Front Mol Biosci, 2, 57, 10.3389/fmolb.2015.00057 · DOI
  11. JM Kaimal, 2017, Coordinated Hsp110 and Hsp104 activities power protein disaggregation in Saccharomyces cerevisiae, Mol Cell Biol
  12. MP Torrente, 2013, The metazoan protein disaggregase and amyloid depolymerase system: Hsp110, Hsp70, Hsp40, and small heat shock proteins, Prion, 7, 457, 10.4161/pri.27531 · DOI
  13. H Rampelt, 2012, Metazoan Hsp70 machines use Hsp110 to power protein disaggregation, EMBO J, 31, 4221, 10.1038/emboj.2012.264 · DOI
  14. SH Park, 2013, PolyQ proteins interfere with nuclear degradation of cytosolic proteins by sequestering the Sis1p chaperone, Cell, 154, 134, 10.1016/j.cell.2013.06.003 · DOI
  15. H Olzscha, 2011, Amyloid-like aggregates sequester numerous metastable proteins with essential cellular functions, Cell, 144, 67, 10.1016/j.cell.2010.11.050 · DOI
  16. JN Keller, 2000, Impaired proteasome function in Alzheimer’s disease, J Neurochem, 75, 436, 10.1046/j.1471-4159.2000.0750436.x · DOI · Paper page
  17. JS Hwang, 2007, Age-associated decrease in proteasome content and activities in human dermal fibroblasts: restoration of normal level of proteasome subunits reduces aging markers in fibroblasts from elderly persons, J Gerontol A Biol Sci Med Sci, 62, 490, 10.1093/gerona/62.5.490 · DOI
  18. S Tydlacka, 2008, Differential activities of the ubiquitin-proteasome system in neurons versus glia may account for the preferential accumulation of misfolded proteins in neurons, J Neurosci, 28, 13285, 10.1523/JNEUROSCI.4393-08.2008 · DOI
  19. P Low, 2011, The role of ubiquitin-proteasome system in ageing, Gen Comp Endocrinol, 172, 39, 10.1016/j.ygcen.2011.02.005 · DOI
  20. A Ciechanover, 2017, Protein Quality Control by Molecular Chaperones in Neurodegeneration, Front Neurosci, 11, 185, 10.3389/fnins.2017.00185 · DOI
  21. ML Duennwald, 2006, Flanking sequences profoundly alter polyglutamine toxicity in yeast, Proc Natl Acad Sci U S A, 103, 11045, 10.1073/pnas.0604547103 · DOI
  22. S Krobitsch, 2000, Aggregation of huntingtin in yeast varies with the length of the polyglutamine expansion and the expression of chaperone proteins, Proc Natl Acad Sci U S A, 97, 1589, 10.1073/pnas.97.4.1589 · DOI
  23. Y Wang, 2009, Abnormal proteins can form aggresome in yeast: aggresome-targeting signals and components of the machinery, FASEB J, 23, 451, 10.1096/fj.08-117614 · DOI
  24. KH Chuang, 2016, Ubiquilin/Dsk2 promotes inclusion body formation and vacuole (lysosome)-mediated disposal of mutated huntingtin, Mol Biol Cell, 27, 2025, 10.1091/mbc.E16-01-0026 · DOI
  25. J Yang, 2016, Spatial sequestration and detoxification of Huntingtin by the ribosome quality control complex, Elife, 5, 10.7554/eLife.11792 · DOI
  26. B Gong, 2012, Temporal separation of aggregation and ubiquitination during early inclusion formation in transgenic mice carrying the Huntington’s disease mutation, PLoS One, 7, e41450, 10.1371/journal.pone.0041450 · DOI
  27. L Shaner, 2005, The yeast Hsp110 Sse1 functionally interacts with the Hsp70 chaperones Ssa and Ssb, J Biol Chem, 280, 41262, 10.1074/jbc.M503614200 · DOI
  28. Z Dragovic, 2006, Molecular chaperones of the Hsp110 family act as nucleotide exchange factors of Hsp70s, EMBO J, 25, 2519, 10.1038/sj.emboj.7601138 · DOI
  29. K Shen, 2016, Control of the structural landscape and neuronal proteotoxicity of mutant Huntingtin by domains flanking the polyQ tract, Elife, 5, 10.7554/eLife.18065 · DOI
  30. KA Morano, 2007, New tricks for an old dog: the evolving world of Hsp70, Ann N Y Acad Sci, 1113, 1, 10.1196/annals.1391.018 · DOI
  31. A Bracher, 2015, The nucleotide exchange factors of Hsp70 molecular chaperones, Front Mol Biosci, 2, 10, 10.3389/fmolb.2015.00010 · DOI
  32. Y Gong, 2009, An atlas of chaperone-protein interactions in Saccharomyces cerevisiae: implications to protein folding pathways in the cell, Mol Syst Biol, 5, 275, 10.1038/msb.2009.26 · DOI
  33. PG Needham, 2015, Mutations in the Yeast Hsp70, Ssa1, at P417 Alter ATP Cycling, Interdomain Coupling, and Specific Chaperone Functions, J Mol Biol, 427, 2948, 10.1016/j.jmb.2015.04.010 · DOI
  34. M Kabani, 2002, Nucleotide exchange factor for the yeast Hsp70 molecular chaperone Ssa1p, Mol Cell Biol, 22, 4677, 10.1128/MCB.22.13.4677-4689.2002 · DOI
  35. N Sondheimer, 2001, The role of Sis1 in the maintenance of the [RNQ+] prion, EMBO J, 20, 2435, 10.1093/emboj/20.10.2435 · DOI
  36. AB Meriin, 2002, Huntington toxicity in yeast model depends on polyglutamine aggregation mediated by a prion-like protein Rnq1, J Cell Biol, 157, 997, 10.1083/jcb.200112104 · DOI
  37. JR Glover, 1998, Hsp104, Hsp70, and Hsp40: a novel chaperone system that rescues previously aggregated proteins, Cell, 94, 73, 10.1016/S0092-8674(00)81223-4 · DOI
  38. DA Parsell, 1994, Protein disaggregation mediated by heat-shock protein Hsp104, Nature, 372, 475, 10.1038/372475a0 · DOI
  39. J O′Driscoll, 2015, Prion aggregate structure in yeast cells is determined by the Hsp104-Hsp110 disaggregase machinery, J Cell Biol, 211, 145, 10.1083/jcb.201505104 · DOI
  40. JM Tkach, 2008, Nucleocytoplasmic trafficking of the molecular chaperone Hsp104 in unstressed and heat-shocked cells, Traffic, 9, 39, 10.1111/j.1600-0854.2007.00666.x · DOI
  41. C Kempf, 2017, Differential stress response of Saccharomyces hybrids revealed by monitoring Hsp104 aggregation and disaggregation, Microbiol Res, 200, 53, 10.1016/j.micres.2017.03.009 · DOI
  42. XJ Li, 2010, Clearance of mutant huntingtin, Autophagy, 6, 663, 10.4161/auto.6.5.12336 · DOI
  43. A Shiber, 2013, Ubiquitin conjugation triggers misfolded protein sequestration into quality control foci when Hsp70 chaperone levels are limiting, Mol Biol Cell, 24, 2076, 10.1091/mbc.E13-01-0010 · DOI
  44. PS Gallagher, 2014, The requirement for Cdc48/p97 in nuclear protein quality control degradation depends on the substrate and correlates with substrate insolubility, J Cell Sci, 127, 1980, 10.1242/jcs.141838 · DOI
  45. A Varshavsky, 2012, The ubiquitin system, an immense realm, Annual review of biochemistry, 81, 167, 10.1146/annurev-biochem-051910-094049 · DOI
  46. AJ McClellan, 2005, Folding and quality control of the VHL tumor suppressor proceed through distinct chaperone pathways, Cell, 121, 739, 10.1016/j.cell.2005.03.024 · DOI
  47. JW Heck, 2010, Cytoplasmic protein quality control degradation mediated by parallel actions of the E3 ubiquitin ligases Ubr1 and San1, Proc Natl Acad Sci U S A, 107, 1106, 10.1073/pnas.0910591107 · DOI
  48. R Prasad, 2010, A nucleus-based quality control mechanism for cytosolic proteins, Mol Biol Cell, 21, 2117, 10.1091/mbc.E10-02-0111 · DOI
  49. NK Gowda, 2013, Hsp70 nucleotide exchange factor Fes1 is essential for ubiquitin-dependent degradation of misfolded cytosolic proteins, Proc Natl Acad Sci U S A, 110, 5975, 10.1073/pnas.1216778110 · DOI
  50. NK Gowda, 2016, Cytosolic splice isoform of Hsp70 nucleotide exchange factor Fes1 is required for the degradation of misfolded proteins in yeast, Mol Biol Cell, 27, 1210, 10.1091/mbc.E15-10-0697 · DOI
  51. M Brehme, 2014, A chaperome subnetwork safeguards proteostasis in aging and neurodegenerative disease, Cell Rep, 9, 1135, 10.1016/j.celrep.2014.09.042 · DOI · Paper page
  52. KJ Wolfe, 2013, The Hsp70/90 cochaperone, Sti1, suppresses proteotoxicity by regulating spatial quality control of amyloid-like proteins, Mol Biol Cell, 24, 3588, 10.1091/mbc.E13-06-0315 · DOI
  53. K Bersuker, 2013, Heat shock response activation exacerbates inclusion body formation in a cellular model of Huntington disease, J Biol Chem, 288, 23633, 10.1074/jbc.C113.481945 · DOI
  54. SH Shahmoradian, 2013, TRiC’s tricks inhibit huntingtin aggregation, Elife, 2, e00710, 10.7554/eLife.00710 · DOI
  55. L Qi, 2012, The role of chaperone-mediated autophagy in huntingtin degradation, PLoS One, 7, e46834, 10.1371/journal.pone.0046834 · DOI
  56. G Zaffagnini, 2016, Mechanisms of Selective Autophagy, J Mol Biol, 428, 1714, 10.1016/j.jmb.2016.02.004 · DOI
  57. U Nair, 2011, GFP-Atg8 protease protection as a tool to monitor autophagosome biogenesis, Autophagy, 7, 1546, 10.4161/auto.7.12.18424 · DOI
  58. PM Douglas, 2010, Protein homeostasis and aging in neurodegeneration, J Cell Biol, 190, 719, 10.1083/jcb.201005144 · DOI
  59. KP Bhat, 2014, Differential ubiquitination and degradation of huntingtin fragments modulated by ubiquitin-protein ligase E3A, Proc Natl Acad Sci U S A, 111, 5706, 10.1073/pnas.1402215111 · DOI
  60. K Lu, 2014, Autophagic clearance of polyQ proteins mediated by ubiquitin-Atg8 adaptors of the conserved CUET protein family, Cell, 158, 549, 10.1016/j.cell.2014.05.048 · DOI · Paper page
  61. FJB Bauerlein, 2017, In Situ Architecture and Cellular Interactions of PolyQ Inclusions, Cell, 171, 179, 10.1016/j.cell.2017.08.009 · DOI
  62. Z Xu, 2013, 14-3-3 protein targets misfolded chaperone-associated proteins to aggresomes, J Cell Sci, 126, 4173, 10.1242/jcs.126102 · DOI
  63. J Leitman, 2013, Soluble forms of polyQ-expanded huntingtin rather than large aggregates cause endoplasmic reticulum stress, Nat Commun, 4, 2753, 10.1038/ncomms3753 · DOI
  64. ML Duennwald, 2011, Polyglutamine misfolding in yeast: toxic and protective aggregation, Prion, 5, 285, 10.4161/pri.18071 · DOI
  65. M Nagy, 2016, Extended survival of misfolded G85R SOD1-linked ALS mice by transgenic expression of chaperone Hsp110, Proc Natl Acad Sci U S A, 113, 5424, 10.1073/pnas.1604885113 · DOI
  66. B Eroglu, 2010, Loss of Hsp110 leads to age-dependent tau hyperphosphorylation and early accumulation of insoluble amyloid beta, Mol Cell Biol, 30, 4626, 10.1128/MCB.01493-09 · DOI
  67. MS Longtine, 1998, Additional modules for versatile and economical PCR-based gene deletion and modification in Saccharomyces cerevisiae, Yeast, 14, 953, 10.1002/(SICI)1097-0061(199807)14:10<953::AID-YEA293>3.0.CO;2-U · DOI
  68. H Abeliovich, 2003, Chemical genetic analysis of Apg1 reveals a non-kinase role in the induction of autophagy, Mol Biol Cell, 14, 477, 10.1091/mbc.E02-07-0413 · DOI
  69. KL Lim, 2005, Parkin mediates nonclassical, proteasomal-independent ubiquitination of synphilin-1: implications for Lewy body formation, J Neurosci, 25, 2002, 10.1523/JNEUROSCI.4474-04.2005 · DOI · Paper page

Cited by

Sorted by citations

Metadata

Authors
Higgins, R., Kabbaj, M.-H., Hatcher, A., & Wang, Y.
Venue
PLOS ONE
Published
2018-01-18
Volume
13
Issue
1
Pages
e0191490
ISSN
1932-6203
Cited by
22
References
4
Language
en
Funders
  • National Institution of Health (RO1GM102115)
  • Florida State University (CRC planning Grant)

About these checks

Registry, retraction, Cites and statistics results are computed, not judged, with one exception: a printed reference that no index lists is read once by a model before it counts as a citation error. Claims are extracted by a model and kept only when their quote appears verbatim in the text; each cited source is then checked, with a model’s help, for whether it says what the claim relies on. Those verdicts can be wrong — read the claim’s quote and the cited source before relying on one.

Statistics and arithmetic are recomputed, not judged.

Confidence bands are shown only for fields calibrated on our annotated test set. None is calibrated yet, so no band is shown.

What counts as a claim ›How we measure confidence ›How we check this ›

Are you an author, or do you see a problem with this page? Request a review