

The DOI matches its Crossref record; 47 of the 47 references it cites were found in a registry or an index.
In vitro immunotherapy potency assays using real-time cell analysis
Open accessAbstract
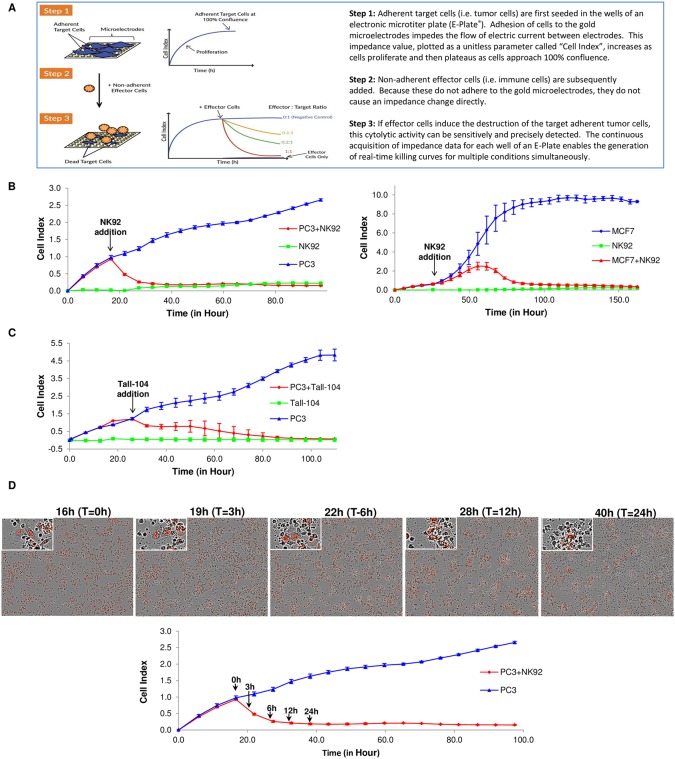
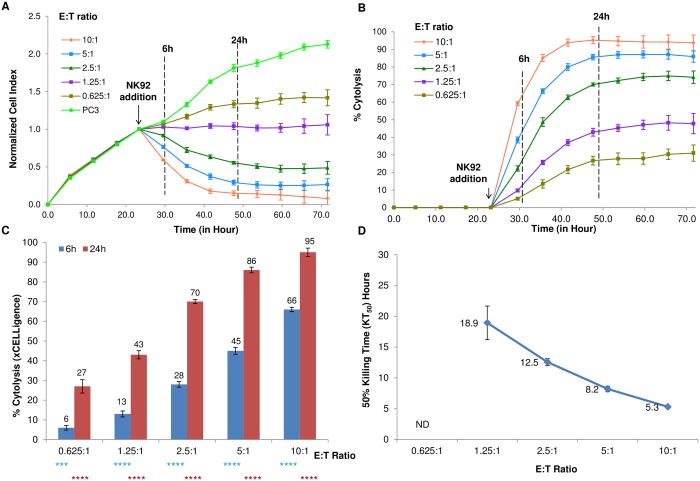
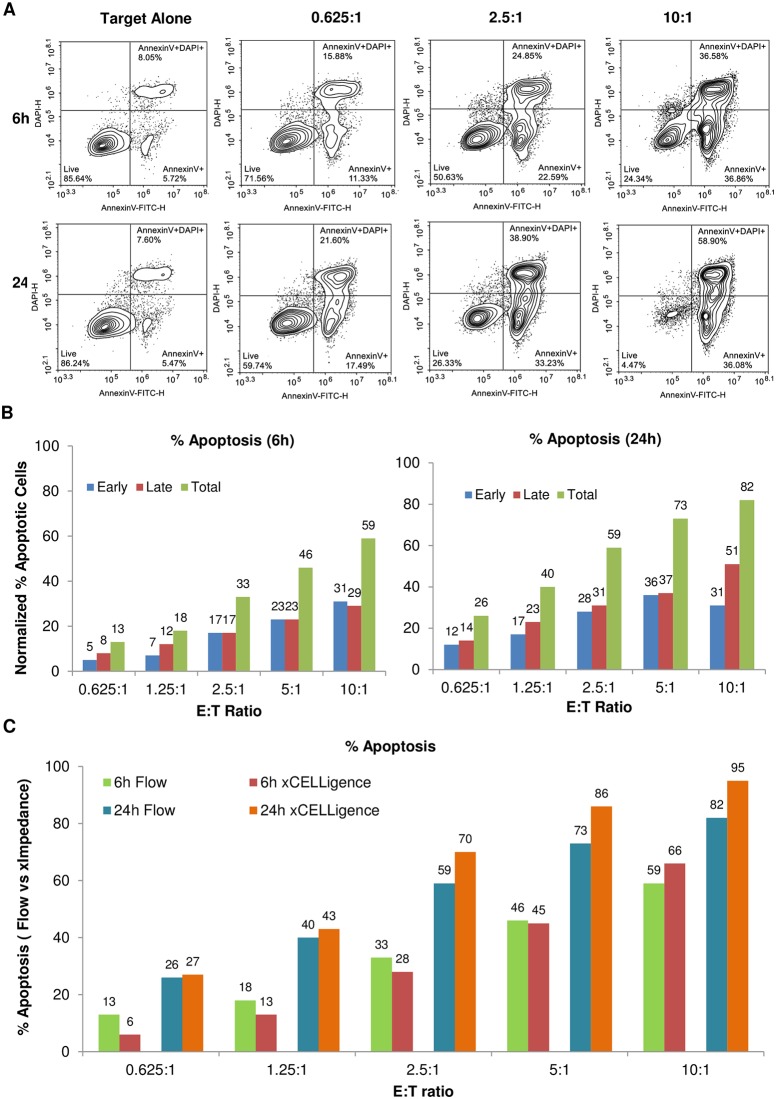
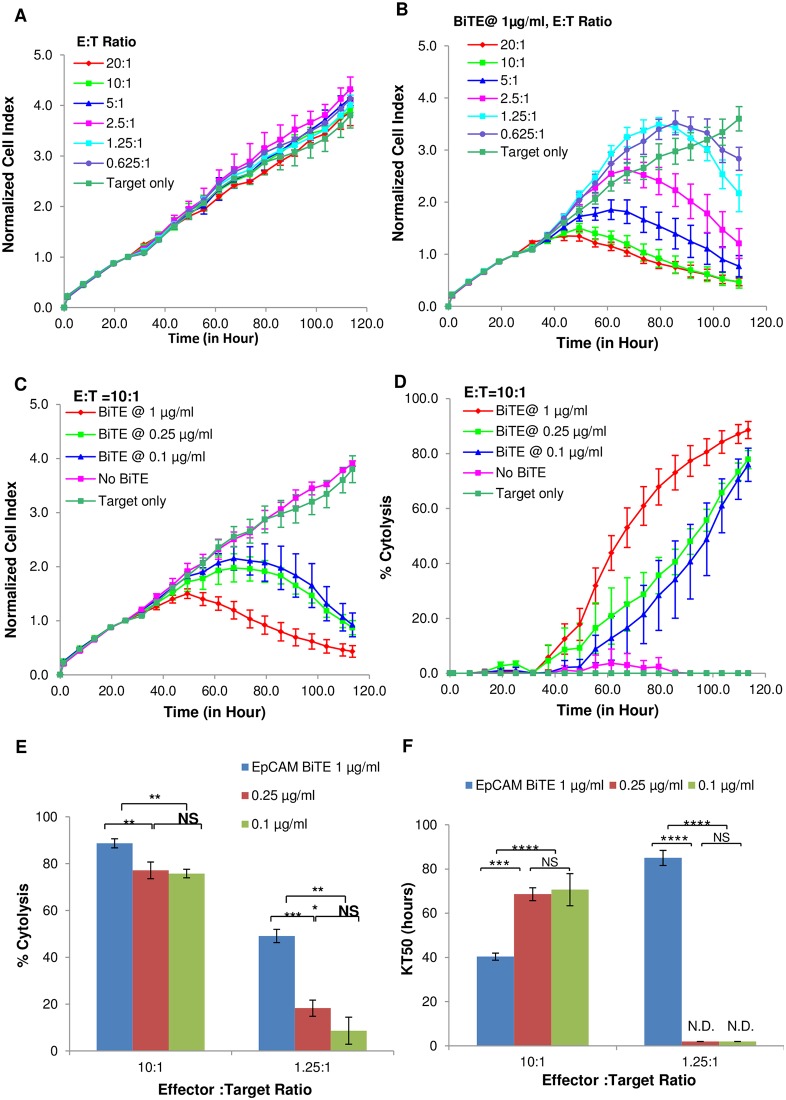
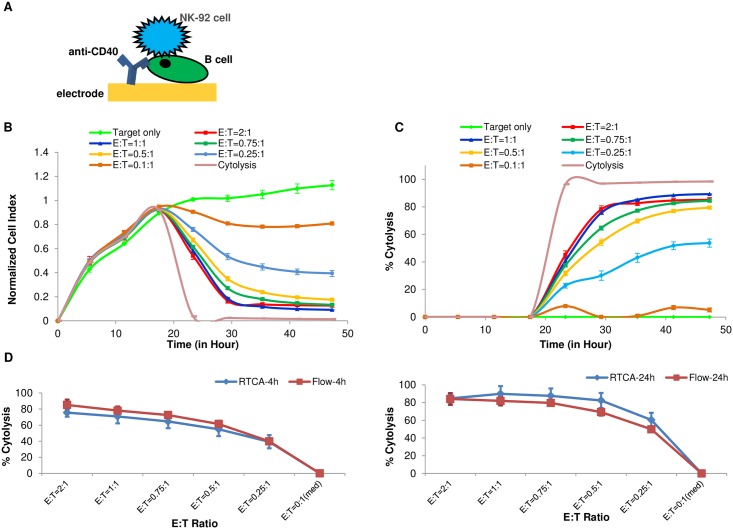
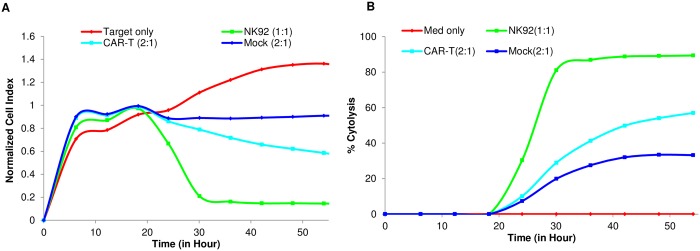
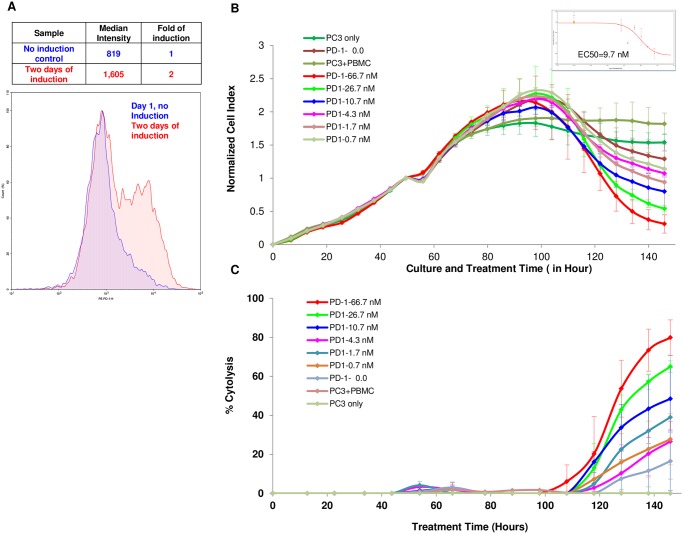
A growing understanding of the molecular interactions between immune effector cells and target tumor cells, coupled with refined gene therapy approaches, are giving rise to novel cancer immunotherapeutics with remarkable efficacy in the clinic against both solid and liquid tumors. While immunotherapy holds tremendous promise for treatment of certain cancers, significant challenges remain in the clinical translation to many other types of cancers and also in minimizing adverse effects. Therefore, there is an urgent need for functional potency assays, in vitro and in vivo, that could model the complex interaction of immune cells with tumor cells and can be used to rapidly test the efficacy of different immunotherapy approaches, whether it is small molecule, biologics, cell therapies or combinations thereof. Herein we report the development of an xCELLigence real-time cytolytic in vitro potency assay that uses cellular impedance to continuously monitor the viability of target tumor cells while they are being subjected to different types of treatments. Specialized microtiter plates containing integrated gold microelectrodes enable the number, size, and surface attachment strength of adherent target tumor cells to be selectively monitored within a heterogeneous mixture that includes effector cells, antibodies, small molecules, etc. Through surface-tethering approach, the killing of liquid cancers can also be monitored. Using NK92 effector cells as example, results from RTCA potency assay are very well correlated with end point data from image-based assays as well as flow cytometry. Several effector cells, i.e., PBMC, NK, CAR-T were tested and validated as well as biological molecules such as Bi-specific T cell Engagers (BiTEs) targeting the EpCAM protein expressed on tumor cells and blocking antibodies against the immune checkpoint inhibitor PD-1. Using the specifically designed xCELLigence immunotherapy software, quantitative parameters such as KT50 (the amount of time it takes to kill 50% of the target tumor cells) and % cytolysis are calculated and used for comparing the relative efficacy of different reagents. In summary, our results demonstrate the xCELLigence platform to be well suited for potency assays, providing quantitative assessment with high reproducibility and a greatly simplified work flow.
Overview
The claims and statistics of this paper haven’t been checked yet.
Run the check — free, no account needed. It reads the open-access text and checks the sources it cites.
Integrity signals
Registry
Cites
Statistics
Figures
Verification
Claims the paper makes
The claims and statistics of this paper haven’t been checked yet.
Run the check — free, no account needed. It reads the open-access text and checks the sources it cites.
Claims other papers make about this one
Each is checked against this paper’s own text: does it say what the citing paper says it does?
The check wasn’t confident either way, so it gives no verdict — never disputed.
In the citing paper
“A similar clinical trial phase structure exists in the European Union, although some GMP regulations are stricter in Europe (132,133).”
From Scalable Manufacturing of CAR T Cells for Cancer Immunotherapy (2021) · cites this paper as [132]
Experimental — accuracy not yet measured
Self-check
Percentages, sums and reported differences re-computed from the paper’s own numbers.
The self-check needs the paper’s full text.
Citations
Cites
PD-1 and PD-L1 Immune Checkpoint Blockade to Treat Breast Cancer
Hartkopf, A. D., Taran, F., Wallwiener, M., Walter, C. B., Krämer, B., Grischke, E., & Brucker, S. Y. (2016) · Breast Care · doi:10.1159/000453569 · Cited by 30,989
Mutational landscape determines sensitivity to PD-1 blockade in non–small cell lung cancer
Rizvi, N. A., Hellmann, M. D., Snyder, A., Kvistborg, P., Makarov, V., Havel, J. J., Lee, W., Yuan, J., Wong, P., Ho, T. S., et al. (2015) · Science · doi:10.1126/science.aaa1348 · Cited by 7,802
Zhang, J.-H., Chung, T. D. Y., & Oldenburg, K. R. (1999) · SLAS Discovery · doi:10.1177/108705719900400206 · Cited by 6,847
Self-citationCancer immunotherapy: the beginning of the end of cancer?
Farkona, S., Diamandis, E. P., & Blasutig, I. M. (2016) · BMC Medicine · doi:10.1186/s12916-016-0623-5 · Cited by 1,231
Human cancer immunotherapy with antibodies to the PD-1 and PD-L1 pathway
Ohaegbulam, K. C., Assal, A., Lázár‐Molnár, E., Yao, Y., & Zang, X. (2014) · Trends in Molecular Medicine · doi:10.1016/j.molmed.2014.10.009 · Cited by 861
Tandem CAR T cells targeting HER2 and IL13Rα2 mitigate tumor antigen escape
Hegde, M. G., Mukherjee, M., Grada, Z., Pignata, A., Landi, D. B., Navai, S. A., Wakefield, A., Fousek, K., Bielamowicz, K., Chow, K. K. H., et al. (2016) · Journal of Clinical Investigation · doi:10.1172/jci83416 · Cited by 694
The Next Immune-Checkpoint Inhibitors: PD-1/PD-L1 Blockade in Melanoma
Mahoney, K. M., Freeman, G. J., & McDermott, D. F. (2015) · Clinical Therapeutics · doi:10.1016/j.clinthera.2015.02.018 · Cited by 589
The xCELLigence System for Real-Time and Label-Free Monitoring of Cell Viability
Ning, K., Wang, X., Xu, X., & Abassi, Y. A. (2011) · Methods in molecular biology · doi:10.1007/978-1-61779-108-6_6 · Cited by 441
Self-citationApplication of Real-Time Cell Electronic Sensing (RT-CES) Technology to Cell-Based Assays
Solly, K. J., Wang, X., Xu, X. Y., Strulovici, B., & Zheng, W. (2004) · Assay and Drug Development Technologies · doi:10.1089/adt.2004.2.363 · Cited by 383
Conditional reprogramming and long-term expansion of normal and tumor cells from human biospecimens
Liu, X., Krawczyk, E., Suprynowicz, F. A., Palechor-Ceron, N., Yuan, H., Dakic, A., Simić, V., Zheng, Y., Sripadhan, P., Chen, C., et al. (2017) · Nature Protocols · doi:10.1038/nprot.2016.174 · Cited by 305
New immunotherapies targeting the PD-1 pathway
Chinai, J. M., Janakiram, M., Chen, F., Chen, W., Kaplan, M., & Zang, X. (2015) · Trends in Pharmacological Sciences · doi:10.1016/j.tips.2015.06.005 · Cited by 202
Kho, D. T., Macdonald, C. E., Johnson, R. H., Unsworth, C. P., O’Carroll, S. J., du Mez, E., Angel, C. E., & Graham, E. S. (2015) · Biosensors · doi:10.3390/bios5020199 · Cited by 180
Novel Bispecific Antibodies Increase γδ T-Cell Cytotoxicity against Pancreatic Cancer Cells
Oberg, H., Peipp, M., Kellner, C., Sebens, S., Krause, S., Petrick, D., Adam‐Klages, S., Röcken, C., Becker, T., Vogel, I., et al. (2014) · Cancer Research · doi:10.1158/0008-5472.can-13-0675 · Cited by 162
Klinger, M., Benjamin, J., Kischel, R., Stienen, S., & Zugmaier, G. (2016) · Immunological Reviews · doi:10.1111/imr.12393 · Cited by 157
New flow cytometric assays for monitoring cell-mediated cytotoxicity
Zaritskaya, L., Shurin, M. R., Sayers, T. J., & Malyguine, A. M. (2010) · Expert Review of Vaccines · doi:10.1586/erv.10.49 · Cited by 156
PD-1 Pathway Inhibitors: Changing the Landscape of Cancer Immunotherapy
Dolan, D. E., & Gupta, S. (2014) · Cancer Control · doi:10.1177/107327481402100308 · Cited by 145
de Wolf, C., van de Bovenkamp, M., & Hoefnagel, M. H. N. (2017) · Cytotherapy · doi:10.1016/j.jcyt.2017.03.076 · Cited by 135
Liu, G., Atteridge, C. L., Wang, X., Lundgren, A. D., & Wu, J. D. (2010) · The Journal of Immunology · doi:10.4049/jimmunol.0903789 · Cited by 131
Measuring Cytotoxicity by Bioluminescence Imaging Outperforms the Standard Chromium-51 Release Assay
Karimi, M. A., Lee, E., Bachmann, M. H., Salicioni, A. M., Behrens, E. M., Kambayashi, T., & Baldwin, C. L. (2014) · PLoS ONE · doi:10.1371/journal.pone.0089357 · Cited by 129
Abassi, Y. A., Jackson, J. A., Zhu, J., O'Connell, J. S., Wang, X., & Xu, X. (2004) · Journal of Immunological Methods · doi:10.1016/j.jim.2004.06.022 · Cited by 99
Self-citationRocca, Y. S., Roberti, M. P., Juliá, E. P., Pampena, M. B., Bruno, L., Rivero, S., Huertas, E., Sánchez Loria, F., Pairola, A., Caignard, A., et al. (2016) · Frontiers in Immunology · doi:10.3389/fimmu.2016.00413 · Cited by 97
A Simple and Sensitive Method for Measuring Tumor-Specific T Cell Cytotoxicity
Fu, X., Tao, L., Rivera, A. M., Williamson, S. M., Song, X., Ahmed, N. M., & Zhang, X. (2010) · PLoS ONE · doi:10.1371/journal.pone.0011867 · Cited by 82
Zhu, J., Wang, X., Xu, X., & Abassi, Y. A. (2006) · Journal of Immunological Methods · doi:10.1016/j.jim.2005.10.018 · Cited by 80
Self-citationPeper-Gabriel, J. K., Schuster, H., Loeffler, M. W., Schmid-Horch, B. D., Rammensee, H., & Stevanović, S. (2014) · Journal of Immunological Methods · doi:10.1016/j.jim.2014.01.012 · Cited by 79
Clinical Pharmacology and Translational Aspects of Bispecific Antibodies
Trivedi, A., Stienen, S., Zhu, M., Li, H., Yuraszeck, T., Gibbs, J., Heath, T., Loberg, R., & Kasichayanula, S. (2017) · Clinical and Translational Science · doi:10.1111/cts.12459 · Cited by 76
Malyguine, A. M., Strobl, S. L., DUNHAM, K. R., Shurin, M. R., & Sayers, T. J. (2012) · Cells · doi:10.3390/cells1020111 · Cited by 63
Glamann, J., & Hansen, A. J. (2006) · Assay and Drug Development Technologies · doi:10.1089/adt.2006.4.555 · Cited by 61
PD-1 Blockade in Renal Cell Carcinoma: To Equilibrium and Beyond
Harshman, L. C., Drake, C. G., & Choueiri, T. K. (2014) · Cancer Immunology Research · doi:10.1158/2326-6066.cir-14-0193 · Cited by 49
Seidel, U. J. E., Vogt, F., Große‐Hovest, L., Jung, G., Handgretinger, R., & Lang, P. (2014) · Frontiers in Immunology · doi:10.3389/fimmu.2014.00618 · Cited by 49
Dyer, A., Di, Y., Calderón, H., Illingworth, S., Kueberuwa, G., Tedcastle, A. B., Jakeman, P., Chia, S. L., Brown, A., Silva, M. A., et al. (2016) · Molecular Therapy — Oncolytics · doi:10.1016/j.omto.2016.11.003 · Cited by 49
Efficacy of systemic adoptive transfer immunotherapy targeting NY-ESO-1 for glioblastoma
Everson, R. G., Antonios, J. P., Lisiero, D. N., Soto, H., Scharnweber, R., Garrett, M. C., Yong, W. H., Li, N., Li, G., Kruse, C. A., et al. (2015) · Neuro-Oncology · doi:10.1093/neuonc/nov153 · Cited by 43
Mandel, K., Seidl, D., Rades, D., Lehnert, H., Gieseler, F., Hass, R., & Ungefroren, H. (2013) · PLoS ONE · doi:10.1371/journal.pone.0056591 · Cited by 43
New Approaches for Monitoring CTL Activity in Clinical Trials
Malyguine, A. M., Strobl, S. L., Zaritskaya, L., Baseler, M., & Shafer-Weaver, K. (2007) · Advances in experimental medicine and biology · doi:10.1007/978-0-387-72005-0_29 · Cited by 38
Holden, H. T., Oldham, R. K., Ortaldo, J. R., & Herberman, R. B. (1977) · JNCI Journal of the National Cancer Institute · doi:10.1093/jnci/58.3.611 · Cited by 38
Vatsan, R., Bross, P. F., Liu, K., Theoret, M. R., Claro, A. D., Lu, J., Helms, W. S., Niland, B. P., Husain, S. R., & Puri, R. K. (2013) · Journal for ImmunoTherapy of Cancer · doi:10.1186/2051-1426-1-5 · Cited by 31
Targeting PD-1/PD-L1 in lung cancer: current perspectives
Rosell, R., González‐Cao, M., Karachaliou, N., Viteri, S., Espinosa, D. M., Teixidó, C., Ruiz, J. S., Molina‐Vila, M. Á., & Santarpía, M. (2015) · Lung Cancer Targets and Therapy · doi:10.2147/lctt.s55176 · Cited by 24
51Cr Release Assay of Antibody‐Dependent Cell‐Mediated Cytotoxicity (ADCC)
Nelson, D. L., Kurman, C. C., & De, S. (1993) · Current Protocols in Immunology · doi:10.1002/0471142735.im0727s08 · Cited by 22
Reporter Gene Imaging of Immune Responses to Cancer: Progress and Challenges
Dubey, P. (2012) · Theranostics · doi:10.7150/thno.3903 · Cited by 21
Immunotherapy resistance: the answers lie ahead – not in front – of us
Andrews, M. C., & Wargo, J. A. (2017) · Journal for ImmunoTherapy of Cancer · doi:10.1186/s40425-017-0212-y · Cited by 19
CAR-T cells are serial killers
Davenport, A. J., Jenkins, M. R., Ritchie, D. S., Prince, H. M., Trapani, J. A., Kershaw, M. H., Darcy, P. K., & Neeson, P. J. (2015) · OncoImmunology · doi:10.1080/2162402x.2015.1053684 · Cited by 19
Ruiz, C. F., Kustermann, S., Pietilä, E. A., Vlajnic, T., Baschiera, B., Arabi, L., Lorber, T., Oeggerli, M., Savic, S., Obermann, E. C., et al. (2016) · PLoS ONE · doi:10.1371/journal.pone.0160807 · Cited by 19
Avidity characterization of genetically engineered T-cells with novel and established approaches
Hillerdal, V., Boura, V. F., Björkelund, H., Andersson, K., & Essand, M. (2016) · BMC Immunology · doi:10.1186/s12865-016-0162-z · Cited by 18
Schlegel, P.-G., Feuchtinger, T. F., Nitschke-Gérard, C., Seidel, U. J. E., Lang, A.-M., Kyzirakos, C., Teltschik, H.-M., Ebinger, M., Schumm, M., Kościelniak, E., et al. (2015) · Bone Marrow Transplantation · doi:10.1038/bmt.2015.100 · Cited by 17
A simple in vitro method for evaluating dendritic cell-based vaccinations
Pham, P. V., Nhung, N. T., Hoàng, N. T., Khuat, L. T., Le, P., Pham, V., Nguyen, H. T. L., & Phan, N. D. T. (2014) · OncoTargets and Therapy · doi:10.2147/ott.s67057 · Cited by 15
Kirschner, A., Thiede, M., Blaeschke, F., Richter, G. H. S., Gerke, J. S., Baldauf, M. C., Grünewald, T. G. P., Busch, D. H., Burdach, S. E. G., & Thiel, U. (2016) · Oncotarget · doi:10.18632/oncotarget.10647 · Cited by 7
Quantifying the Potency of Cancer Immunotherapies
Lamarche, B. J., Xi, B., & Cerignoli, F. (2016) · Genetic Engineering & Biotechnology News · doi:10.1089/gen.36.14.08 · Cited by 1
Self-citationWatanabe, K., Guedan, S., Scholler, J., McGettigan, S. E., Luo, Y., Tähtinen, S., Parviainen, S., Havunen, R., Siurala, M., Hemminki, A., et al. (2016) · Blood · doi:10.1182/blood.v128.22.3360.3360 · Cited by 1
Cited by
Sorted by citations
Scalable Manufacturing of CAR T Cells for Cancer Immunotherapy
Abou-el-Enein, M., Elsallab, M., Feldman, S. A., Fesnak, A. D., Heslop, H. E., Marks, P., Till, B. G., Bauer, G., & Savoldo, B. (2021) · Blood Cancer Discovery · doi:10.1158/2643-3230.bcd-21-0084 · Cited by 321
“An automated QC testing setup that produces real-time measurements of cell binding and killing allowing for continuous product quality monitoring during the manufacturing process may prove advantageous (132).”
MethodThe Tim-3-Galectin-9 Pathway and Its Regulatory Mechanisms in Human Breast Cancer
Yasinska, I. M., Sakhnevych, S. S., Pavlova, L., Selnø, A. T. H., Abeleira, A. M. T., Benlaouer, O., Silva, I. G., Mosimann, M., Varani, L., Bardelli, M., et al. (2019) · Frontiers in Immunology · doi:10.3389/fimmu.2019.01594 · Cited by 178
“Intriguingly, in line with our observations that galectin-9 levels in PC3 prostate cancer cells are low compared to other cancer cells, these cells were recently reported to be rapidly killed by TALL-104 cells used in our work (32).”
BackgroundComparative analysis of assays to measure CAR T cell-mediated cytotoxicity
Kiesgen, S., Messinger, J. C., Chintala, N. K., Tano, Z., & Adusumilli, P. S. (2021) · Nature Protocols · doi:10.1038/s41596-020-00467-0 · Cited by 138
Nakazawa, T., Natsume, A., Nishimura, F., Morimoto, T., Matsuda, R., Nakamura, M., Yamada, S., Nakagawa, I., Motoyama, Y., Park, Y.-S., et al. (2020) · Cells · doi:10.3390/cells9040998 · Cited by 102
Invariant natural killer T cells coordinate removal of senescent cells
Arora, S., Thompson, P. J., Wang, Y., Bhattacharyya, A., Apostolopoulou, H., Hatano, R., Naikawadi, R. P., Shah, A., Wolters, P. J., Koliwad, S., et al. (2021) · Med · doi:10.1016/j.medj.2021.04.014 · Cited by 77
Metadata
- Authors
- Cerignoli, F., Abassi, Y. A., Lamarche, B. J., Guenther, G., Santa Ana, D., Guimet, D., Zhang, W., Zhang, J., & Xi, B.
- Affiliations
- ACEA Biosciences (United States) (US)
- Corresponding author
- Xi, Biao
- Venue
- PLOS ONE
- Publisher
- Public Library of Science (PLoS)
- Published
- 2018-03-02
- Volume
- 13
- Issue
- 3
- Pages
- e0193498
- ISSN
- 1932-6203 (ISSN-L)
- PMC
- PMC5834184
- OpenAlex
- W2791857742
- Cited by
- 105
- References
- 47
- Citations by year
- 2026: 13 · 2025: 9 · 2024: 6 · 2023: 13 · 2022: 15 · 2021: 19 · 2020: 11 · 2019: 17 · 2018: 2
- FWCI
- 5.27
- Type
- journal article
- Language
- en
- Open access
- gold
- doi.org
- Licence
- Locations
- PLoS ONE (publishedVersion, cc-by)
- PubMed Central (publishedVersion, cc-by)
- PubMed (publishedVersion)
- DOAJ (DOAJ: Directory of Open Access Journals) (submittedVersion, cc-by-sa)
- Figshare (submittedVersion, cc-by)
- Topics
- Life Sciences › Immunology and Microbiology › Immunology › Immune Cell Function and Interaction
- Health Sciences › Medicine › Oncology › Cancer Immunotherapy and Biomarkers
- Life Sciences › Immunology and Microbiology › Immunology › Immunotherapy and Immune Responses
- Keywords
- cancer immunotherapy, potency assay, real-time cell monitoring, xCELLigence, tumor cell lysis, chimeric antigen receptor T cells, natural killer cells, bispecific T-cell engagers, EpCAM, gold microelectrodes, liquid tumors
- MeSH terms
- Epithelial Cell Adhesion Molecule, Antibodies, Biological Assay, Cytological Techniques, Humans, Immunotherapy, Leukocytes, Mononuclear, Apoptosis, Cell Line, Tumor, Programmed Cell Death 1 Receptor, MCF-7 Cells
About these checks
Registry, retraction, Cites and statistics results are computed, not judged, with one exception: a printed reference that no index lists is read once by a model before it counts as a citation error. Claims are extracted by a model and kept only when their quote appears verbatim in the text; each cited source is then checked, with a model’s help, for whether it says what the claim relies on. Those verdicts can be wrong — read the claim’s quote and the cited source before relying on one.
Statistics and arithmetic are recomputed, not judged.
Confidence bands are shown only for fields calibrated on our annotated test set. None is calibrated yet, so no band is shown.
What counts as a claim ›How we measure confidence ›How we check this ›
Are you an author, or do you see a problem with this page? Request a review
