

The DOI matches its Crossref record; 101 of the 101 references it cites were found in a registry or an index; none of the 13 sources its claims cite is checked for support yet.
Heart rate variability in type 2 diabetes mellitus: A systematic review and meta–analysis
Open accessAbstract
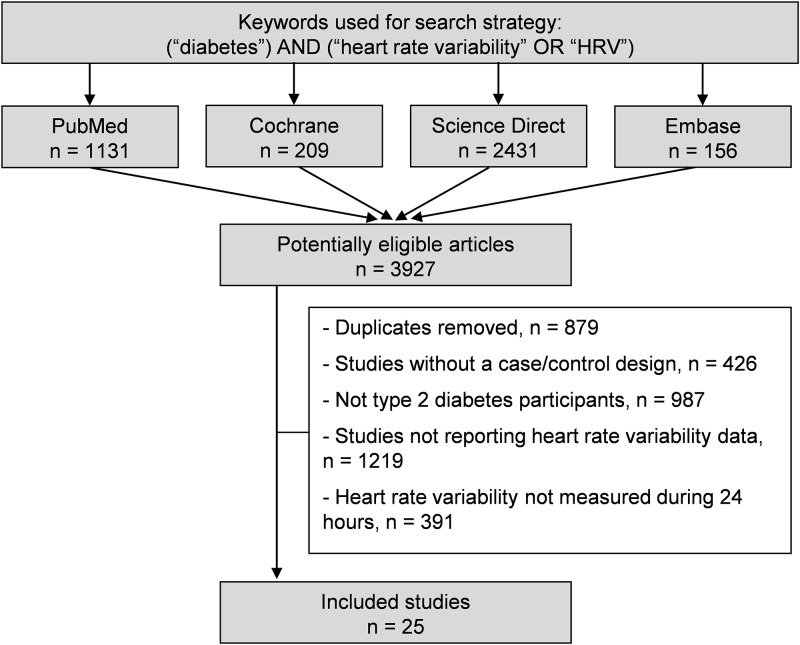
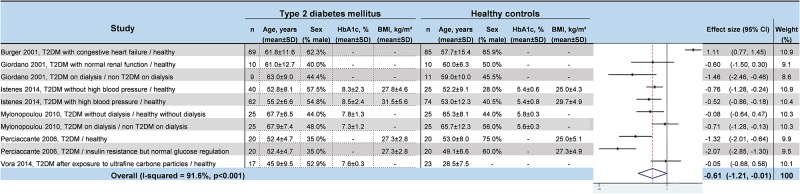
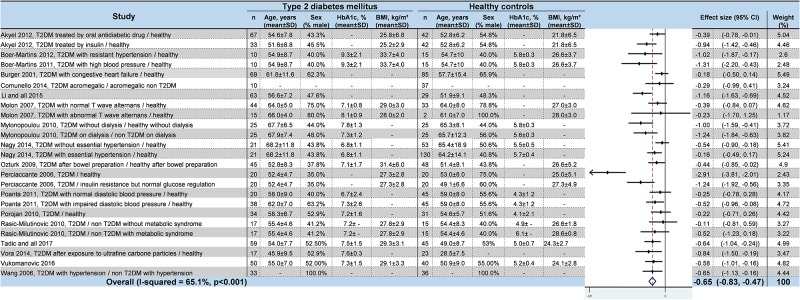
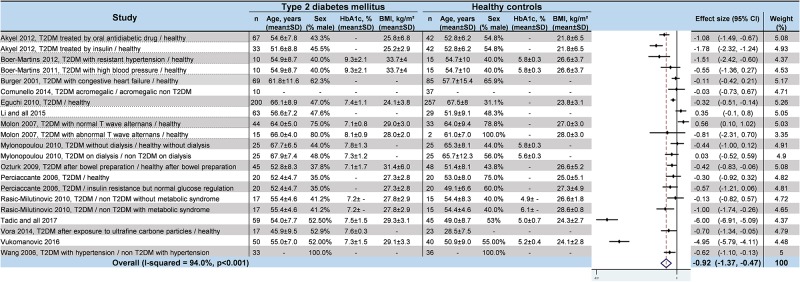
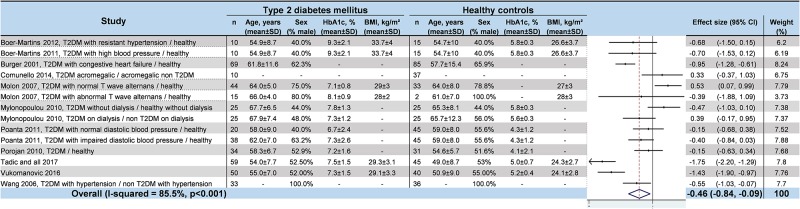
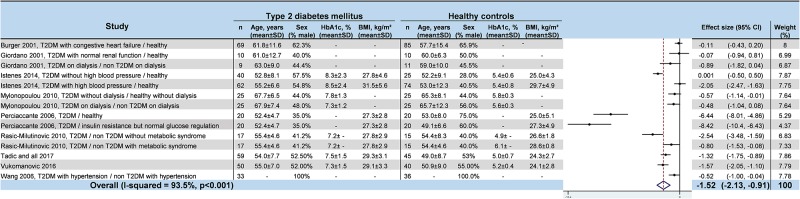
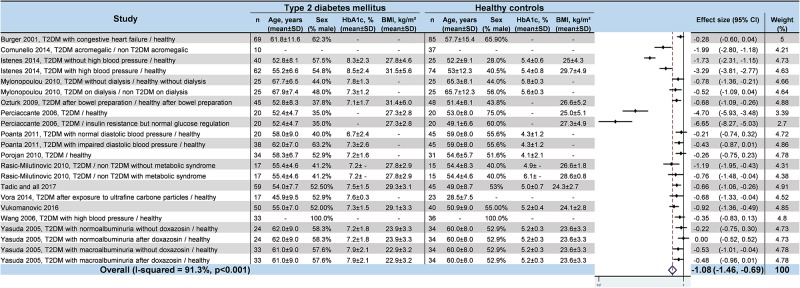
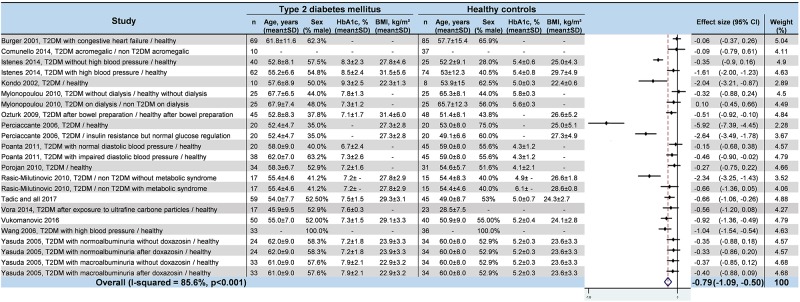
BACKGROUND: Cardiac autonomic neuropathy in type 2 dibetes mellitus (T2DM) patients is frequent and associated with high cardiovascular mortality. Heart rate variability (HRV) is the gold standard to measure cardiac autonomic neuropathy. We aimed to conduct a systematic review and meta-analysis to evaluate the impact of T2DM on HRV parameters. METHODS: The PubMed, Cochrane Library, Embase and Science Direct databases were searched on 1st October 2017 using the keywords "diabetes" AND ("heart rate variability" OR "HRV"). Included articles had to report HRV parameters in T2DM patients and healthy controls measured during 24 hours with a Holter-electrocardiogram. Measurements of HRV retieved were: RR-intervals (or Normal to Normal intervals-NN), standard deviation of RR intervals (SDNN), percetange of adjacent NN intervals differing by more than 50 milliseconds (pNN50), square root of the mean squared difference of successive RR intervals (RMSSD), total power, Low Frequency (LF), High Frequency (HF) and LF/HF ratio, as per Task Force recommendations. RESULTS: We included twenty-five case-control studies with 2,932 patients: 1,356 with T2DM and 1,576 healthy controls. T2DM patients had significantly (P<0.01) lower RR-intervals (effect size = -0.61; 95%CI -1.21 to -0.01), lower SDNN (-0.65; -0.83 to -0.47), lower RMSSD (-0.92; -1.37 to -0.47), lower pNN50 (-0.46; -0.84 to -0.09), lower total power (-1.52; -2.13 to -0.91), lower LF (-1.08; -1.46 to -0.69]), and lower HF (-0.79; -1.09 to -0.50). LF/HF did not differ between groups. Levels of blood glucose and HbA1c were associated with several HRV parameters, as well as Time from diagnosis of T2DM. CONCLUSIONS: T2DM was associated with an overall decrease in the HRV of T2DM patients. Both sympathetic and parasympathetic activity were decreased, which can be explained by the deleterious effects of altered glucose metabolism on HRV, leading to cardiac autonomic neuropathy.
Overview
AI snapshot
Written from the paper’s full text.
TL;DR
This systematic review and meta-analysis found that type 2 diabetes mellitus (T2DM) is associated with an overall decrease in heart rate variability (HRV), with both sympathetic and parasympathetic activity reduced. The authors attribute this to deleterious effects of altered glucose metabolism leading to cardiac autonomic neuropathy.
Key findings
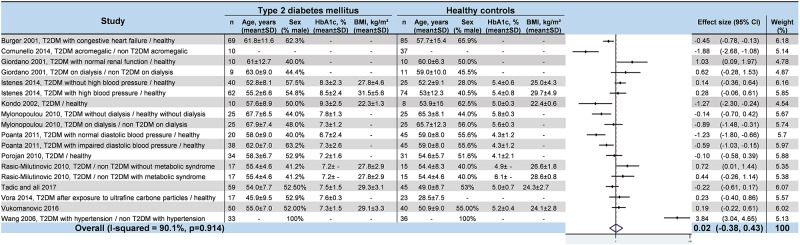
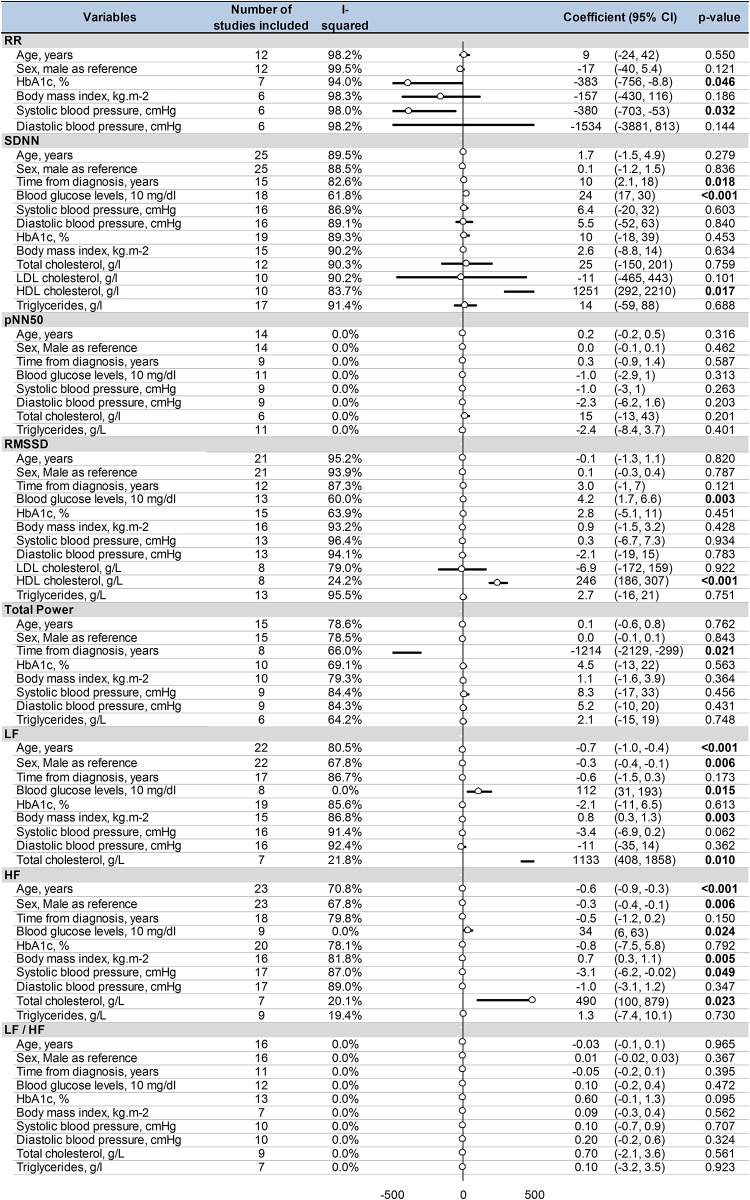
Twenty-five case-control studies with 2,932 patients (1,356 T2DM, 1,576 healthy controls) showed significantly lower HRV in T2DM for RR intervals (effect size = –0.61; 95%CI –1.21 to –0.01), SDNN (–0.65; –0.83 to –0.47), RMSSD (–0.92; –1.37 to –0.47), pNN50 (–0.46; –0.84 to –0.09), total power (–1.52; –2.13 to –0.91), LF (–1.08; –1.46 to –0.69), and HF (–0.79; –1.09 to –0.50). LF/HF did not differ between groups (effect size = 0.02; 95%CI –0.38 to 0.43; P = 0.914). Meta-regressions found age and male gender associated with decreased LF and HF; blood glucose and total cholesterol associated with increased LF and HF; higher HbA1c associated with shorter RR intervals; and time from T2DM diagnosis linked with higher SDNN and lower total power.
Methods
Systematic review and meta-analysis of case-control studies reporting 24-hour Holter-electrocardiogram HRV parameters in T2DM patients and healthy controls, following Task Force recommendations. Databases searched were PubMed, Cochrane Library, Embase, and Science Direct (search date reported as 1 October 2017; text also states between 30 October 2015 and 1 October 2017). Random-effects meta-analyses (DerSimonian and Laird) calculated standardised mean differences, with heterogeneity assessed by I² and meta-regressions for clinically relevant variables; study quality was assessed with STROBE and CONSORT.
Limitations
The paper states that meta-analyses inherit limitations of included studies and are subject to selection bias; included studies varied in quality, most were cross-sectional, measurement conditions differed, and inclusion criteria were not identical. The paper also states that control health status was not detailed in all studies, some studies were monocentric, the final number of patients was not very high, and missing or declarative data were potential biases. Evident from the text: heterogeneity was significant for all meta-analyses (e.g., I² = 91.6% for RR intervals, 94.0% for RMSSD, 93.5% for total power), and many variables (HbA1c, BMI, blood pressure, insulin, HOMA-IR, neuropathy scores) were missing or unreported across studies, limiting meta-regression analyses.
Model-written summary. Check it against the paper before relying on it.
Integrity signals
Registry
Cites
Statistics
Figures
Verification
Claims the paper makes
37 Own result · 18 Own method · 14 Own interpretation · 10 Not checked yet · 1 No basis given
A result the paper reports from its own data — it cites no other source for it, so there is none to check. The quote shows it is in the paper.
In the paper
“lower LF (–1.08; –1.46 to –0.69])”
- Also stated in: § Meta–analyses of HRV values in T2DM · boosted
“lower LF (effect size = –1.08; 95%CI –1.46 to –0.69; p < 0.001; I2 = 91.3%) (Fig 7) [42,45,47–54,57,63,65,66]”
§ Heart rate variability in type 2 diabetes mellitus: A systematic review and meta–analysis > Abstract > Results
boostedn = 2,932 ·- Asserted: passes — The authors put it forward as true.
- Checkable: passes — It can be checked against evidence.
- Load-bearing: passes — The paper’s conclusions depend on it.
- Based: passes — The paper gives a reason why it holds.
- Also stated in: § Meta–analyses of HRV values in T2DM · boosted
A result the paper reports from its own data — it cites no other source for it, so there is none to check. The quote shows it is in the paper.
In the paper
“Blood glucose levels were also significantly associated with an increase in RMSSD (coefficient = 4.2; 95%CI 1.7–6.6, P = 0.003) and with an increase in SDNN (coefficient = 24; 95%CI 17–30, P < 0.001).”
§ Heart rate variability in type 2 diabetes mellitus: A systematic review and meta–analysis > Results > Meta–regressions
plaincorrelational- Asserted: passes — The authors put it forward as true.
- Checkable: passes — It can be checked against evidence.
- Load-bearing: unclear — It is unclear whether the paper’s conclusions depend on it.
- Based: passes — The paper gives a reason why it holds.
A result the paper reports from its own data — it cites no other source for it, so there is none to check. The quote shows it is in the paper.
In the paper
“Body mass index was associated with both an increase in LF (coefficient = 0.8; 95%CI 0.3–1.3, P = 0.003) and in HF (coefficient = 0.7; 95%CI 0.3–1.1, P = 0.005).”
§ Heart rate variability in type 2 diabetes mellitus: A systematic review and meta–analysis > Results > Meta–regressions
plaincorrelational- Asserted: passes — The authors put it forward as true.
- Checkable: passes — It can be checked against evidence.
- Load-bearing: unclear — It is unclear whether the paper’s conclusions depend on it.
- Based: passes — The paper gives a reason why it holds.
A result the paper reports from its own data — it cites no other source for it, so there is none to check. The quote shows it is in the paper.
In the paper
“Similarly, both blood glucose levels and total cholesterol were associated with both an increase in LF (coefficient = 112; 95%CI 31–193, P = 0.015; coefficient = 1133; 95%CI 408–1858, P = 0.01; respectively) and in HF (coefficient = 34; 95%CI 6–63, P = 0.024; coefficient = 490; 95%CI 100–879, P = 0.023).”
§ Heart rate variability in type 2 diabetes mellitus: A systematic review and meta–analysis > Results > Meta–regressions
plaincorrelational- Asserted: passes — The authors put it forward as true.
- Checkable: passes — It can be checked against evidence.
- Load-bearing: unclear — It is unclear whether the paper’s conclusions depend on it.
- Based: passes — The paper gives a reason why it holds.
A result the paper reports from its own data — it cites no other source for it, so there is none to check. The quote shows it is in the paper.
In the paper
“LF/HF did not differ between groups.”
- Also stated in: § Meta–analyses of HRV values in T2DM · plain
“LF/HF did not differ between groups (effect size = 0.02; 95%CI –0.38 to 0.43; P = 0.914; I2 = 90.1%) (Fig 9) [42,44,46–48,50–54,57,65,66]”
§ Heart rate variability in type 2 diabetes mellitus: A systematic review and meta–analysis > Abstract > Results
plainn = 2,932- Asserted: passes — The authors put it forward as true.
- Checkable: passes — It can be checked against evidence.
- Load-bearing: passes — The paper’s conclusions depend on it.
- Based: passes — The paper gives a reason why it holds.
- Also stated in: § Meta–analyses of HRV values in T2DM · plain
A result the paper reports from its own data — it cites no other source for it, so there is none to check. The quote shows it is in the paper.
In the paper
“Similarly, both blood glucose levels and total cholesterol were associated with both an increase in LF (coefficient = 112; 95%CI 31–193, P = 0.015; coefficient = 1133; 95%CI 408–1858, P = 0.01; respectively) and in HF (coefficient = 34; 95%CI 6–63, P = 0.024; coefficient = 490; 95%CI 100–879, P = 0.023).”
§ Heart rate variability in type 2 diabetes mellitus: A systematic review and meta–analysis > Results > Meta–regressions
plaincorrelational- Asserted: passes — The authors put it forward as true.
- Checkable: passes — It can be checked against evidence.
- Load-bearing: unclear — It is unclear whether the paper’s conclusions depend on it.
- Based: passes — The paper gives a reason why it holds.
A result the paper reports from its own data — it cites no other source for it, so there is none to check. The quote shows it is in the paper.
In the paper
“Age and male gender were associated with both a decrease in LF (coefficient = –0.7; 95%CI –1 to –0.4, P < 0.001; and coefficient = –0.3; 95%CI –0.4 to –0.1, P = 0.006, respectively) and a decrease in HF (coefficient = –0.6; 95%CI –0.9 to –0.3, P < 0.001; and coefficient = –0.3; 95%CI –0.4 to –0.1, P = 0.006).”
§ Heart rate variability in type 2 diabetes mellitus: A systematic review and meta–analysis > Results > Meta–regressions
plaincorrelational- Asserted: passes — The authors put it forward as true.
- Checkable: passes — It can be checked against evidence.
- Load-bearing: unclear — It is unclear whether the paper’s conclusions depend on it.
- Based: passes — The paper gives a reason why it holds.
A result the paper reports from its own data — it cites no other source for it, so there is none to check. The quote shows it is in the paper.
In the paper
“Body mass index was associated with both an increase in LF (coefficient = 0.8; 95%CI 0.3–1.3, P = 0.003) and in HF (coefficient = 0.7; 95%CI 0.3–1.1, P = 0.005).”
§ Heart rate variability in type 2 diabetes mellitus: A systematic review and meta–analysis > Results > Meta–regressions
plaincorrelational- Asserted: passes — The authors put it forward as true.
- Checkable: passes — It can be checked against evidence.
- Load-bearing: unclear — It is unclear whether the paper’s conclusions depend on it.
- Based: passes — The paper gives a reason why it holds.
A result the paper reports from its own data — it cites no other source for it, so there is none to check. The quote shows it is in the paper.
In the paper
“Time from diagnosis of T2DM was linked with a higher level of SDNN (coefficient = 10; 95%CI 2.1–18, P = 0.018) and a lower level of total power (coefficient = –1214; 95%CI –2129 to –299, P = 0.021) (Fig 10).”
§ Heart rate variability in type 2 diabetes mellitus: A systematic review and meta–analysis > Results > Meta–regressions
plaincorrelational- Asserted: passes — The authors put it forward as true.
- Checkable: passes — It can be checked against evidence.
- Load-bearing: unclear — It is unclear whether the paper’s conclusions depend on it.
- Based: passes — The paper gives a reason why it holds.
A result the paper reports from its own data — it cites no other source for it, so there is none to check. The quote shows it is in the paper.
In the paper
“Higher levels of HbA1c were associated with shorter RR intervals (coefficient = –383; 95%CI –756 to –8.8, P = 0.046).”
§ Heart rate variability in type 2 diabetes mellitus: A systematic review and meta–analysis > Results > Meta–regressions
plaincorrelational- Asserted: passes — The authors put it forward as true.
- Checkable: passes — It can be checked against evidence.
- Load-bearing: unclear — It is unclear whether the paper’s conclusions depend on it.
- Based: passes — The paper gives a reason why it holds.
- It may state two separate claims as one. 9
- The quote only partly states this claim. 1
- Probably not a substantial claim. 11
The paper states this without a source or data behind it here, so there is nothing to check it against. The quote shows it is in the paper.
In the paper
“Both sympathetic and parasympathetic activity were decreased, which can be explained by the deleterious effects of altered glucose metabolism on HRV.”
§ Heart rate variability in type 2 diabetes mellitus: A systematic review and meta–analysis > Conclusion
plaincorrelational- Asserted: passes — The authors put it forward as true.
- Checkable: passes — It can be checked against evidence.
- Load-bearing: passes — The paper’s conclusions depend on it.
- Based: passes — The paper gives a reason why it holds.
It may state two separate claims as one.
In the paper
“Finally, in line with the literature, we demonstrated a decrease in both LF and HF with age [95] and the male gender [96].”
§ Heart rate variability in type 2 diabetes mellitus: A systematic review and meta–analysis > Discussion > Other variables linked with HRV in T2DM
What the sources say
- Not checked yetcites [96] P Pavithran, 2008, Sex differences in short-term heart rate variability in patients with newly diagnosed essential hypertension, J Clin Hypertens Greenwich Conn source
boosteddirect- Asserted: passes — The authors put it forward as true.
- Checkable: passes — It can be checked against evidence.
- Load-bearing: unclear — It is unclear whether the paper’s conclusions depend on it.
- Based: passes — The paper gives a reason why it holds.
The quote only partly states this claim.
In the paper
“The RMSSD and pNN50 are associated with high–frequency power (HF) and hence parasympathetic activity, whereas SDNN is correlated with low–frequency power (LF) [33].”
§ Heart rate variability in type 2 diabetes mellitus: A systematic review and meta–analysis > Methods > HRV parameters
What the sources say
- Not checked yetcites [33] H Otzenberger, 1998, Dynamic heart rate variability: a tool for exploring sympathovagal balance continuously during sleep in men, Am J Physiol
plaincorrelational- Asserted: passes — The authors put it forward as true.
- Checkable: passes — It can be checked against evidence.
- Load-bearing: fails — The paper’s conclusions may not depend on it.
- Based: passes — The paper gives a reason why it holds.
Probably not a substantial claim. The paper’s conclusions may not depend on it. It may state two separate claims as one.
A conclusion the paper draws from its own results — it cites no other source for it, so there is none to check. The quote shows it is in the paper.
In the paper
“With the exception of the LF/HF ratio, which did not differ in our meta–analysis due to comparable changes in the LF and HF components, T2DM has a negative influence on almost all HRV parameters, reflecting the fact that diabetes leads to a cardiac autonomic dysfunction.”
§ Heart rate variability in type 2 diabetes mellitus: A systematic review and meta–analysis > Discussion > An alteration of both sympathetic and parasympathetic activity
plaindirect- Asserted: passes — The authors put it forward as true.
- Checkable: passes — It can be checked against evidence.
- Load-bearing: passes — The paper’s conclusions depend on it.
- Based: passes — The paper gives a reason why it holds.
It may state two separate claims as one.
A conclusion the paper draws from its own results — it cites no other source for it, so there is none to check. The quote shows it is in the paper.
In the paper
“Both sympathetic and parasympathetic activity were decreased, which can be explained by the deleterious effects of altered glucose metabolism on HRV, leading to cardiac autonomic neuropathy.”
- Also stated in: § An alteration of both sympathetic and parasympathetic activity · boosted
“However, we demonstrated that T2DM patients had a decrease in both parasympathetic and sympathetic activity.”
§ Heart rate variability in type 2 diabetes mellitus: A systematic review and meta–analysis > Abstract > Conclusions
boostedcorrelational- Asserted: passes — The authors put it forward as true.
- Checkable: passes — It can be checked against evidence.
- Load-bearing: passes — The paper’s conclusions depend on it.
- Based: passes — The paper gives a reason why it holds.
It may state two separate claims as one.
- Also stated in: § An alteration of both sympathetic and parasympathetic activity · boosted
In the paper
“Despite we demonstrated a decreased SDNN in T2DM patients, the metaregression is not contradictory but may simply highlights the fact that cardiac parasympathetic activity in T2DM is affected before sympathetic activity [80].”
§ Heart rate variability in type 2 diabetes mellitus: A systematic review and meta–analysis > Discussion > Deleterious effects of altered glucose metabolism
What the sources say
- Not checked yetcites [80] RK Goit, 2012, Cardiovascular autonomic function and vibration perception threshold in type 2 diabetes mellitus, J Diabetes Complications source
hedgedcorrelational- Asserted: passes — The authors put it forward as true.
- Checkable: passes — It can be checked against evidence.
- Load-bearing: unclear — It is unclear whether the paper’s conclusions depend on it.
- Based: passes — The paper gives a reason why it holds.
It may state two separate claims as one.
A conclusion the paper draws from its own results — it cites no other source for it, so there is none to check. The quote shows it is in the paper.
In the paper
“Dyslipdaemia and high blood pressure are linked with a decreased HRV in T2DM.”
§ Heart rate variability in type 2 diabetes mellitus: A systematic review and meta–analysis > Discussion
plaincorrelational- Asserted: passes — The authors put it forward as true.
- Checkable: passes — It can be checked against evidence.
- Load-bearing: unclear — It is unclear whether the paper’s conclusions depend on it.
- Based: passes — The paper gives a reason why it holds.
It may state two separate claims as one.
What the paper did — it cites no source for this, so there is none to check. The quote shows it is in the paper.
In the paper
“Two authors (Thomas Benichou and Frédéric Dutheil) reviewed the abstracts independently and checked if article could be included in our metanalaysis according to inclusion critera. When consensus on suitability was not reached, a third author (Bruno Pereira) reviewed the debated articles.”
§ Heart rate variability in type 2 diabetes mellitus: A systematic review and meta–analysis > Methods > Literature search
plain- Asserted: passes — The authors put it forward as true.
- Checkable: passes — It can be checked against evidence.
- Load-bearing: fails — The paper’s conclusions may not depend on it.
- Based: passes — The paper gives a reason why it holds.
Probably not a substantial claim. The paper’s conclusions may not depend on it. It may state two separate claims as one.
What the paper did — it cites no source for this, so there is none to check. The quote shows it is in the paper.
In the paper
“Similarly, the final number of patients included in the metaanalysis was not very high and may precluded generalizability, however the mean age could be considered as quite representative.”
§ Heart rate variability in type 2 diabetes mellitus: A systematic review and meta–analysis > Discussion > Limitations
plain- Asserted: passes — The authors put it forward as true.
- Checkable: passes — It can be checked against evidence.
- Load-bearing: fails — The paper’s conclusions may not depend on it.
- Based: passes — The paper gives a reason why it holds.
Probably not a substantial claim. The paper’s conclusions may not depend on it.
What the paper did — it cites no source for this, so there is none to check. The quote shows it is in the paper.
In the paper
“Results varied from 50% [59] to 71% [56] for the observational studies (STROBE), with a mean score of 59%.”
§ Heart rate variability in type 2 diabetes mellitus: A systematic review and meta–analysis > Results > Quality of articles
plain- Asserted: passes — The authors put it forward as true.
- Checkable: passes — It can be checked against evidence.
- Load-bearing: unclear — It is unclear whether the paper’s conclusions depend on it.
- Based: passes — The paper gives a reason why it holds.
It may state two separate claims as one.
What the paper did — it cites no source for this, so there is none to check. The quote shows it is in the paper.
In the paper
“However, included studies were homogeneous according to funnel plots, and the populations investigated in the meta–analysis appeared to be equally distributed around the world.”
§ Heart rate variability in type 2 diabetes mellitus: A systematic review and meta–analysis > Discussion > Limitations
hedged- Asserted: passes — The authors put it forward as true.
- Checkable: passes — It can be checked against evidence.
- Load-bearing: fails — The paper’s conclusions may not depend on it.
- Based: fails — The paper may give no reason why it holds.
Probably not a substantial claim. The paper’s conclusions may not depend on it. The paper may give no reason why it holds.
A conclusion the paper draws from its own results — it cites no other source for it, so there is none to check. The quote shows it is in the paper.
In the paper
“Both sympathetic and parasympathetic activity were decreased, which can be explained by the deleterious effects of altered glucose metabolism on HRV.”
§ Heart rate variability in type 2 diabetes mellitus: A systematic review and meta–analysis > Conclusion
plaindirect- Asserted: passes — The authors put it forward as true.
- Checkable: passes — It can be checked against evidence.
- Load-bearing: passes — The paper’s conclusions depend on it.
- Based: fails — The paper may give no reason why it holds.
Probably not a substantial claim. The paper may give no reason why it holds.
What the paper did — it cites no source for this, so there is none to check. The quote shows it is in the paper.
In the paper
“Similarly, the final number of patients included in the metaanalysis was not very high and may precluded generalizability, however the mean age could be considered as quite representative.”
§ Heart rate variability in type 2 diabetes mellitus: A systematic review and meta–analysis > Discussion > Limitations
hedged- Asserted: passes — The authors put it forward as true.
- Checkable: fails — It may be too vague to check against evidence.
- Load-bearing: fails — The paper’s conclusions may not depend on it.
- Based: fails — The paper may give no reason why it holds.
Probably not a substantial claim. It may be too vague to check against evidence. The paper’s conclusions may not depend on it. The paper may give no reason why it holds.
What the paper did — it cites no source for this, so there is none to check. The quote shows it is in the paper.
In the paper
“However, the use of broader keywords in the search strategy limits the number of missing studies.”
§ Heart rate variability in type 2 diabetes mellitus: A systematic review and meta–analysis > Discussion > Limitations
plaindirect- Asserted: passes — The authors put it forward as true.
- Checkable: passes — It can be checked against evidence.
- Load-bearing: fails — The paper’s conclusions may not depend on it.
- Based: fails — The paper may give no reason why it holds.
Probably not a substantial claim. The paper’s conclusions may not depend on it. The paper may give no reason why it holds.
What the paper did — it cites no source for this, so there is none to check. The quote shows it is in the paper.
In the paper
“Though there were similarities between the participants’ inclusion criteria, they were not identical.”
§ Heart rate variability in type 2 diabetes mellitus: A systematic review and meta–analysis > Discussion > Limitations
plain- Asserted: passes — The authors put it forward as true.
- Checkable: passes — It can be checked against evidence.
- Load-bearing: fails — The paper’s conclusions may not depend on it.
- Based: passes — The paper gives a reason why it holds.
Probably not a substantial claim. The paper’s conclusions may not depend on it.
What the paper did — it cites no source for this, so there is none to check. The quote shows it is in the paper.
In the paper
“Results varied from 52% [59] to 67% [57] for the randomized trials (CONSORT), with a mean score of 59.5%.”
§ Heart rate variability in type 2 diabetes mellitus: A systematic review and meta–analysis > Results > Quality of articles
plain- Asserted: passes — The authors put it forward as true.
- Checkable: passes — It can be checked against evidence.
- Load-bearing: unclear — It is unclear whether the paper’s conclusions depend on it.
- Based: passes — The paper gives a reason why it holds.
It may state two separate claims as one.
What the paper did — it cites no source for this, so there is none to check. The quote shows it is in the paper.
In the paper
“The assessment of the quality of the twenty–five studies that were included was performed using the STROBE and CONSORT criteria.”
§ Heart rate variability in type 2 diabetes mellitus: A systematic review and meta–analysis > Results > Quality of articles
plain- Asserted: passes — The authors put it forward as true.
- Checkable: passes — It can be checked against evidence.
- Load-bearing: fails — The paper’s conclusions may not depend on it.
- Based: passes — The paper gives a reason why it holds.
Probably not a substantial claim. The paper’s conclusions may not depend on it.
What the paper did — it cites no source for this, so there is none to check. The quote shows it is in the paper.
In the paper
“We searched for potential publication bias using funnel plots of these meta–analyses.”
§ Heart rate variability in type 2 diabetes mellitus: A systematic review and meta–analysis > Methods > Statistical considerations
plain- Asserted: passes — The authors put it forward as true.
- Checkable: passes — It can be checked against evidence.
- Load-bearing: fails — The paper’s conclusions may not depend on it.
- Based: passes — The paper gives a reason why it holds.
Probably not a substantial claim. The paper’s conclusions may not depend on it.
What the paper did — it cites no source for this, so there is none to check. The quote shows it is in the paper.
In the paper
“Variables retrieved from declarative data in each study included are also a putative bias.”
§ Heart rate variability in type 2 diabetes mellitus: A systematic review and meta–analysis > Discussion > Limitations
hedged- Asserted: passes — The authors put it forward as true.
- Checkable: passes — It can be checked against evidence.
- Load-bearing: fails — The paper’s conclusions may not depend on it.
- Based: fails — The paper may give no reason why it holds.
Probably not a substantial claim. The paper’s conclusions may not depend on it. The paper may give no reason why it holds.
The paper relies on this without support.
HRV is the gold standard to measure cardiac autonomic neuropathy.
“Heart rate variability (HRV) is the gold standard to measure cardiac autonomic neuropathy.”
The paper relies on this without support.
HRV parameters are associated with high inter- and intra-individual variability.
“with different measurement conditions for HRV parameters associated with a high inter and intra–individual variability.”
Claims other papers make about this one
Each is checked against this paper’s own text: does it say what the citing paper says it does?
The source backs part of the claim, not all of it — or backs it for a different population, condition or comparison.
In the citing paper
“Both DM and prediabetes are independently associated with lower heart rate variability (HRV), which suggests that cardiac autonomic dysfunction may be characteristic of prediabetes2–5.”
From Sleep and temperature data from wearable devices support noninvasive detection of diabetes mellitus in a large-scale, retrospective analysis (2026) · cites this paper as [3]
Experimental — accuracy not yet measured
Self-check
Percentages, sums and reported differences re-computed from the paper’s own numbers.
Each contradiction between two passages listed here was confirmed by an independent check.
Rated major: it would touch a result — a value a result rests on, reported and recomputed p-values on opposite sides of the significance level, two passages that conflict with no sign which is right, or a cited work retracted before this paper was published.
In the paper
§ Heart rate variability in type 2 diabetes mellitus: A systematic review and meta–analysis > Results > Study designs
“All studies described a prospective cohort design, except one study which was a randomly controlled prospective study [57].”
§ Heart rate variability in type 2 diabetes mellitus: A systematic review and meta–analysis > Discussion > Limitations
“Indeed, most of the studies included were cross–sectional, with different measurement conditions for HRV parameters associated with a high inter and intra–individual variability.”
Rated minor: it would not touch a result — a value no result rests on, a p-value that stays on the same side of the significance level, or a conflict that is clerical, resolved elsewhere in the paper, or outside its own findings.
In the paper
§ Heart rate variability in type 2 diabetes mellitus: A systematic review and meta–analysis > Discussion > Limitations
“We demonstrated that all parameters measuring HRV were significantly decreased in T2DM compared with controls.”
§ Heart rate variability in type 2 diabetes mellitus: A systematic review and meta–analysis > Results > Meta–analyses of HRV values in T2DM
“LF/HF did not differ between groups (effect size = 0.02; 95%CI –0.38 to 0.43; P = 0.914; I2 = 90.1%)”
Rated minor: it would not touch a result — a value no result rests on, a p-value that stays on the same side of the significance level, or a conflict that is clerical, resolved elsewhere in the paper, or outside its own findings.
In the paper
§ Heart rate variability in type 2 diabetes mellitus: A systematic review and meta–analysis > Results > Quality of articles
“Results varied from 52% [59] to 67% [57] for the randomized trials (CONSORT), with a mean score of 59.5%.”
§ Heart rate variability in type 2 diabetes mellitus: A systematic review and meta–analysis > Results > Study designs
“All studies described a prospective cohort design, except one study which was a randomly controlled prospective study [57].”
Citations
Cites
Meta-analysis in clinical trials
DerSimonian, R., & Laird, N. (1986) · Controlled Clinical Trials · doi:10.1016/0197-2456(86)90046-2 · Cited by 39,552
Heart Rate Variability: Standards of Measurement, Physiological Interpretation, and Clinical Use
Electrophysiology, T. F. O. T. E. S. O. C. T. N. A. (1996) · Circulation · doi:10.1161/01.cir.93.5.1043 · Cited by 17,159
Heart rate variability: Standards of measurement, physiological interpretation, and clinical use
Malik, M., Bigger, J. T., Camm, A. J., Kleiger, R. E., Malliani, A., Moss, A. J., & Schwartz, P. J. (1996) · European Heart Journal · doi:10.1093/oxfordjournals.eurheartj.a014868 · Cited by 15,289
Elm, E. V., Altman, D. G., Egger, M., Pocock, S. J., Gøtzsche, P. C., & Vandenbroucke, J. P. (2007) · BMJ · doi:10.1136/bmj.39335.541782.ad · Cited by 10,766
Moher, D., Hopewell, S., Schulz, K. F., Montori, V., Gotzsche, P. C., Devereaux, P. J., Elbourne, D., Egger, M., & Altman, D. G. (2010) · BMJ · doi:10.1136/bmj.c869 · Cited by 8,883
Colberg, S. R., Sigal, R. J., Fernhall, B., Regensteiner, J. G., Blissmer, B. J., Rubin, R. R., Chasan-Taber, L., Albright, A. L., & Braun, B. (2010) · Diabetes Care · doi:10.2337/dc10-9990 · Cited by 1,955
The Value of Cardiovascular Autonomic Function Tests: 10 Years Experience in Diabetes
Ewing, D. J., Martyn, C., Young, R. J., & Clarke, B. F. (1985) · Diabetes Care · doi:10.2337/diacare.8.5.491 · Cited by 1,436
Type 2 diabetes and incidence of cardiovascular diseases: a cohort study in 1.9 million people
Shah, A. D., Langenberg, C., Rapsomaniki, E., Denaxas, S., Pujades-Rodriguez, M., Gale, C. P., Deanfield, J., Smeeth, L., Timmis, A., & Hemingway, H. (2015) · The Lancet Diabetes & Endocrinology · doi:10.1016/s2213-8587(14)70219-0 · Cited by 1,225
Discrepancies between Meta-Analyses and Subsequent Large Randomized, Controlled Trials
LeLorier, J., Grégoire, G., Benhaddad, A. A., Lapierre, J., & Derderian, F. (1997) · New England Journal of Medicine · doi:10.1056/nejm199708213370806 · Cited by 1,164
Research works printed but not linked: 1
- L Boer-Martins, 2012, Leptin and aldosterone in sympathetic activity in resistant hypertension with or without type 2 diabetes, Arq Bras Cardiol, 99, 642
Cited by
Sorted by citations
Atrial Fibrillation and Diabetes Mellitus
Wang, A., Green, J. B., Halperin, J. L., & Piccini, J. P. (2019) · Journal of the American College of Cardiology · doi:10.1016/j.jacc.2019.07.020 · Cited by 419
Diabetic neuropathy: cutting-edge research and future directions
Yang, Y., Zhao, B. T., Wang, Y., Lan, H. H., Liu, X., Hu, Y., & Cao, P. (2025) · Signal Transduction and Targeted Therapy · doi:10.1038/s41392-025-02175-1 · Cited by 320
Cao, R., Azimi, I., Sarhaddi, F., Niela-Vilen, H., Axelin, A., Liljeberg, P., & Rahmani, A. M. (2022) · Journal of Medical Internet Research · doi:10.2196/27487 · Cited by 159
Zheng, T., Chen, Z., Cai, C., Luo, J., & Zhang, X. (2020) · Proceedings of the ACM on Interactive Mobile Wearable and Ubiquitous Technologies · doi:10.1145/3397321 · Cited by 151
A digital biomarker of diabetes from smartphone-based vascular signals
Avram, R., Olgin, J. E., Kuhar, P., Hughes, J. W., Marcus, G. M., Pletcher, M. J., Aschbacher, K., & Tison, G. H. (2020) · Nature Medicine · doi:10.1038/s41591-020-1010-5 · Cited by 136
Metadata
- Authors
- Benichou, T., Pereira, B., Mermillod, M., Tauveron, I., Pfabigan, D., Maqdasy, S., & Dutheil, F.
- Affiliations
- Centre Hospitalier Universitaire de Clermont-Ferrand (FR)
- Centre National de la Recherche Scientifique (FR)
- Peking University (CN)
- Corresponding author
- Dutheil, Frédéric
- ORCID
- Venue
- PLOS ONE
- Publisher
- Public Library of Science (PLoS)
- Published
- 2018-04-02
- Volume
- 13
- Issue
- 4
- Pages
- e0195166
- ISSN
- 1932-6203 (ISSN-L)
- PMC
- PMC5880391
- OpenAlex
- W2888208815
- Cited by
- 419
- References
- 101
- Citations by year
- 2026: 43 · 2025: 63 · 2024: 72 · 2023: 59 · 2022: 66 · 2021: 54 · 2020: 33 · 2019: 23 · 2018: 5
- FWCI
- 5.36
- Type
- journal article
- Language
- en
- Open access
- gold
- doi.org
- Licence
- Locations
- PLoS ONE (publishedVersion, cc-by)
- Europe PMC (PubMed Central) (publishedVersion, cc-by)
- PubMed Central (publishedVersion, cc-by)
- PubMed (publishedVersion)
- HAL (submittedVersion, other-oa)
- DOAJ (DOAJ: Directory of Open Access Journals) (submittedVersion, cc-by-sa)
- Figshare (submittedVersion, cc-by)
- Topics
- Health Sciences › Medicine › Cardiology and Cardiovascular Medicine › Heart Rate Variability and Autonomic Control
- Health Sciences › Medicine › Cardiology and Cardiovascular Medicine › Cardiovascular Function and Risk Factors
- Health Sciences › Medicine › Endocrinology, Diabetes and Metabolism › Diabetes Management and Research
- Keywords
- type 2 diabetes, heart rate variability, cardiac autonomic neuropathy, autonomic dysfunction, sympathetic activity, parasympathetic activity, blood glucose, HbA1c, cardiovascular mortality, Holter electrocardiogram, RR interval, spectral analysis of HRV, autonomic reinnervation
- MeSH terms
- Adult, Aged, Diabetes Mellitus, Type 2, Female, Heart Rate, Humans, Male, Middle Aged, Regression Analysis, Risk Factors, Body Mass Index, Case-Control Studies
About these checks
Registry, retraction, Cites and statistics results are computed, not judged, with one exception: a printed reference that no index lists is read once by a model before it counts as a citation error. Claims are extracted by a model and kept only when their quote appears verbatim in the text; each cited source is then checked, with a model’s help, for whether it says what the claim relies on. Those verdicts can be wrong — read the claim’s quote and the cited source before relying on one.
A language model drew the claims from the paper on 2026-10-10, under version 3 of the claim definition (model deepseek-v4.1-flash, prompt extract-v3).
A second model labelled each claim on 2026-10-10 (model jev-1.13-20260917, definition revision gold-guideline-v0.2).
Statistics and arithmetic are recomputed, not judged.
Confidence bands are shown only for fields calibrated on our annotated test set. None is calibrated yet, so no band is shown.
What counts as a claim ›How we measure confidence ›How we check this ›
Are you an author, or do you see a problem with this page? Request a review
