

The DOI matches its Crossref record; 63 of the 63 references it cites were found in a registry or an index.
Astrocyte senescence promotes glutamate toxicity in cortical neurons
Open accessAbstract
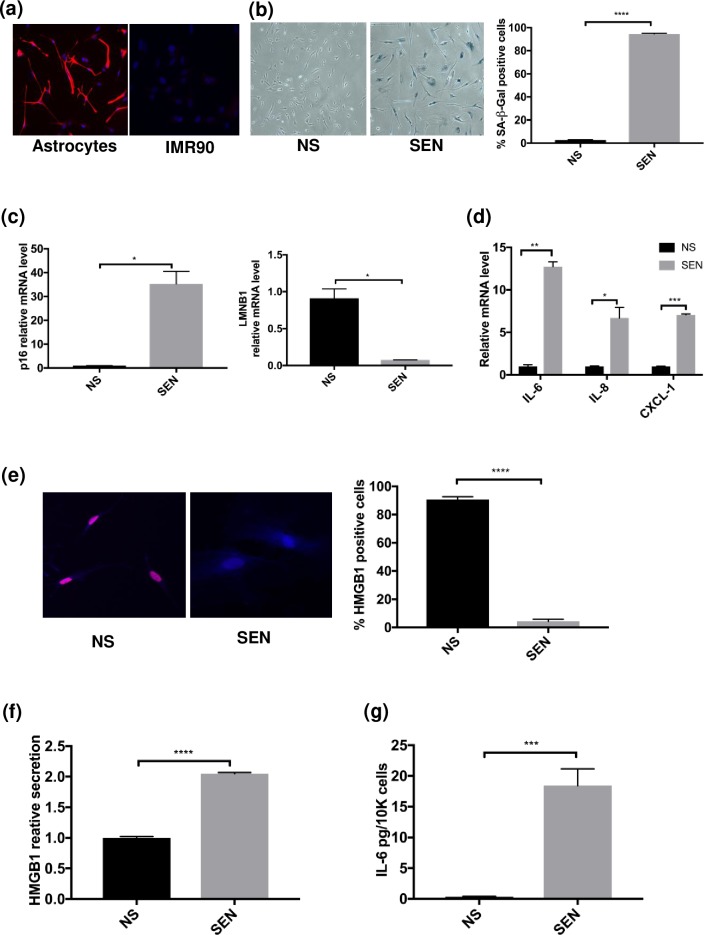
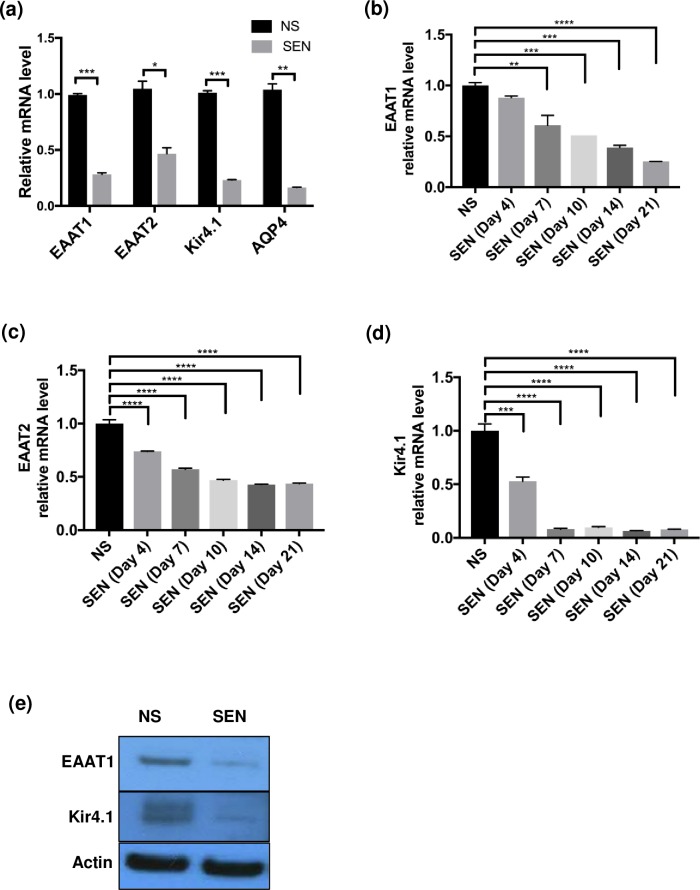
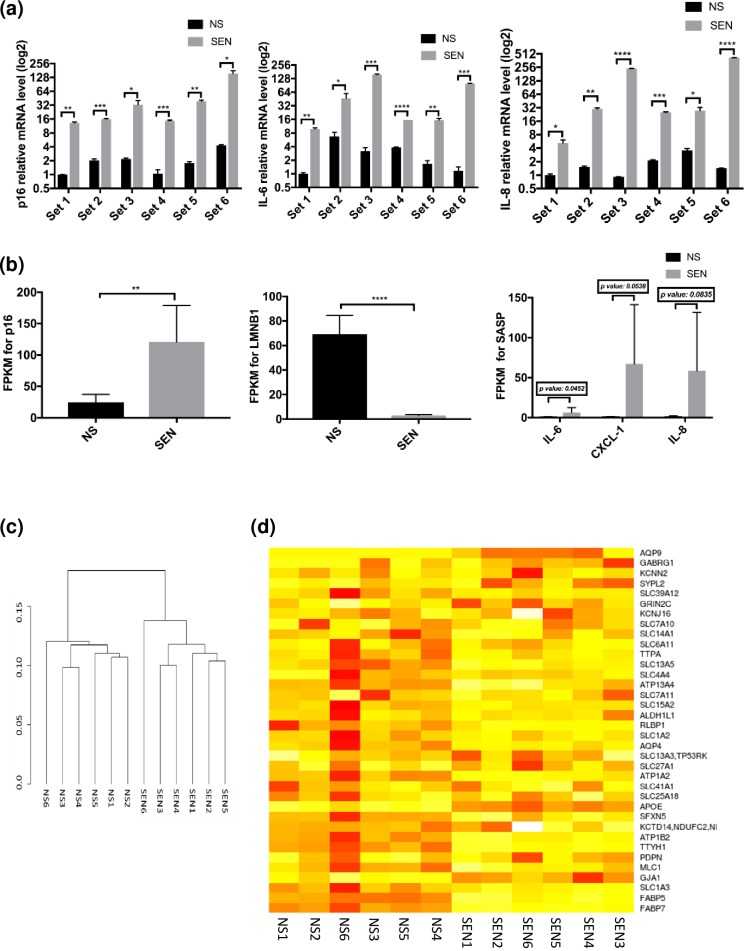
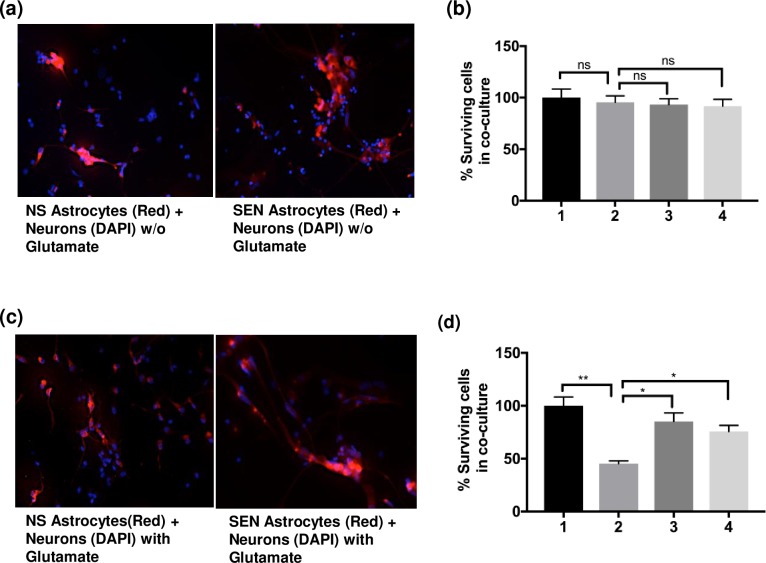
Neurodegeneration is a major age-related pathology. Cognitive decline is characteristic of patients with Alzheimer's and related dementias and cancer patients after chemo- or radio-therapies. A recently emerged driver of these and other age-related pathologies is cellular senescence, a cell fate that entails a permanent cell cycle arrest and pro-inflammatory senescence-associated secretory phenotype (SASP). Although there is a link between inflammation and neurodegenerative diseases, there are many open questions regarding how cellular senescence affects neurodegenerative pathologies. Among the various cell types in the brain, astrocytes are the most abundant. Astrocytes have proliferative capacity and are essential for neuron survival. Here, we investigated the phenotype of primary human astrocytes made senescent by X-irradiation, and identified genes encoding glutamate and potassium transporters as specifically downregulated upon senescence. This down regulation led to neuronal cell death in co-culture assays. Unbiased RNA sequencing of transcripts expressed by non-senescent and senescent astrocytes confirmed that glutamate homeostasis pathway declines upon senescence. Our results suggest a key role for cellular senescence, particularly in astrocytes, in excitotoxicity, which may lead to neurodegeneration including Alzheimer's disease and related dementias.
Overview
The claims and statistics of this paper haven’t been checked yet.
Run the check — free, no account needed. It reads the open-access text and checks the sources it cites.
Integrity signals
Registry
Cites
Statistics
Figures
Verification
Claims the paper makes
The claims and statistics of this paper haven’t been checked yet.
Run the check — free, no account needed. It reads the open-access text and checks the sources it cites.
Claims other papers make about this one
Each is checked against this paper’s own text: does it say what the citing paper says it does?
The source backs part of the claim, not all of it — or backs it for a different population, condition or comparison.
In the citing paper
“Furthermore, primary human astrocytes exposed to X-rays exhibit increased expression of senescence-associated proteins (p16INK4a and Hp1γ) and cytokines associated with SASP, such as IL-1β and IL-6.294–296”
From Inflammation and aging: signaling pathways and intervention therapies (2023) · cites this paper as [295]
Experimental — accuracy not yet measured
Self-check
Percentages, sums and reported differences re-computed from the paper’s own numbers.
The self-check needs the paper’s full text.
Citations
Cites
Trimmomatic: a flexible trimmer for Illumina sequence data
Bolger, A. M., Lohse, M., & Usadel, B. (2014) · Bioinformatics · doi:10.1093/bioinformatics/btu170 · Cited by 65,548
Systematic and integrative analysis of large gene lists using DAVID bioinformatics resources
Huang, D. W., Sherman, B. T., & Lempicki, R. A. (2009) · Nature Protocols · doi:10.1038/nprot.2008.211 · Cited by 35,890
Kim, D., Pertea, G., Trapnell, C., Pimentel, H., Kelley, R., & Salzberg, S. L. (2013) · Genome Biology · doi:10.1186/gb-2013-14-4-r36 · Cited by 12,668
Trapnell, C., Roberts, A., Goff, L. A., Pertea, G. M., Kim, D., Kelley, D. R., Pimentel, H., Salzberg, S. L., Rinn, J. L., & Pachter, L. S. (2012) · Nature Protocols · doi:10.1038/nprot.2012.016 · Cited by 12,145
A biomarker that identifies senescent human cells in culture and in aging skin in vivo.
Dimri, G. P., Lee, X., Basile, G., Acosta, M., Scott, G., Roskelley, C., Medrano, E. E., Linskens, M., Rubelj, I., & Pereira-Smith, O. (1995) · Proceedings of the National Academy of Sciences · doi:10.1073/pnas.92.20.9363 · Cited by 7,477
The senescence-associated secretory phenotype: the dark side of tumor suppression
Coppé, J.-P., Desprez, P.-Y., Krtolica, A., & Campisi, J. (2010) · Annual Review of Pathology: Mechanisms of Disease · doi:10.1146/annurev-pathol-121808-102144 · Cited by 5,206
Self-citationAstrocytes: Biology and pathology
Sofroniew, M. V., & Vinters, H. V. (2010) · Acta Neuropathologica · doi:10.1007/s00401-009-0619-8 · Cited by 5,196
Cellular senescence: when bad things happen to good cells
Campisi, J., & d'Adda di Fagagna, F. (2007) · Nature Reviews Molecular Cell Biology · doi:10.1038/nrm2233 · Cited by 4,441
Self-citationStrittmatter, W. J., Saunders, A. M., Schmechel, D., Pericak-Vance, M., Enghild, J., Salvesen, G. S., & Roses, A. D. (1993) · Proceedings of the National Academy of Sciences · doi:10.1073/pnas.90.5.1977 · Cited by 4,268
The role of senescent cells in ageing
van Deursen, J. M. (2014) · Nature · doi:10.1038/nature13193 · Cited by 2,623
Cited by
Sorted by citations
Inflammation and aging: signaling pathways and intervention therapies
Li, X., Li, C., Zhang, W., Wang, Y., Qian, P., & Huang, H. (2023) · Signal Transduction and Targeted Therapy · doi:10.1038/s41392-023-01502-8 · Cited by 1,443
Hu, Y., Fryatt, G. L., Ghorbani, M., Obst, J., Menassa, D. A., Martin-Estebane, M., Muntslag, T. A. O., Olmos-Alonso, A., Guerrero-Carrasco, M., Thomas, D., et al. (2021) · Cell Reports · doi:10.1016/j.celrep.2021.109228 · Cited by 298
Tauopathies: new perspectives and challenges
Zhang, Y., Wu, K.-M., Yang, L., Dong, Q., & Yu, J.-T. (2022) · Molecular Neurodegeneration · doi:10.1186/s13024-022-00533-z · Cited by 323
Cellular senescence in brain aging
Sikora, E., Bielak-Zmijewska, A., Dudkowska, M., Krzystyniak, A., Mosieniak, G., Wesierska, M., & Wlodarczyk, J. (2021) · Frontiers in Aging Neuroscience · doi:10.3389/fnagi.2021.646924 · Cited by 304
“This downregulation led to neuronal cell death in co-culture assays, suggesting a pivotal role of cellular senescence, particularly in astrocytes, in excitotoxicity, which may lead to neurodegeneration and pathologies such as Alzheimer’s disease and related dementias (Limbad et al., 2020).”
BackgroundGaikwad, S., Puangmalai, N., Bittar, A., Montalbano, M., Garcia, S., McAllen, S., Bhatt, N., Sonawane, M., Sengupta, U., & Kayed, R. (2021) · Cell Reports · doi:10.1016/j.celrep.2021.109419 · Cited by 234
Metadata
- Authors
- Limbad, C., Oron, T. R., Alimirah, F., Davalos, A. R., Tracy, T. E., Gan, L., Desprez, P.-Y., & Campisi, J.
- Affiliations
- Buck Institute for Research on Aging (US)
- Gladstone Institutes (US)
- Corresponding author
- Campisi, Judith
- Venue
- PLOS ONE
- Publisher
- Public Library of Science (PLoS)
- Published
- 2020-01-16
- Volume
- 15
- Issue
- 1
- Pages
- e0227887
- ISSN
- 1932-6203 (ISSN-L)
- PMC
- PMC6964973
- OpenAlex
- W2999084078
- Cited by
- 183
- References
- 63
- Citations by year
- 2026: 18 · 2025: 26 · 2024: 30 · 2023: 26 · 2022: 36 · 2021: 36 · 2020: 11
- FWCI
- 16.39
- Type
- journal article
- Language
- en
- Open access
- gold
- doi.org
- Licence
- Locations
- PLoS ONE (publishedVersion, cc-by)
- Europe PMC (PubMed Central) (publishedVersion, cc-by)
- PubMed Central (publishedVersion, cc-by)
- PubMed (publishedVersion)
- OSTI OAI (U.S. Department of Energy Office of Scientific and Technical Information) (submittedVersion)
- DOAJ (DOAJ: Directory of Open Access Journals) (submittedVersion, cc-by-sa)
- eScholarship (California Digital Library) (submittedVersion)
- Figshare (submittedVersion, cc-by)
- Funders
- National Institute on Aging (AG009909, AG017242)
- Topics
- Life Sciences › Biochemistry, Genetics and Molecular Biology › Cell Biology › Telomeres, Telomerase, and Senescence
- Life Sciences › Neuroscience › Neurology › Neuroinflammation and Neurodegeneration Mechanisms
- Life Sciences › Biochemistry, Genetics and Molecular Biology › Aging › Genetics, Aging, and Longevity in Model Organisms
- Keywords
- astrocyte senescence, cellular senescence, glutamate excitotoxicity, excitotoxicity, glutamate transporters, potassium transporters, glutamate homeostasis, neurodegeneration, Alzheimer's disease, senescence-associated secretory phenotype, X-ray irradiation, cortical neurons, neuronal cell death
- MeSH terms
- Alzheimer Disease, Astrocytes, Brain, Gene Expression Regulation, Humans, Nerve Degeneration, Neurons, X-Rays, Cellular Senescence, Glutamic Acid, Amino Acid Transport System X-AG, Cell Cycle Checkpoints, Primary Cell Culture
About these checks
Registry, retraction, Cites and statistics results are computed, not judged, with one exception: a printed reference that no index lists is read once by a model before it counts as a citation error. Claims are extracted by a model and kept only when their quote appears verbatim in the text; each cited source is then checked, with a model’s help, for whether it says what the claim relies on. Those verdicts can be wrong — read the claim’s quote and the cited source before relying on one.
Statistics and arithmetic are recomputed, not judged.
Confidence bands are shown only for fields calibrated on our annotated test set. None is calibrated yet, so no band is shown.
What counts as a claim ›How we measure confidence ›How we check this ›
Are you an author, or do you see a problem with this page? Request a review
