

The DOI matches its Crossref record; 103 of the 104 references it cites were found in a registry or an index.
Codon and amino acid content are associated with mRNA stability in mammalian cells
Open accessAbstract
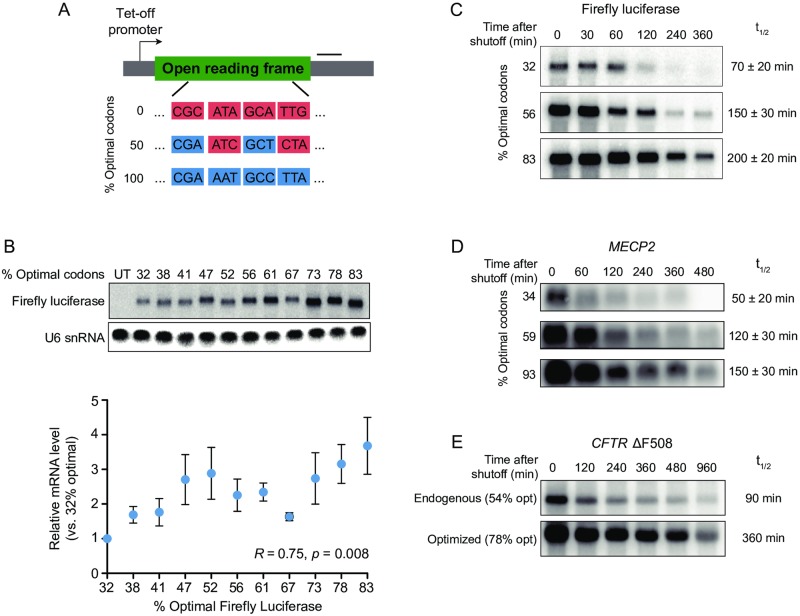
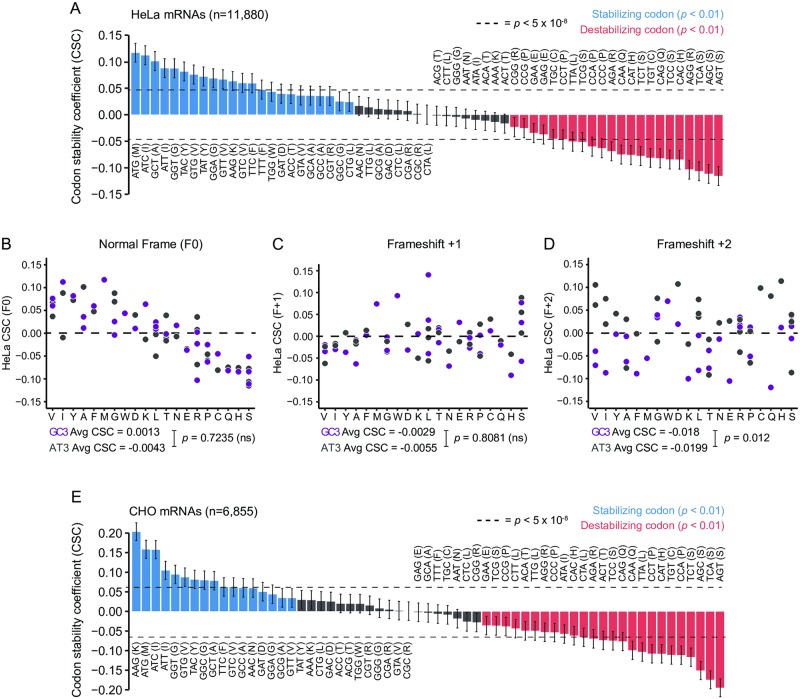
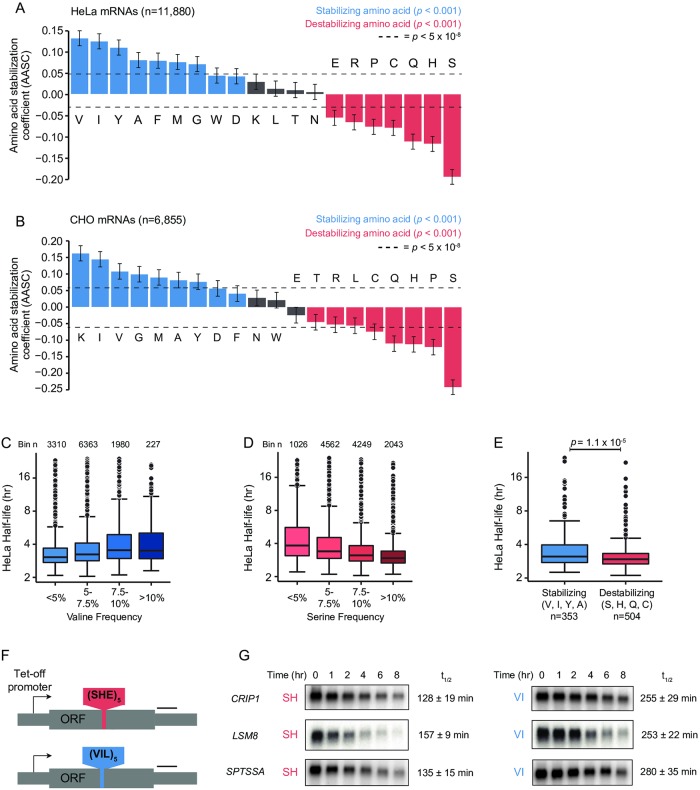
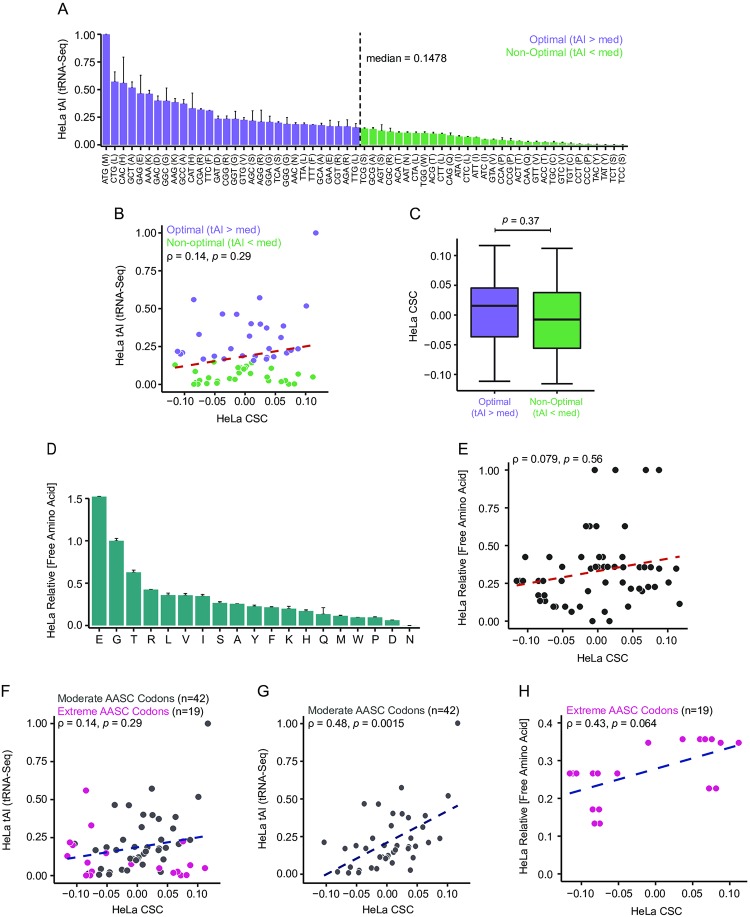
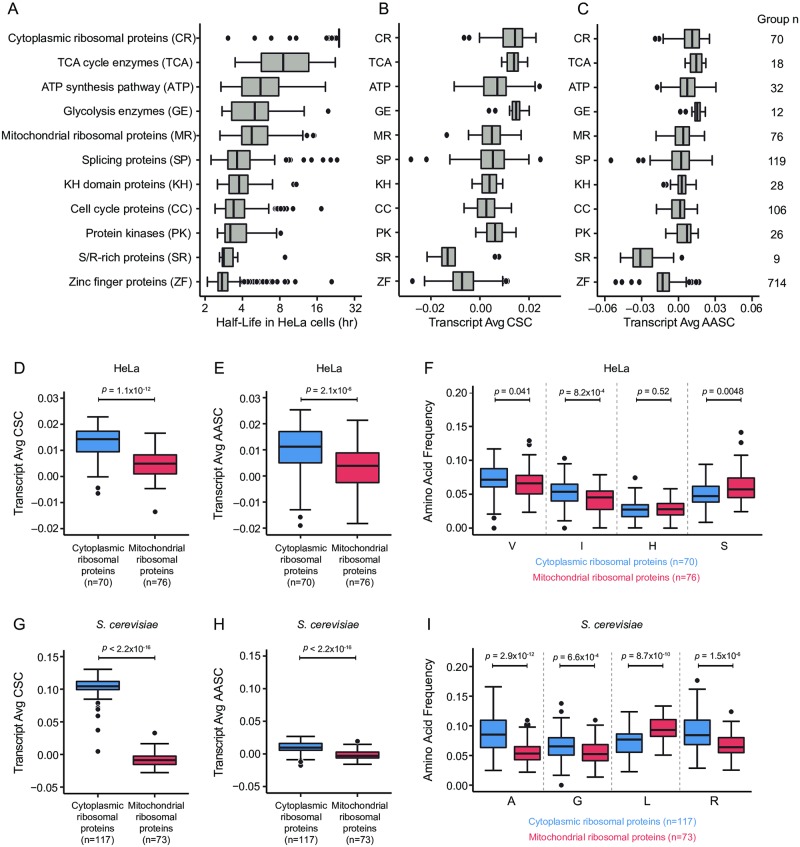
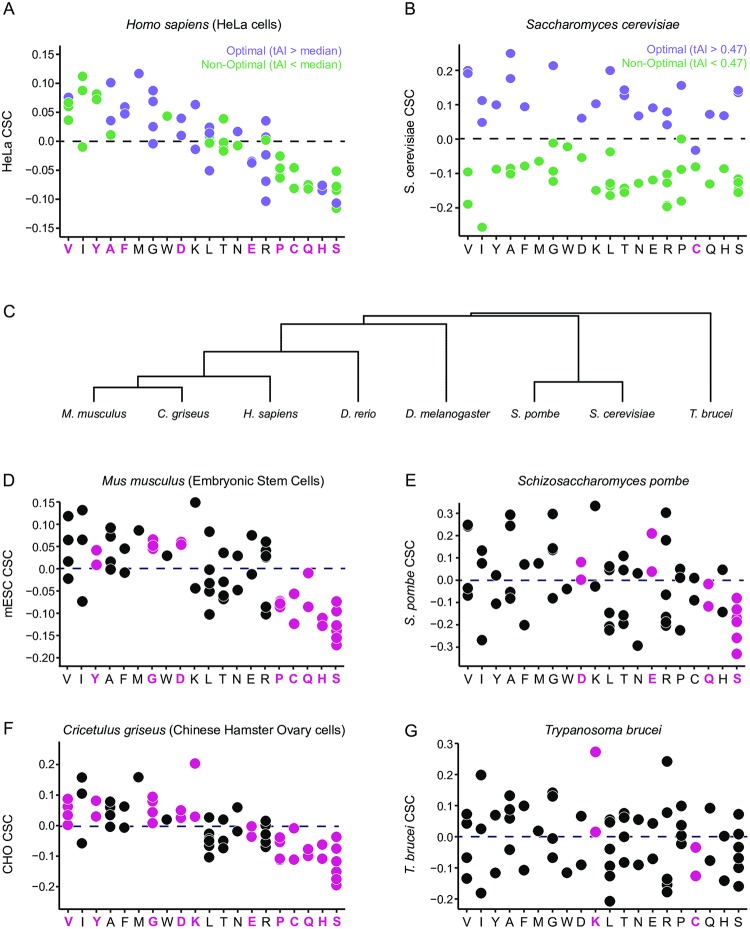
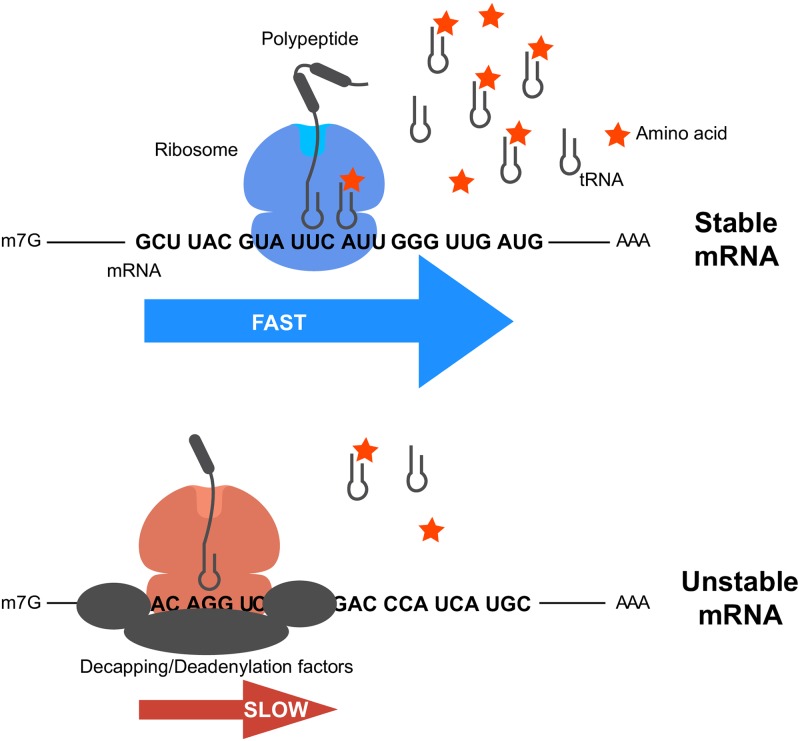
Messenger RNA (mRNA) degradation plays a critical role in regulating transcript levels in the cell and is a major control point for modulating gene expression. In yeast and other model organisms, codon identity is a powerful determinant of transcript stability, contributing broadly to impact half-lives. General principles governing mRNA stability are poorly understood in mammalian systems. Importantly, however, the degradation machinery is highly conserved, thus it seems logical that mammalian transcript half-lives would also be strongly influenced by coding determinants. Herein we characterize the contribution of coding sequence towards mRNA decay in human and Chinese Hamster Ovary cells. In agreement with previous studies, we observed that synonymous codon usage impacts mRNA stability in mammalian cells. Surprisingly, however, we also observe that the amino acid content of a gene is an additional determinant correlating with transcript stability. The impact of codon and amino acid identity on mRNA decay appears to be associated with underlying tRNA and intracellular amino acid concentrations. Accordingly, genes of similar physiological function appear to coordinate their mRNA stabilities in part through codon and amino acid content. Together, these results raise the possibility that intracellular tRNA and amino acid levels interplay to mediate coupling between translational elongation and mRNA degradation rate in mammals.
Overview
The claims and statistics of this paper haven’t been checked yet.
Run the check — free, no account needed. It reads the open-access text and checks the sources it cites.
Integrity signals
Registry
Cites
Statistics
Figures
Verification
Claims the paper makes
The claims and statistics of this paper haven’t been checked yet.
Run the check — free, no account needed. It reads the open-access text and checks the sources it cites.
Claims other papers make about this one
Each is checked against this paper’s own text: does it say what the citing paper says it does?
The cited source says what the claim attributes to it.
In the citing paper
“Prior work has demonstrated strong relationships between codon usage and mRNA half-life23,78.”
From Predicting RNA-seq coverage from DNA sequence as a unifying model of gene regulation (2025) · cites this paper as [78]
The check wasn’t confident either way, so it gives no verdict — never disputed.
In the citing paper
“Although we generally do not find determinants of mRNA half-life in the 3′ UTR attributions, we do observe a correlation between codon-aggregated gradient saliencies of gene exon coverage and MPRA measurements from a previous publication78 (Pearson’ R = 0.59) (Supplementary Fig. 11a).”
From Predicting RNA-seq coverage from DNA sequence as a unifying model of gene regulation (2025) · cites this paper as [78]
Experimental — accuracy not yet measured
Self-check
Percentages, sums and reported differences re-computed from the paper’s own numbers.
The self-check needs the paper’s full text.
Citations
Cites
R: A Language and Environment for Statistical Computing
R Core Team (2000) · doi:10.32614/r.manuals · Cited by 355,893
Transcript-level expression analysis of RNA-seq experiments with HISAT, StringTie and Ballgown
Pertea, M., Kim, D., Pertea, G. M., Leek, J. T., & Salzberg, S. L. (2016) · Nature Protocols · doi:10.1038/nprot.2016.095 · Cited by 6,819
Global quantification of mammalian gene expression control
Schwanhäusser, B., Busse, D., Li, N., Dittmar, G., Schuchhardt, J., Wolf, J., Chen, W., & Selbach, M. (2011) · Nature · doi:10.1038/nature10098 · Cited by 6,566
Interactive Tree Of Life (iTOL) v4: recent updates and new developments
Letunić, I., & Peer Bork, B. (2019) · Nucleic Acids Research · doi:10.1093/nar/gkz239 · Cited by 5,988
Tight control of gene expression in mammalian cells by tetracycline-responsive promoters.
Gossen, M., & Bujard, H. (1992) · Proceedings of the National Academy of Sciences · doi:10.1073/pnas.89.12.5547 · Cited by 4,943 · cited 1×
“…test whether changes in mRNA levels reflect changes in stability, we shut off transcription of reporter mRNAs by doxy-cycline treatment in HEK293 Tet-off cells, which express a tetracycline-regulated transcription activator that is inactive in the presence of tetracycline or doxycycline [50].”
Liao, Y., Smyth, G. K., & Shi, W. (2019) · Nucleic Acids Research · doi:10.1093/nar/gkz114 · Cited by 2,927
Post-transcriptional gene regulation by mRNA modifications
Zhao, B. S., Roundtree, I. A., & He, C. (2016) · Nature Reviews Molecular Cell Biology · doi:10.1038/nrm.2016.132 · Cited by 2,469
MODOMICS: a database of RNA modification pathways. 2017 update
Boccaletto, P., Machnicka, M. A., Purta, E., Piątkowski, P., Bagiński, B., Wirecki, T. K., de Crécy‐Lagard, V., Ross, R. L., Limbach, P. A., Kötter, A., et al. (2017) · Nucleic Acids Research · doi:10.1093/nar/gkx1030 · Cited by 1,767
Serine, glycine and one-carbon units: cancer metabolism in full circle
Locasale, J. W. (2013) · Nature reviews. Cancer · doi:10.1038/nrc3557 · Cited by 1,727
The highways and byways of mRNA decay
Garneau, N. L., Wilusz, J., & Wilusz, C. J. (2007) · Nature Reviews Molecular Cell Biology · doi:10.1038/nrm2104 · Cited by 1,294
Cited by
Sorted by citations
Roles of mRNA poly(A) tails in regulation of eukaryotic gene expression
Passmore, L. A., & Coller, J. (2021) · Nature Reviews Molecular Cell Biology · doi:10.1038/s41580-021-00417-y · Cited by 590
Self-citationPredicting RNA-seq coverage from DNA sequence as a unifying model of gene regulation
Linder, J., Srivastava, D., Yuan, H., Agarwal, V., & Kelley, D. R. (2025) · Nature Genetics · doi:10.1038/s41588-024-02053-6 · Cited by 265
Theoretical basis for stabilizing messenger RNA through secondary structure design
Wayment-Steele, H. K., Kim, D. S., Choe, C. A., Nicol, J. J., Wellington-Oguri, R., Watkins, A. M., Parra Sperberg, R. A., Huang, P.-S., Participants, E., & Das, R. (2021) · Nucleic Acids Research · doi:10.1093/nar/gkab764 · Cited by 197
Direct epitranscriptomic regulation of mammalian translation initiation through N4-acetylcytidine
Arango, D., Sturgill, D. M., Yang, R., Kanai, T., Bauer, P., Roy, J., Wang, Z., Hosogane, M., Schiffers, S., & Oberdoerffer, S. (2022) · Molecular Cell · doi:10.1016/j.molcel.2022.05.016 · Cited by 175
The genetic and biochemical determinants of mRNA degradation rates in mammals
Agarwal, V., & Kelley, D. R. (2022) · Genome Biology · doi:10.1186/s13059-022-02811-x · Cited by 155
Ribosome states signal RNA quality control
D’Orazio, K. N., & Green, R. (2021) · Molecular Cell · doi:10.1016/j.molcel.2021.02.022 · Cited by 147
Tailor made: the art of therapeutic mRNA design
Metkar, M., Pepin, C. S., & Moore, M. J. (2023) · Nature Reviews Drug Discovery · doi:10.1038/s41573-023-00827-x · Cited by 158
Translation and mRNA Stability Control
Wu, Q., & Bazzini, A. (2023) · Annual Review of Biochemistry · doi:10.1146/annurev-biochem-052621-091808 · Cited by 120
Regulation of translation by site-specific ribosomal RNA methylation
Jansson, M., Häfner, S. J., Altinel, K., Tehler, D., Krogh, N., Jakobsen, E., Andersen, J. V., Andersen, K. L., Schoof, E. M., Ménard, P., et al. (2021) · Nature Structural & Molecular Biology · doi:10.1038/s41594-021-00669-4 · Cited by 117
Ribosome dynamics and mRNA turnover, a complex relationship under constant cellular scrutiny
Morris, C., Cluet, D., & Ricci, E. P. (2021) · Wiley Interdisciplinary Reviews - RNA · doi:10.1002/wrna.1658 · Cited by 82
iCodon customizes gene expression based on the codon composition
Diez, M., Medina-Muñoz, S. G., Castellano, L. A., Pescador, G. D. S., Wu, Q., & Bazzini, A. (2022) · Scientific Reports · doi:10.1038/s41598-022-15526-7 · Cited by 71
Natural Selection Shapes Codon Usage in the Human Genome
Dhindsa, R. S., Copeland, B. R., Mustoe, A. M., & Goldstein, D. B. (2020) · The American Journal of Human Genetics · doi:10.1016/j.ajhg.2020.05.011 · Cited by 74
Müller, M. B. D., Kasturi, P., Jayaraj, G. G., & Hartl, F. U. (2023) · Cell · doi:10.1016/j.cell.2023.05.035 · Cited by 83
Bicknell, A. A., Reid, D. W., Licata, M. C., Jones, A. K., Cheng, Y. M., Li, M., Hsiao, C. J., Pepin, C. S., Metkar, M., Levdansky, Y., et al. (2024) · Cell Reports · doi:10.1016/j.celrep.2024.114098 · Cited by 68
Specific recognition and ubiquitination of translating ribosomes by mammalian CCR4–NOT
Absmeier, E., Chandrasekaran, V., O’Reilly, F. J., Stowell, J. A. W., Rappsilber, J., & Passmore, L. A. (2023) · Nature Structural & Molecular Biology · doi:10.1038/s41594-023-01075-8 · Cited by 63
The effects of codon bias and optimality on mRNA and protein regulation
Hia, F., & Takeuchi, O. (2020) · Cellular and Molecular Life Sciences · doi:10.1007/s00018-020-03685-7 · Cited by 61
Specific tRNAs promote mRNA decay by recruiting the CCR4-NOT complex to translating ribosomes
Zhu, X., Cruz, V. E., Zhang, H., Erzberger, J. P., & Mendell, J. T. (2024) · Science · doi:10.1126/science.adq8587 · Cited by 60
FMRP links optimal codons to mRNA stability in neurons
Shu, H., Donnard, E. R., Liu, B., Jung, S., Wang, R., & Richter, J. D. (2020) · Proceedings of the National Academy of Sciences · doi:10.1073/pnas.2009161117 · Cited by 60
Synonymous codon usage regulates translation initiation
Barrington, C. L., Galindo, G., Koch, A., Horton, E. R., Morrison, E. J., Tisa, S., Stasevich, T. J., & Rissland, O. S. (2023) · Cell Reports · doi:10.1016/j.celrep.2023.113413 · Cited by 64
The Ongoing Quest to Crack the Genetic Code for Protein Production
Nieuwkoop, T., Finger‐Bou, M., John van der, O. O. S. T., & Claassens, N. J. (2020) · Molecular Cell · doi:10.1016/j.molcel.2020.09.014 · Cited by 51
Predicting the translation efficiency of messenger RNA in mammalian cells
Zheng, D., Persyn, L., Wang, J., Liu, Y., Ulloa-Montoya, F., Cenik, C., & Agarwal, V. (2026) · Nature Biotechnology · doi:10.1038/s41587-025-02712-x · Cited by 52
Cell cycle-linked vacuolar pH dynamics regulate amino acid homeostasis and cell growth
Okreglak, V., Ling, R., Ingaramo, M., Thayer, N. H., Millett-Sikking, A., & Gottschling, D. E. (2023) · Nature Metabolism · doi:10.1038/s42255-023-00872-1 · Cited by 41
Wieder, N., D’Souza, E. N., Martin-Geary, A. C., Lassen, F. H., Talbot-Martin, J., Fernandes, M., Chothani, S. P., Rackham, O. J. L., Schäfer, S., Aspden, J. L., et al. (2024) · Genome biology · doi:10.1186/s13059-024-03248-0 · Cited by 38
Neelagandan, N., Lamberti, I., Carvalho, H. J. F., Gobet, C., & Naef, F. (2020) · Open Biology · doi:10.1098/rsob.200292 · Cited by 41
Ribosome slowdown triggers codon‐mediated mRNA decay independently of ribosome quality control
Mishima, Y., Han, P., Ishibashi, K., Kimura, S., & Iwasaki, S. (2022) · The EMBO Journal · doi:10.15252/embj.2021109256 · Cited by 35
Mo, O., Zhang, Z., Cheng, X., Zhu, L., Zhang, K., Zhang, N., Li, J., Li, H., Fan, S., Li, X., et al. (2025) · Nucleic Acids Research · doi:10.1093/nar/gkaf410 · Cited by 37
Gillen, S. L., Giacomelli, C., Hodge, K., Zanivan, S. R., Bushell, M., & Wilczynska, A. (2021) · Genome biology · doi:10.1186/s13059-021-02494-w · Cited by 34
Inhibition of pyrimidine biosynthesis targets protein translation in acute myeloid leukemia
So, J., Lewis, A. C., Smith, L. K., Stanley, K. L., Franich, R. L., Yoannidis, D., Pijpers, L., Domínguez, P. M., Hogg, S. J., Vervoort, S. J., et al. (2022) · EMBO Molecular Medicine · doi:10.15252/emmm.202115203 · Cited by 30
A nascent peptide code for translational control of mRNA stability in human cells
Burke, P. C., Park, H., & Subramaniam, A. R. (2022) · Nature Communications · doi:10.1038/s41467-022-34664-0 · Cited by 31
Gillen, S. L., Waldron, J. A., & Bushell, M. (2021) · Oncogene · doi:10.1038/s41388-021-02022-x · Cited by 31
Álvarez‐García, G., Davidson, R. K., Jokelainen, P., Klevar, S., Spano, F., & Seeber, F. (2021) · Microorganisms · doi:10.3390/microorganisms9112346 · Cited by 32
Genes enriched in A/T-ending codons are co-regulated and conserved across mammals
Benisty, H., Hernandez‐Alias, X., Weber, M. L., Anglada-Girotto, M., Mantica, F., Radusky, L., Senger, G., Calvet, F., Weghorn, D., Irimia, M., et al. (2023) · Cell Systems · doi:10.1016/j.cels.2023.02.002 · Cited by 25
Oligodendrocyte differentiation alters tRNA modifications and codon optimality-mediated mRNA decay
Martin, S., Allan, K. C., Pinkard, O. W., Sweet, T. J., Tesar, P. J., & Coller, J. (2022) · Nature Communications · doi:10.1038/s41467-022-32766-3 · Cited by 25
Self-citationHuman DDX6 regulates translation and decay of inefficiently translated mRNAs
Weber, R., & Chang, C.-T. (2024) · eLife · doi:10.7554/elife.92426 · Cited by 23
Munk, M., Villalobo, E., Villalobo, A., & Berchtold, M. W. (2022) · Cell Calcium · doi:10.1016/j.ceca.2022.102656 · Cited by 23
Dengue virus preferentially uses human and mosquito non-optimal codons
Castellano, L. A., McNamara, R. J., Pallarés, H. M., Gamarnik, A. V., Alvarez, D. E., & Bazzini, A. (2024) · Molecular Systems Biology · doi:10.1038/s44320-024-00052-7 · Cited by 20
mRNA-LM: full-length integrated SLM for mRNA analysis
Li, S., Noroozizadeh, S., Moayedpour, S., Kogler-Anele, L., Xue, Z., Zheng, D., Montoya, F. U., Agarwal, V., Bar‐Joseph, Z., & Jäger, S. (2025) · Nucleic Acids Research · doi:10.1093/nar/gkaf044 · Cited by 18
Ying, B., Kawabe, Y., Zheng, F., Amamoto, Y., & Kamihira, M. (2023) · Cells · doi:10.3390/cells12222638 · Cited by 14
mRNA stability fine-tunes gene expression in the developing cortex to control neurogenesis
Serdar, L. D., Egol, J. R., Lackford, B., Bennett, B. D., Hu, G., & Silver, D. L. (2025) · PLOS Biology · doi:10.1371/journal.pbio.3003031 · Cited by 14
Mitotic checkpoint gene expression is tuned by codon usage bias
Esposito, E., Weidemann, D. E., Rogers, J. M., Morton, C. M., Baybay, E. K., Chen, J., & Hauf, S. (2022) · The EMBO Journal · doi:10.15252/embj.2021107896 · Cited by 13
Dysregulated amino acid metabolism in heart failure: role of gut microbiome
Tang, W. H. W. (2022) · Current Opinion in Clinical Nutrition & Metabolic Care · doi:10.1097/mco.0000000000000897 · Cited by 14
Specific recognition and ubiquitination of slow-moving ribosomes by human CCR4-NOTPreprint
Absmeier, E., Chandrasekaran, V., O’Reilly, F. J., Stowell, J. A. W., Rappsilber, J., & Passmore, L. A. (2022) · bioRxiv (Cold Spring Harbor Laboratory) · doi:10.1101/2022.07.24.501325 · Cited by 14
Gröger, V., Wieland, L., Naumann, M., Meinecke, A.-C., Meinhardt, B., Roßner, S., Ihling, C. H., Emmer, A., Staege, M. S., & Cynis, H. (2020) · International Journal of Molecular Sciences · doi:10.3390/ijms21217855 · Cited by 13
Arginine Depletion in Human Cancers
Nelakurti, D. D., Rossetti, T., Husbands, A. Y., & Petreaca, R. C. (2021) · Cancers · doi:10.3390/cancers13246274 · Cited by 14
The dynamics and functional impact of tRNA repertoires during early embryogenesis in zebrafish
Reimão-Pinto, M. M., Behrens, A., Forcelloni, S., Fröhlich, K., Shunji, K. A. Y. A., & Nedialkova, D. D. (2024) · The EMBO Journal · doi:10.1038/s44318-024-00265-4 · Cited by 11
Torkzaban, B., Zhu, Y., Lopez, C., Alexander, J., Ma, J., Sun, Y., Maschhoff, K. R., Hu, W., Jacob, M. H., Lin, D., et al. (2025) · Molecular Therapy — Nucleic Acids · doi:10.1016/j.omtn.2025.102453 · Cited by 11
Self-citationBerlanga, J. J., Matamoros, T., Rodríguez‐Pulido, M., Sáiz, M., Bayón, M. N., Toribio, R., & Ventoso, I. (2025) · Nucleic Acids Research · doi:10.1093/nar/gkaf261 · Cited by 11
Mercier, B. C., Labaronne, E., Cluet, D., Guiguettaz, L., Fontrodona, N., Bicknell, A. A., Corbin, A., Wencker, M., Aubé, F., Modolo, L., et al. (2024) · Genome Research · doi:10.1101/gr.277863.123 · Cited by 11
Cubar: a versatile package for codon usage bias analysis in R
Liu, M., Zi, B., Zhang, H., & Zhang, H. (2025) · Genetics · doi:10.1093/genetics/iyaf191 · Cited by 10
Translation elongation inhibitors stabilize select short-lived transcripts
Rosa-Mercado, N. A., Buskirk, A. R., & Green, R. (2024) · RNA · doi:10.1261/rna.080138.124 · Cited by 10
Codon Usage Bias in Human RNA Viruses and Its Impact on Viral Translation, Fitness, and Evolution
Ventoso, I. (2025) · Viruses · doi:10.3390/v17091218 · Cited by 11
Identification of a cleaved aberrant RNA associated with the initiation of transgene silencing
Kramer, M. C., Ratnayake, T. S., Edwards, S. A., Lowrey, H., Klaas, G., Sidorenko, L. V., Rowan, B. A., Michelmore, R. W., Meyers, B. C., & Slotkin, R. K. (2025) · The Plant Cell · doi:10.1093/plcell/koaf219 · Cited by 10
Sotelo-Ramírez, C. E., Camarena, B., Sanabrais‐Jiménez, M. A., Zaragoza-Hoyos, J. U., Ordoñez-Martínez, B., Escamilla-Orozco, R. I., & Gómez‐González, B. (2023) · Neuropsychiatric Disease and Treatment · doi:10.2147/ndt.s420952 · Cited by 9
Ribosomes modulate transcriptome abundance via generalized frameshift and out-of-frame mRNA decay
Zhang, Y., Nersisyan, L., Fürst, E., Alexopoulos, I., Santolaria, C., Huch, S., Bassot, C., Garré, E., Sunnerhagen, P., Piazza, I., et al. (2025) · Molecular Cell · doi:10.1016/j.molcel.2025.04.022 · Cited by 11
Li, Q., Vetter, L., Veith, Y., Christ, E., Végvári, Á., Sahin, C., Ribacke, U., Wahlgren, M., Ankarklev, J., Larsson, O., et al. (2024) · iScience · doi:10.1016/j.isci.2024.111167 · Cited by 9
Human DHX29 detects nonoptimal codon usage to regulate mRNA stability
Hia, F., Wu, Y., Yoshinaga, M., Goto‐Ito, S., Iwasaki, W., Imami, K., Toh, H., Han, P., Cai, T., Ohira, T., et al. (2026) · Science · doi:10.1126/science.adw0288 · Cited by 9
Expression of a large coding sequence: Gene therapy vectors for Ataxia Telangiectasia
Hirch, T., Brander, N., Schenk, F., Pollmann, S., Reichenbach, J., Schubert, R., & Modlich, U. (2023) · Scientific Reports · doi:10.1038/s41598-023-46332-4 · Cited by 8
Mutability and hypermutation antagonize immunoglobulin codon optimality
McGrath, J. J. C., Park, J., Troxell, C. A., Chervin, J. C., Li, L., Kent, J. R., Changrob, S., Fu, Y., Huang, M., Zheng, N., et al. (2024) · Molecular Cell · doi:10.1016/j.molcel.2024.11.033 · Cited by 7
Kulkarni, S. D., Smith, C. B., Akinniyi, O. T., Giardine, B. M., Keller, C. A., Arnaoutov, A., & Reese, J. C. (2025) · Journal of Biological Chemistry · doi:10.1016/j.jbc.2025.110862 · Cited by 6
Human DDX6 regulates translation and decay of inefficiently translated mRNAs
Weber, R., & Chang, C.-T. (2024) · eLife · doi:10.7554/elife.92426.3 · Cited by 6
Uncovering the isoform-resolution kinetic landscape of nonsense-mediated mRNA decay with EZbakR
Mabin, J. W., Vock, I. W., Machyna, M., Haque, N., Thakran, P., Zhang, A., Rai, G., Leibler, I. N.-M., Inglese, J., Simon, M. D., et al. (2026) · Genome biology · doi:10.1186/s13059-026-04204-w · Cited by 6
The Making and Breaking of RNAs: Dynamics of Rhythmic RNA Expression in Mammals
Unruh, B. A., & Kojima, S. (2020) · Journal of Biological Rhythms · doi:10.1177/0748730420957498 · Cited by 6
Chen, K. Y., Park, H., & Subramaniam, A. R. (2024) · Nucleic Acids Research · doi:10.1093/nar/gkae285 · Cited by 7
The stability landscape of mRNA vaccines: challenges and mitigation strategies
Zhong, L., Tao, L., Zhai, Z., Liao, L., Shi, C., Yao, S., & Liu, X. (2026) · Vaccine · doi:10.1016/j.vaccine.2026.128515 · Cited by 6
Wieder, N., D’Souza, E. N., Martin-Geary, A. C., Lassen, F. H., Talbot-Martin, J., Fernandes, M., Chothani, S. P., Rackham, O. J. L., Schäfer, S., Aspden, J. L., et al. (2023) · bioRxiv (Cold Spring Harbor Laboratory) · doi:10.1101/2023.05.15.540809 · Cited by 5
Accelerate the Highly Efficient Development of mRNA Vaccines Through Advanced Computational Methods
Gu, R., Si, D., Lei, D., Xie, X., Li, Y., & Wen, H. (2026) · MedComm · doi:10.1002/mco2.70612 · Cited by 6
Molecular protocol to develop β-carotene-biofortified rice events via molecular optimization
Lee, Y. J., Jung, Y. J., Kim, J. H., Jeong, Y. S., Ku, H.-K., Kim, B., Kim, Y. J., Kim, J. K., Kim, Y. S., Kim, J., et al. (2024) · Plant Physiology and Biochemistry · doi:10.1016/j.plaphy.2024.109051 · Cited by 4
Nuclear effects play an important role in determining codon usage-dependent human gene expression
Garg, R., Xie, P., Duan, J., Liu, H., & Liu, Y. (2025) · Nature Communications · doi:10.1038/s41467-025-65907-5 · Cited by 4
Sotelo-Ramírez, C. E., Valdés‐Tovar, M., Zaragoza-Hoyos, J. U., Ortíz‐López, L., Argueta, J., Rosel-Vales, M., Miranda-Labra, R. U., & Camarena, B. (2025) · International Journal of Molecular Sciences · doi:10.3390/ijms26030926 · Cited by 4
FMRP Links Optimal Codons to mRNA stability in NeuronsPreprint
Shu, H., Donnard, E. R., Liu, B., Wang, R., & Richter, J. D. (2019) · bioRxiv (Cold Spring Harbor Laboratory) · doi:10.1101/801449 · Cited by 5
Ojuederie, O. B., Akpojotor, U. L., Adeniji, A. A., Ojuederie, T. C., Popoola, J. O., & Babalola, O. O. (2025) · Biotechnology Reports · doi:10.1016/j.btre.2025.e00918 · Cited by 3
Dilrangi, K. H., Aretakis, J. R., Vaidya, K., Al-Husini, N., Muthunayake, N. S., Kim, S., & Schrader, J. M. (2025) · Cell Reports · doi:10.1016/j.celrep.2025.116691 · Cited by 3
How the Competition for Cysteine May Promote Infection of SARS-CoV-2 by Triggering Oxidative Stress
Vernone, A., Bergandi, L., Pernice, S., Pescarmona, G., & Silvagno, F. (2023) · Antioxidants · doi:10.3390/antiox12020483 · Cited by 3
Sterken, M. G., Wilbers, R. H. P., Prins, P., Snoek, B. L., Giambaşu, G. M., Slootweg, E. J., Holterman, M., Helder, J., Kammenga, J. E., Schots, A., et al. (2020) · bioRxiv (Cold Spring Harbor Laboratory) · doi:10.1101/2020.11.23.393322 · Cited by 3
Camarena, B., Sanabrais‐Jiménez, M. A., Sotelo-Ramírez, C. E., Pavón, J. J., Morales-Cedillo, I. P., Ortega‐Ortíz, H., & Palars, C. B. (2025) · Pharmacological Reports · doi:10.1007/s43440-025-00771-0 · Cited by 2
Essentiality and dynamic expression of the human tRNA pool during viral infection
Aharon-Hefetz, N., Schwartz, M., Aharon, E., Stern‐Ginossar, N., Dahan, O., & Pilpel, Y. (2026) · Molecular Systems Biology · doi:10.1038/s44320-025-00181-7 · Cited by 2
Mercier, B. C., Labaronne, E., Cluet, D., Bicknell, A. A., Corbin, A., Guiguettaz, L., Aubé, F., Modolo, L., Auboeuf, D., Moore, M. J., et al. (2020) · bioRxiv (Cold Spring Harbor Laboratory) · doi:10.1101/2020.10.16.341222 · Cited by 2
Kulkarni, S. D., Morrissey, A., Sebastian, A., Giardine, B. M., Smith, C., Akinniyi, O. T., Keller, C. A., Arnaoutov, A., Albert, I. U., Mahony, S., et al. (2024) · bioRxiv (Cold Spring Harbor Laboratory) · doi:10.1101/2024.09.10.612038 · Cited by 2
A Unified Framework for Model-Informed and Agentic RNA DesignPreprint
Riley, A. T., Vlasity, M., Becicka, W. M., Huang, J., Pang, S., Wong, W. W., Grinstaff, M. W., & Green, A. A. (2025) · bioRxiv (Cold Spring Harbor Laboratory) · doi:10.1101/2025.06.17.659751 · Cited by 3
Martin, S., Kim, C. Y., & Coller, J. M. (2024) · Methods in molecular biology · doi:10.1007/978-1-0716-4176-7_11 · Cited by 1
Self-citationCodon optimality influences homeostatic gene expression in zebrafish
DeVore, M. L., & Bazzini, A. (2024) · G3 Genes Genomes Genetics · doi:10.1093/g3journal/jkae247 · Cited by 1
Evolutionary principles underpinning codon usage bias: patterns, functions, and mechanismsPreprint
Cope, A., Shah, P., Shah, P., & Wallace, E. W. J. (2024) · doi:10.32942/x2802v · Cited by 1
Transcripts enriched in codons that trigger the P-site tRNA–mediated mRNA decay possess stable mRNAPreprint
Carneiro, R. L., & Palhano, F. L. (2025) · bioRxiv (Cold Spring Harbor Laboratory) · doi:10.1101/2025.04.10.648249 · Cited by 1
Inhibition of pyrimidine biosynthesis targets protein translation in AMLPreprint
So, J., Lewis, A. C., Smith, L. K., Stanley, K. L., Pijpers, L., Domínguez, P. M., Hogg, S. J., Vervoort, S. J., Johnstone, R. W., McDonald, G., et al. (2021) · bioRxiv (Cold Spring Harbor Laboratory) · doi:10.1101/2021.09.24.461627
CRISPR/Cas9 Inducible Gene Knockout in Brown Adipose Tissue
Romanelli, S. M. (2021) · Deep Blue (University of Michigan) · doi:10.7302/2997
[Clinico-instrumental assessment of swallowing in head injury rehabilitation].
Zanardi, L., Munari, M., & Facco, E. (1995) · PubMed
Factors regulating translation coupled mRNA degradation in yeastPreprint
Basu, S., Maiti, R., Hait, S., Chaudhuri, A. R., & Kundu, S. (2022) · bioRxiv (Cold Spring Harbor Laboratory) · doi:10.1101/2022.04.01.486758
Dengue virus preferentially uses human and mosquito non-optimal codonsPreprint
Castellano, L. A., McNamara, R. J., Pallarés, H. M., Gamarnik, A. V., Alvarez, D. E., & Bazzini, A. (2023) · bioRxiv (Cold Spring Harbor Laboratory) · doi:10.1101/2023.06.14.544804
Translation Coupled Mrna-Decay is a Function of Both Structural and Codon Level CharacteristicsPreprint
Basu, S., Hait, S., & Kundu, S. (2024) · bioRxiv (Cold Spring Harbor Laboratory) · doi:10.1101/2024.02.28.582446
Human DDX6 regulates translation and decay of inefficiently translated mRNAsPreprint
Weber, R., Wohlbold, L., & Chang, C.-T. (2024) · eLife · doi:10.7554/elife.92426.2
Weber, R., Wohlbold, L., & Chang, C.-T. (2024) · eLife · doi:10.7554/elife.92426.2.sa0
Author response: Human DDX6 regulates translation and decay of inefficiently translated mRNAs
Weber, R., Wohlbold, L., & Chang, C.-T. (2024) · eLife · doi:10.7554/elife.92426.2.sa3
eLife Assessment: Human DDX6 regulates translation and decay of inefficiently translated mRNAs
VijayRaghavan, K. (2024) · eLife · doi:10.7554/elife.92426.2.sa2
Weber, R., Wohlbold, L., & Chang, C.-T. (2024) · eLife · doi:10.7554/elife.92426.2.sa1
Kulathungage, H., Aretakis, J. R., Vaidya, K., Al-Husini, N., Muthunayake, N. S., Kim, S., & Schrader, J. M. (2025) · bioRxiv (Cold Spring Harbor Laboratory) · doi:10.1101/2025.04.22.648521
Shared regulatory factors influencing mRNA translation rate and half-life in yeast
Basu, S., Hait, S., & Kundu, S. (2025) · Journal of Biomolecular Structure and Dynamics · doi:10.1080/07391102.2025.2540787
The research progress on the design and application of mRNA antibody technology
Du, F., Xiong, X. Z., Chi, H., Deng, Y., & Han, X. (2025) · Chinese Science Bulletin (Chinese Version) · doi:10.1360/csb-2025-5361
Integrated analysis of post-transcriptional regulations reveals insights into acute myeloid leukemia
Khadra, E., Iqbal, Z., Gall, M. L., Clary, G., Levavasseur, F., Tuerdi, Z., Dussiau, C., Rombaut, D., Templé, M., Friedrich, C., et al. (2025) · Communications Biology · doi:10.1038/s42003-025-09156-8
Gillen, S. L., Giacomelli, C., Hodge, K., Zanivan, S., Bushell, M., & Wilczynska, A. (2021) · Figshare · doi:10.6084/m9.figshare.16756063
Metadata
- Authors
- Forrest, M. E., Pinkard, O., Martin, S., Sweet, T. J., Hanson, G., & Coller, J.
- Affiliations
- Case Western Reserve University (US)
- Corresponding author
- Coller, Jeff
- Venue
- PLOS ONE
- Publisher
- Public Library of Science (PLoS)
- Published
- 2020-02-13
- Volume
- 15
- Issue
- 2
- Pages
- e0228730
- ISSN
- 1932-6203 (ISSN-L)
- PMC
- PMC7018022
- OpenAlex
- W3006243445
- Cited by
- 116
- References
- 104
- Citations by year
- 2026: 15 · 2025: 23 · 2024: 25 · 2023: 15 · 2022: 12 · 2021: 15 · 2020: 9
- FWCI
- 4.14
- Type
- journal article
- Language
- en
- Open access
- gold
- doi.org
- Licence
- Locations
- PLoS ONE (publishedVersion, cc-by)
- Europe PMC (PubMed Central) (publishedVersion, cc-by)
- PubMed Central (publishedVersion, cc-by)
- PubMed (publishedVersion)
- DOAJ (DOAJ: Directory of Open Access Journals) (submittedVersion, cc-by-sa)
- Figshare (submittedVersion, cc-by)
- Funders
- National Institutes of Health (GM125086)
- National Institute of General Medical Sciences (GM118018, T32GM136570)
- Topics
- Life Sciences › Biochemistry, Genetics and Molecular Biology › Molecular Biology › RNA and protein synthesis mechanisms
- Life Sciences › Biochemistry, Genetics and Molecular Biology › Molecular Biology › RNA Research and Splicing
- Life Sciences › Biochemistry, Genetics and Molecular Biology › Molecular Biology › RNA modifications and cancer
- Keywords
- mRNA stability, mRNA degradation, codon usage, synonymous codons, amino acid content, transcript half-life, translation elongation, gene expression regulation, mammalian cells, CHO cells
- MeSH terms
- Amino Acids, Animals, Codon, Cricetulus, Half-Life, Cricetinae, HeLa Cells, Humans, RNA, Messenger, RNA, Transfer, Open Reading Frames, CHO Cells, RNA Stability
About these checks
Registry, retraction, Cites and statistics results are computed, not judged, with one exception: a printed reference that no index lists is read once by a model before it counts as a citation error. Claims are extracted by a model and kept only when their quote appears verbatim in the text; each cited source is then checked, with a model’s help, for whether it says what the claim relies on. Those verdicts can be wrong — read the claim’s quote and the cited source before relying on one.
Statistics and arithmetic are recomputed, not judged.
Confidence bands are shown only for fields calibrated on our annotated test set. None is calibrated yet, so no band is shown.
What counts as a claim ›How we measure confidence ›How we check this ›
Are you an author, or do you see a problem with this page? Request a review
