

The DOI matches its Crossref record; 43 of the 44 references it cites were found in a registry or an index; none of the 22 sources its claims cite is checked for support yet.
Adaptive trust calibration for human-AI collaboration
Open accessAbstract
Safety and efficiency of human-AI collaboration often depend on how humans could appropriately calibrate their trust towards the AI agents. Over-trusting the autonomous system sometimes causes serious safety issues. Although many studies focused on the importance of system transparency in keeping proper trust calibration, the research in detecting and mitigating improper trust calibration remains very limited. To fill these research gaps, we propose a method of adaptive trust calibration that consists of a framework for detecting the inappropriate calibration status by monitoring the user's reliance behavior and cognitive cues called "trust calibration cues" to prompt the user to reinitiate trust calibration. We evaluated our framework and four types of trust calibration cues in an online experiment using a drone simulator. A total of 116 participants performed pothole inspection tasks by using the drone's automatic inspection, the reliability of which could fluctuate depending upon the weather conditions. The participants needed to decide whether to rely on automatic inspection or to do the inspection manually. The results showed that adaptively presenting simple cues could significantly promote trust calibration during over-trust.
Overview
AI snapshot
Written from the paper’s full text.
TL;DR
The paper proposes adaptive trust calibration: a behavior-based framework detects over-trust/under-trust and presents “trust calibration cues” (TCCs) only when needed. In an online drone-simulator experiment, adaptively presented TCCs significantly increased manual choices and improved sensitivity d′ during over-trust, whereas continuous reliability information alone did not.
Key findings
- Of 194 online participants, 116 successfully inspected at least 15 checkpoints; they completed 1,740 inspections with a correct rate of 0.74, choosing automatic inspection 1,236 times (0.71) and manual inspection 504 times (0.29).
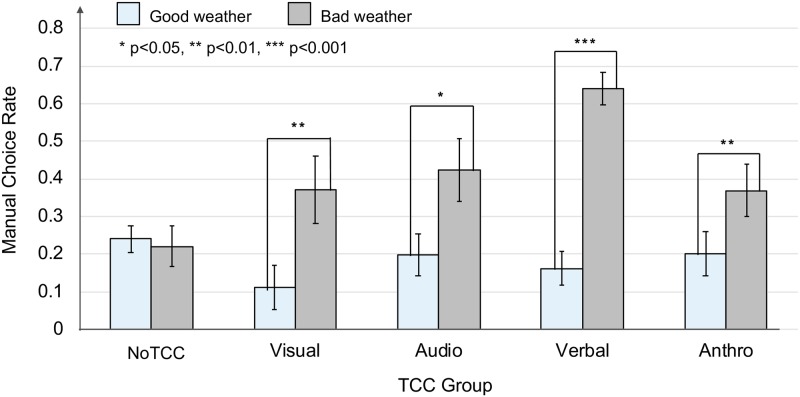
- A two-factor mixed ANOVA found a significant main effect of weather period on manual rates [F(1, 111) = 51.69, p < 0.01] and a significant interaction between TCC group and period [F(4, 111) = 4.86, p < 0.01]. The NoTCC group did not significantly change manual rates between good and bad weather, while all TCC groups did: visual [F(1, 17) = 9.20, p < 0.01], audio [F(1, 21) = 5.54, p = 0.03], verbal [F(1, 28) = 62.9, p < 0.001], and anthropomorphic [F(1, 18) = 8.55, p < 0.01].
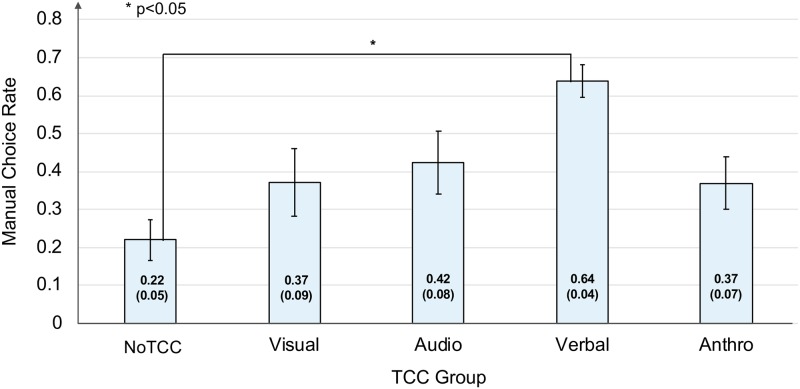
- In bad weather, the verbal TCC group had a significantly higher manual rate than both NoTCC [t(111) = 4.77, adj.p < 0.01] and anthropomorphic TCC [t(111) = 2.74, adj.p = 0.04].
- Sensitivity d′ in bad weather was significantly higher for the verbal group (0.92, SE 0.14) than for NoTCC [t(111) = 2.97, adj.p = 0.04, Cohen’s d = 0.75]; accuracy declined in bad weather but did not differ significantly among groups, though the verbal group had the highest mean accuracy (0.72, SE 0.04).
Methods
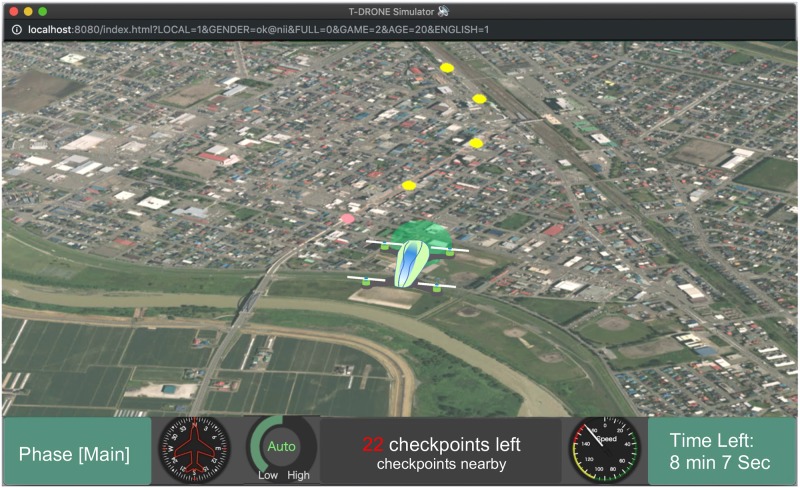
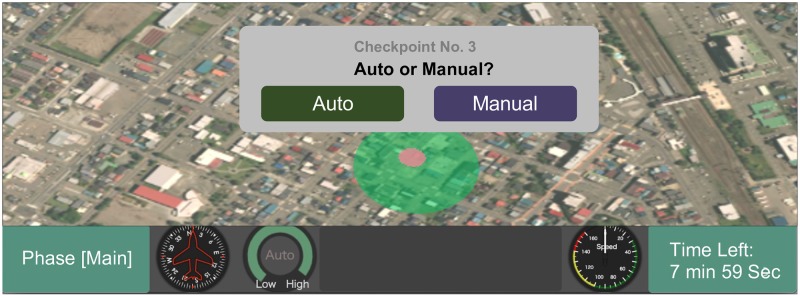
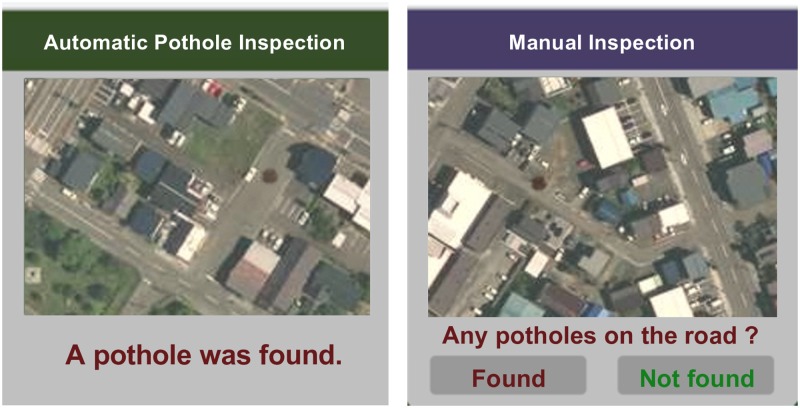
- Online experiment using a 3D drone simulator built with CesiumJS and Bing Map API. Participants performed a pothole inspection task over 30 checkpoints (10 with potholes, 20 without), choosing between automatic inspection and manual inspection; they were randomly assigned to NoTCC, visual, audio, verbal, or anthropomorphic TCC groups.
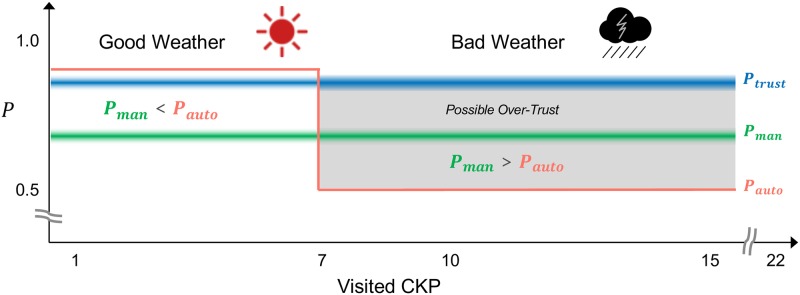
- Automatic inspection reliability Pauto was manipulated: good weather Pauto = 90% and d′ = 1.8; bad weather Pauto = 50% and d′ = 0.1. The framework detected over-trust by observing reliance behavior and comparing Pman and Pauto, then presented a TCC when over-trust was detected.
- Main analyses were two-factor mixed ANOVAs with TCC group as between-subjects and checkpoint period as within-subjects, plus Holm–Bonferroni-adjusted post hoc comparisons and t-tests for Pman.
Limitations
- Stated: the framework focuses only on performance-related factors, ignoring other automation benefits such as faster completion, lighter workload, or fewer risks; it evaluates only an over-trust scenario; it does not guarantee convergence of behavior; and it uses only a pothole inspection/reconnaissance task and four TCC types.
- Stated: correct answers were not shown during the task, and automatic-inspection results were shown only when participants chose automatic inspection, not manual inspection; future work should test combinations of feedback information.
- Evident: attrition was high—78 of 194 participants failed to complete the task within the time limit because they moved the drone away from the checkpoints—so the analyzed sample of 116 may not represent all recruited participants.
Model-written summary. Check it against the paper before relying on it.
Integrity signals
Registry
Cites
Statistics
Figures
Verification
Claims the paper makes
29 Own result · 26 Own interpretation · 11 Not checked yet · 6 Own method · 3 No basis given
A result the paper reports from its own data — it cites no other source for it, so there is none to check. The quote shows it is in the paper.
In the paper
“The participants of the group without TCC did not change their behavior when they were in over-trust status, even if the system reliability information was continuously presented.”
§ Adaptive trust calibration for human-AI collaboration > Introduction
plain- Asserted: passes — The authors put it forward as true.
- Checkable: passes — It can be checked against evidence.
- Load-bearing: passes — The paper’s conclusions depend on it.
- Based: passes — The paper gives a reason why it holds.
A result the paper reports from its own data — it cites no other source for it, so there is none to check. The quote shows it is in the paper.
In the paper
“We found that adaptively presented TCCs significantly affected the choice behavior of the participants.”
§ Adaptive trust calibration for human-AI collaboration > Introduction
plaindirect- Asserted: passes — The authors put it forward as true.
- Checkable: passes — It can be checked against evidence.
- Load-bearing: passes — The paper’s conclusions depend on it.
- Based: passes — The paper gives a reason why it holds.
A result the paper reports from its own data — it cites no other source for it, so there is none to check. The quote shows it is in the paper.
In the paper
“while TCC rates in the anthro. TCC group did not follow the decreasing trend.”
§ Adaptive trust calibration for human-AI collaboration > Results > TCC rates
plain- Asserted: passes — The authors put it forward as true.
- Checkable: passes — It can be checked against evidence.
- Load-bearing: unclear — It is unclear whether the paper’s conclusions depend on it.
- Based: passes — The paper gives a reason why it holds.
A result the paper reports from its own data — it cites no other source for it, so there is none to check. The quote shows it is in the paper.
In the paper
“and that Pman in the bad weather period was significantly larger than Pauto = 0.50 [Mean = 0.86, t(200) = 17.79, p < 0.01, Cohen’s d = 1.25].”
§ Adaptive trust calibration for human-AI collaboration > Results > Performance: Sensitivity d′ and accuracy
plain- Asserted: passes — The authors put it forward as true.
- Checkable: passes — It can be checked against evidence.
- Load-bearing: unclear — It is unclear whether the paper’s conclusions depend on it.
- Based: passes — The paper gives a reason why it holds.
- The authors state this as an assumption: Manual accuracy can be used to estimate Pman.
A result the paper reports from its own data — it cites no other source for it, so there is none to check. The quote shows it is in the paper.
In the paper
“One-sample t-tests showed that Pman in the good weather period was significantly smaller than Pauto = 0.90 [Mean = 0.81, t(71) = −2.17, p = 0.03, Cohen’s d = 0.26]”
§ Adaptive trust calibration for human-AI collaboration > Results > Performance: Sensitivity d′ and accuracy
plain- Asserted: passes — The authors put it forward as true.
- Checkable: passes — It can be checked against evidence.
- Load-bearing: unclear — It is unclear whether the paper’s conclusions depend on it.
- Based: passes — The paper gives a reason why it holds.
- The authors state this as an assumption: Manual accuracy can be used to estimate Pman.
A result the paper reports from its own data — it cites no other source for it, so there is none to check. The quote shows it is in the paper.
In the paper
“A significant interaction was found between the two factors [F(4, 111) = 4.86, p < 0.01, ].”
§ Adaptive trust calibration for human-AI collaboration > Results > Manual rates
plaincorrelational- Asserted: passes — The authors put it forward as true.
- Checkable: passes — It can be checked against evidence.
- Load-bearing: passes — The paper’s conclusions depend on it.
- Based: passes — The paper gives a reason why it holds.
A result the paper reports from its own data — it cites no other source for it, so there is none to check. The quote shows it is in the paper.
In the paper
“and the anthro. group (t(111) = 2.74, adj.p = 0.04).”
§ Adaptive trust calibration for human-AI collaboration > Results > Manual rates
plain- Asserted: passes — The authors put it forward as true.
- Checkable: passes — It can be checked against evidence.
- Load-bearing: unclear — It is unclear whether the paper’s conclusions depend on it.
- Based: passes — The paper gives a reason why it holds.
A result the paper reports from its own data — it cites no other source for it, so there is none to check. The quote shows it is in the paper.
In the paper
“a Welch’s t-test indicated that there was no significant difference between Pman in the good weather period and in the bad one [t(114) = −1.08, p = 0.28, Cohen’s d = 0.16].”
§ Adaptive trust calibration for human-AI collaboration > Results > Performance: Sensitivity d′ and accuracy
plain- Asserted: passes — The authors put it forward as true.
- Checkable: passes — It can be checked against evidence.
- Load-bearing: passes — The paper’s conclusions depend on it.
- Based: passes — The paper gives a reason why it holds.
- The authors state this as an assumption: Manual accuracy can be used to estimate Pman.
A result the paper reports from its own data — it cites no other source for it, so there is none to check. The quote shows it is in the paper.
In the paper
“No other differences between the groups were found to be significant.”
- Also stated in: § Effects of TCCs to change the participants’ behavior · plain
“The result, however, showed that its manual choice rate was not significantly larger than the one of NoTCc group.”
§ Adaptive trust calibration for human-AI collaboration > Results > Manual rates
plain- Asserted: passes — The authors put it forward as true.
- Checkable: passes — It can be checked against evidence.
- Load-bearing: unclear — It is unclear whether the paper’s conclusions depend on it.
- Based: passes — The paper gives a reason why it holds.
- Also stated in: § Effects of TCCs to change the participants’ behavior · plain
A result the paper reports from its own data — it cites no other source for it, so there is none to check. The quote shows it is in the paper.
In the paper
“TCC rates in the verbal TCC group were higher in the early part of the period and gradually decreased.”
§ Adaptive trust calibration for human-AI collaboration > Results > TCC rates
plaincorrelational- Asserted: passes — The authors put it forward as true.
- Checkable: passes — It can be checked against evidence.
- Load-bearing: unclear — It is unclear whether the paper’s conclusions depend on it.
- Based: passes — The paper gives a reason why it holds.
A result the paper reports from its own data — it cites no other source for it, so there is none to check. The quote shows it is in the paper.
In the paper
“One of the groups with TCCs had a significantly higher value of sensitivity d’ than the group without TCC, showing that adaptive trust calibration was effective in situations where continuous trust calibration was not effective.”
§ Adaptive trust calibration for human-AI collaboration > Introduction
plaincorrelational- Asserted: passes — The authors put it forward as true.
- Checkable: passes — It can be checked against evidence.
- Load-bearing: passes — The paper’s conclusions depend on it.
- Based: passes — The paper gives a reason why it holds.
A result the paper reports from its own data — it cites no other source for it, so there is none to check. The quote shows it is in the paper.
In the paper
“the sensitivity d′ in the bad weather period was significantly lower than in the good weather period [].”
§ Adaptive trust calibration for human-AI collaboration > Results > Performance: Sensitivity d′ and accuracy
plain- Asserted: passes — The authors put it forward as true.
- Checkable: passes — It can be checked against evidence.
- Load-bearing: passes — The paper’s conclusions depend on it.
- Based: passes — The paper gives a reason why it holds.
A result the paper reports from its own data — it cites no other source for it, so there is none to check. The quote shows it is in the paper.
In the paper
“but there was no significant difference among the five groups[].”
§ Adaptive trust calibration for human-AI collaboration > Results > Performance: Sensitivity d′ and accuracy
plain- Asserted: passes — The authors put it forward as true.
- Checkable: passes — It can be checked against evidence.
- Load-bearing: passes — The paper’s conclusions depend on it.
- Based: passes — The paper gives a reason why it holds.
A result the paper reports from its own data — it cites no other source for it, so there is none to check. The quote shows it is in the paper.
In the paper
“The analysis revealed a significant main effect for the CKP periods [F(1, 111) = 51.69, p < 0.01, ].”
§ Adaptive trust calibration for human-AI collaboration > Results > Manual rates
plaincorrelational- Asserted: passes — The authors put it forward as true.
- Checkable: passes — It can be checked against evidence.
- Load-bearing: unclear — It is unclear whether the paper’s conclusions depend on it.
- Based: passes — The paper gives a reason why it holds.
A result the paper reports from its own data — it cites no other source for it, so there is none to check. The quote shows it is in the paper.
In the paper
“all of the groups with TCCs showed significantly higher manual rates in the bad weather period than in the good weather period [Visual TCC, F(1, 17) = 9.20, p < 0.01, ; Audio TCC, F(1, 21) = 5.54, p = 0.03, ; Verbal TCC, F(1, 28) = 62.9, p < 0.001, ; Anthro TCC, F(1, 18) = 8.55, p < 0.01, ].”
- Also stated in: § Effects of TCCs to change the participants’ behavior · plain
“The groups with visual, verbal, and anthro. TCCs showed significantly higher manual rates for the bad weather period than for the good weather period (Fig 7).”
§ Adaptive trust calibration for human-AI collaboration > Results > Manual rates
plaincorrelational- Asserted: passes — The authors put it forward as true.
- Checkable: passes — It can be checked against evidence.
- Load-bearing: passes — The paper’s conclusions depend on it.
- Based: passes — The paper gives a reason why it holds.
- Also stated in: § Effects of TCCs to change the participants’ behavior · plain
A result the paper reports from its own data — it cites no other source for it, so there is none to check. The quote shows it is in the paper.
In the paper
“The NoTCC group did not show a simple effect for the CKP periods [] indicating the manual rates of the NoTCC group were not significantly different between the two CKP periods.”
§ Adaptive trust calibration for human-AI collaboration > Results > Manual rates
hedged- Asserted: passes — The authors put it forward as true.
- Checkable: passes — It can be checked against evidence.
- Load-bearing: passes — The paper’s conclusions depend on it.
- Based: passes — The paper gives a reason why it holds.
A result the paper reports from its own data — it cites no other source for it, so there is none to check. The quote shows it is in the paper.
In the paper
“In the good weather period, there was no simple effect for the TCC groups, meaning that the manual rates of each TCC group were not significantly different from each other [].”
§ Adaptive trust calibration for human-AI collaboration > Results > Manual rates
plain- Asserted: passes — The authors put it forward as true.
- Checkable: passes — It can be checked against evidence.
- Load-bearing: unclear — It is unclear whether the paper’s conclusions depend on it.
- Based: passes — The paper gives a reason why it holds.
A result the paper reports from its own data — it cites no other source for it, so there is none to check. The quote shows it is in the paper.
In the paper
“Accuracy, the rate of the correct inspection, also significantly declined in the bad weather period[]”
§ Adaptive trust calibration for human-AI collaboration > Results > Performance: Sensitivity d′ and accuracy
plaindirect- Asserted: passes — The authors put it forward as true.
- Checkable: passes — It can be checked against evidence.
- Load-bearing: unclear — It is unclear whether the paper’s conclusions depend on it.
- Based: passes — The paper gives a reason why it holds.
A result the paper reports from its own data — it cites no other source for it, so there is none to check. The quote shows it is in the paper.
In the paper
“For the bad weather period, the verbal group showed a significantly higher manual rate than both the NoTCC group (t(111) = 4.77, adj.p < 0.01)”
§ Adaptive trust calibration for human-AI collaboration > Results > Manual rates
plain- Asserted: passes — The authors put it forward as true.
- Checkable: passes — It can be checked against evidence.
- Load-bearing: passes — The paper’s conclusions depend on it.
- Based: passes — The paper gives a reason why it holds.
A result the paper reports from its own data — it cites no other source for it, so there is none to check. The quote shows it is in the paper.
In the paper
“The manual choice rate of the visual TCC were also smaller than other TCCs.”
§ Adaptive trust calibration for human-AI collaboration > Discussion > Effects of TCCs to change the participants’ behavior
plain- Asserted: passes — The authors put it forward as true.
- Checkable: passes — It can be checked against evidence.
- Load-bearing: passes — The paper’s conclusions depend on it.
- Based: passes — The paper gives a reason why it holds.
A result the paper reports from its own data — it cites no other source for it, so there is none to check. The quote shows it is in the paper.
In the paper
“The verbal group had the highest manual rate (Fig 8).”
§ Adaptive trust calibration for human-AI collaboration > Discussion > Effects of TCCs to change the participants’ behavior
plaincorrelational- Asserted: passes — The authors put it forward as true.
- Checkable: passes — It can be checked against evidence.
- Load-bearing: passes — The paper’s conclusions depend on it.
- Based: passes — The paper gives a reason why it holds.
A result the paper reports from its own data — it cites no other source for it, so there is none to check. The quote shows it is in the paper.
In the paper
“However, the participants promptly increased the manual choices after recognizing TCCs despite the longer completion time.”
§ Adaptive trust calibration for human-AI collaboration > Discussion > Effects of TCCs to change the participants’ behavior
plaindirect- Asserted: passes — The authors put it forward as true.
- Checkable: passes — It can be checked against evidence.
- Load-bearing: passes — The paper’s conclusions depend on it.
- Based: passes — The paper gives a reason why it holds.
None of the sources cited for this claim have been checked yet.
In the paper
“Most of the studies investigated how to maintain appropriate trust calibration by continuously presenting system information to prevent over-trust or under-trust.”
§ Adaptive trust calibration for human-AI collaboration > Introduction > System transparency and continuous trust calibration
What the sources say
- Not checked yetcites [2] BM Muir, 1994, Trust in automation: Part I. Theoretical issues in the study of trust and human intervention in automated systems, Ergonomics source
- Not checked yetcites [12] JE Mercado, 2016, Intelligent agent transparency in human–agent teaming for multi-UxV management, Human Factors source
- Not checked yetcites [13] Yang XJ, Unhelkar VV, Li K, Shah JA. Evaluating effects of user experience and system transparency on trust in automation. In: Proceedings of the ACM/IEEE International Conference on Human-Robot Interaction; 2017. p. 408–416. https://doi.org/10.1145/2909824.3020230. source
- Not checked yetcites [15] JM McGuirl, 2006, Supporting trust calibration and the effective use of decision aids by presenting dynamic system confidence information, Human Factors source
- Not checked yetcites [7] Seppelt BD. Supporting operator reliance on automation through continuous feedback [dissertation]. University of Iowa; 2009. https://doi.org/10.17077/etd.90t9uqnh. source
plain- Asserted: passes — The authors put it forward as true.
- Checkable: passes — It can be checked against evidence.
- Load-bearing: passes — The paper’s conclusions depend on it.
- Based: passes — The paper gives a reason why it holds.
The paper states this without a source or data behind it here, so there is nothing to check it against. The quote shows it is in the paper.
In the paper
“Although many studies focused on the importance of system transparency in keeping proper trust calibration, the research in detecting and mitigating improper trust calibration remains very limited.”
- Also stated in: § System transparency and continuous trust calibration · plain
“Very few studies have focused on detecting poor trust calibration or how to recover from over-trust or under-trust swiftly.”
§ Adaptive trust calibration for human-AI collaboration > Abstract
plain- Asserted: passes — The authors put it forward as true.
- Checkable: passes — It can be checked against evidence.
- Load-bearing: passes — The paper’s conclusions depend on it.
- Based: unclear — It is unclear why the paper says it holds.
- Also stated in: § System transparency and continuous trust calibration · plain
None of the sources cited for this claim have been checked yet.
In the paper
“Poor trust calibration sometimes causes serious safety issues [3, 4].”
§ Adaptive trust calibration for human-AI collaboration > Introduction
What the sources say
- Not checked yetcites [3] R Parasuraman, 1997, Humans and automation: Use, misuse, disuse, abuse, Human Factors source
- Not checked yetcites [4] Robinette P, Li W, Allen R, Howard AM, Wagner AR. Overtrust of robots in emergency evacuation scenarios. In: Proceedings of the ACM/IEEE International Conference on Human-Robot Interaction; 2016. p. 101–108. https://doi.org/10.1109/HRI.2016.7451740. source
hedgedconditional- Asserted: passes — The authors put it forward as true.
- Checkable: passes — It can be checked against evidence.
- Load-bearing: passes — The paper’s conclusions depend on it.
- Based: passes — The paper gives a reason why it holds.
None of the sources cited for this claim have been checked yet.
In the paper
“Successful collaborations between users and agents would require the users to appropriately adjust their level of trust with the actual reliability of the agents.”
§ Adaptive trust calibration for human-AI collaboration > Introduction
What the sources say
hedgeddirect- Asserted: passes — The authors put it forward as true.
- Checkable: passes — It can be checked against evidence.
- Load-bearing: passes — The paper’s conclusions depend on it.
- Based: passes — The paper gives a reason why it holds.
None of the sources cited for this claim have been checked yet.
In the paper
“Several studies [13, 23, 26] have demonstrated that reliance behavior can be explained by the relationship between a user’s trust in the agents and the user’s self-confidence.”
§ Adaptive trust calibration for human-AI collaboration > Introduction > Our approach: Adaptive trust calibration
What the sources say
- Not checked yetcites [13] Yang XJ, Unhelkar VV, Li K, Shah JA. Evaluating effects of user experience and system transparency on trust in automation. In: Proceedings of the ACM/IEEE International Conference on Human-Robot Interaction; 2017. p. 408–416. https://doi.org/10.1145/2909824.3020230. source
- Not checked yetcites [23] P de Vries, 2003, The effects of errors on system trust, self-confidence, and the allocation of control in route planning, International Journal of Human Computer Studies source
- Not checked yetcites [26] J Gac, 2006, Extending the decision field theory to model operators’ reliance on automation in supervisory control situations, IEEE Transactions on Systems, Man, and Cybernetics Part A: Systems and Humans source
boostedcorrelational- Asserted: passes — The authors put it forward as true.
- Checkable: passes — It can be checked against evidence.
- Load-bearing: passes — The paper’s conclusions depend on it.
- Based: passes — The paper gives a reason why it holds.
A conclusion the paper draws from its own results — it cites no other source for it, so there is none to check. The quote shows it is in the paper.
In the paper
“This result indicates that Pman did not degrade under the change in weather conditions.”
§ Adaptive trust calibration for human-AI collaboration > Results > Performance: Sensitivity d′ and accuracy
hedged- Asserted: passes — The authors put it forward as true.
- Checkable: passes — It can be checked against evidence.
- Load-bearing: unclear — It is unclear whether the paper’s conclusions depend on it.
- Based: passes — The paper gives a reason why it holds.
- The authors state this as an assumption: Manual accuracy can be used to estimate Pman.
A conclusion the paper draws from its own results — it cites no other source for it, so there is none to check. The quote shows it is in the paper.
In the paper
“One of the groups with TCCs had a significantly higher value of sensitivity d’ than the group without TCC, showing that adaptive trust calibration was effective in situations where continuous trust calibration was not effective.”
§ Adaptive trust calibration for human-AI collaboration > Introduction
plaindirect- Asserted: passes — The authors put it forward as true.
- Checkable: passes — It can be checked against evidence.
- Load-bearing: passes — The paper’s conclusions depend on it.
- Based: passes — The paper gives a reason why it holds.
A conclusion the paper draws from its own results — it cites no other source for it, so there is none to check. The quote shows it is in the paper.
In the paper
“The participants changed their choice behavior as the weather conditions deteriorated.”
§ Adaptive trust calibration for human-AI collaboration > Results > Manual rates
plaincorrelational- Asserted: passes — The authors put it forward as true.
- Checkable: passes — It can be checked against evidence.
- Load-bearing: passes — The paper’s conclusions depend on it.
- Based: passes — The paper gives a reason why it holds.
A conclusion the paper draws from its own results — it cites no other source for it, so there is none to check. The quote shows it is in the paper.
In the paper
“Despite several limitations in our framework and our experiment, our study demonstrates the effects of adaptively presenting cognitive cues in instances of over-trust.”
§ Adaptive trust calibration for human-AI collaboration > Introduction
boosteddirect- Asserted: passes — The authors put it forward as true.
- Checkable: passes — It can be checked against evidence.
- Load-bearing: passes — The paper’s conclusions depend on it.
- Based: passes — The paper gives a reason why it holds.
A conclusion the paper draws from its own results — it cites no other source for it, so there is none to check. The quote shows it is in the paper.
In the paper
“The better task performances were also achieved with the behavior changes triggered by TCCs, whose presentation timing was decided by the proposed framework.”
§ Adaptive trust calibration for human-AI collaboration > Discussion
plaindirect- Asserted: passes — The authors put it forward as true.
- Checkable: passes — It can be checked against evidence.
- Load-bearing: passes — The paper’s conclusions depend on it.
- Based: passes — The paper gives a reason why it holds.
A conclusion the paper draws from its own results — it cites no other source for it, so there is none to check. The quote shows it is in the paper.
In the paper
“The overall results demonstrated that adaptively presenting TCCs strongly affected whether the choice behavior of the participants would change”
- Also stated in: § Effects of TCCs to change the participants’ behavior · hedged
“These results indicated that adaptively presenting TCCs strongly affected the choice behavior of the participants who otherwise failed to find opportunities to change their tendency to rely on the automation.”
§ Adaptive trust calibration for human-AI collaboration > Discussion
boosteddirect- Asserted: passes — The authors put it forward as true.
- Checkable: passes — It can be checked against evidence.
- Load-bearing: passes — The paper’s conclusions depend on it.
- Based: passes — The paper gives a reason why it holds.
- Also stated in: § Effects of TCCs to change the participants’ behavior · hedged
A conclusion the paper draws from its own results — it cites no other source for it, so there is none to check. The quote shows it is in the paper.
In the paper
“This indicates that over-trust decreased during this period.”
§ Adaptive trust calibration for human-AI collaboration > Results > TCC rates
hedged- Asserted: passes — The authors put it forward as true.
- Checkable: passes — It can be checked against evidence.
- Load-bearing: unclear — It is unclear whether the paper’s conclusions depend on it.
- Based: passes — The paper gives a reason why it holds.
- Rests on an assumption: TCC rates are a valid indicator of over-trust or trust calibration status.
A conclusion the paper draws from its own results — it cites no other source for it, so there is none to check. The quote shows it is in the paper.
In the paper
“while continuously presenting the reliability information did not help the participants change their bias to rely on the automation.”
§ Adaptive trust calibration for human-AI collaboration > Discussion
plain- Asserted: passes — The authors put it forward as true.
- Checkable: passes — It can be checked against evidence.
- Load-bearing: passes — The paper’s conclusions depend on it.
- Based: passes — The paper gives a reason why it holds.
A conclusion the paper draws from its own results — it cites no other source for it, so there is none to check. The quote shows it is in the paper.
In the paper
“The results showed that all the groups with TCCs showed higher discriminating performance in the bad weather period than the NoTCC group.”
§ Adaptive trust calibration for human-AI collaboration > Discussion > Performance
plaincorrelational- Asserted: passes — The authors put it forward as true.
- Checkable: passes — It can be checked against evidence.
- Load-bearing: passes — The paper’s conclusions depend on it.
- Based: passes — The paper gives a reason why it holds.
None of the sources cited for this claim have been checked yet.
In the paper
“This result is not in line with the previous studies [6, 7, 15] that emphasized the effectiveness of the continuous trust calibration with system transparency.”
§ Adaptive trust calibration for human-AI collaboration > Discussion > Adaptive method vs. continuous method
What the sources say
- Not checked yetcites [6] Merritt SM, Lachapell-unnerstall J, Louis S. Continuous calibration of trust in automated systems. Air Force Research Laboratory Technical Report; 2014. AFRL-RH-WP-TR-2014-0026. source
- Not checked yetcites [7] Seppelt BD. Supporting operator reliance on automation through continuous feedback [dissertation]. University of Iowa; 2009. https://doi.org/10.17077/etd.90t9uqnh. source
- Not checked yetcites [15] JM McGuirl, 2006, Supporting trust calibration and the effective use of decision aids by presenting dynamic system confidence information, Human Factors source
plain- Asserted: passes — The authors put it forward as true.
- Checkable: passes — It can be checked against evidence.
- Load-bearing: passes — The paper’s conclusions depend on it.
- Based: passes — The paper gives a reason why it holds.
A conclusion the paper draws from its own results — it cites no other source for it, so there is none to check. The quote shows it is in the paper.
In the paper
“We believe that the results demonstrated the effectiveness of the adaptive method.”
§ Adaptive trust calibration for human-AI collaboration > Discussion > Adaptive method vs. continuous method
boosteddirect- Asserted: passes — The authors put it forward as true.
- Checkable: passes — It can be checked against evidence.
- Load-bearing: passes — The paper’s conclusions depend on it.
- Based: passes — The paper gives a reason why it holds.
A conclusion the paper draws from its own results — it cites no other source for it, so there is none to check. The quote shows it is in the paper.
In the paper
“Nevertheless, the participants of the NoTCC group continued to rely on the drone’s automatic pothole inspection, which had less reliability than the actual manual success rate.”
§ Adaptive trust calibration for human-AI collaboration > Discussion > Adaptive method vs. continuous method
plain- Asserted: passes — The authors put it forward as true.
- Checkable: passes — It can be checked against evidence.
- Load-bearing: passes — The paper’s conclusions depend on it.
- Based: passes — The paper gives a reason why it holds.
A conclusion the paper draws from its own results — it cites no other source for it, so there is none to check. The quote shows it is in the paper.
In the paper
“Therefore, we believe that our proposed framework can be applied to real-time applications that require human-agent collaboration.”
§ Adaptive trust calibration for human-AI collaboration > Discussion > Applicability in real-world situations
plain- Asserted: passes — The authors put it forward as true.
- Checkable: passes — It can be checked against evidence.
- Load-bearing: unclear — It is unclear whether the paper’s conclusions depend on it.
- Based: passes — The paper gives a reason why it holds.
A conclusion the paper draws from its own results — it cites no other source for it, so there is none to check. The quote shows it is in the paper.
In the paper
“In contrast to this, the participants in other groups with TCCs could successfully reached the adaptation stage and change their behaviors in this experiment.”
§ Adaptive trust calibration for human-AI collaboration > Discussion > Adaptive method vs. continuous method
hedgeddirect- Asserted: passes — The authors put it forward as true.
- Checkable: passes — It can be checked against evidence.
- Load-bearing: passes — The paper’s conclusions depend on it.
- Based: passes — The paper gives a reason why it holds.
A conclusion the paper draws from its own results — it cites no other source for it, so there is none to check. The quote shows it is in the paper.
In the paper
“This result indicates that the possible automation bias caused by the difference in the task completion times did not critically impact the decision-making of the participants in the experiment.”
§ Adaptive trust calibration for human-AI collaboration > Discussion > Effects of TCCs to change the participants’ behavior
hedged- Asserted: passes — The authors put it forward as true.
- Checkable: passes — It can be checked against evidence.
- Load-bearing: passes — The paper’s conclusions depend on it.
- Based: passes — The paper gives a reason why it holds.
A conclusion the paper draws from its own results — it cites no other source for it, so there is none to check. The quote shows it is in the paper.
In the paper
“To our knowledge, this is the first study to show how to adaptively prompt the users to calibrate their trust toward an automated agent based on their trust calibration status.”
§ Adaptive trust calibration for human-AI collaboration > Conclusion
hedgeddirect- Asserted: passes — The authors put it forward as true.
- Checkable: passes — It can be checked against evidence.
- Load-bearing: passes — The paper’s conclusions depend on it.
- Based: unclear — It is unclear why the paper says it holds.
A conclusion the paper draws from its own results — it cites no other source for it, so there is none to check. The quote shows it is in the paper.
In the paper
“Thus, the participants over-trusted the automatic inspection despite the system information indicating the reliability becoming worse.”
§ Adaptive trust calibration for human-AI collaboration > Discussion > Adaptive method vs. continuous method
plain- Asserted: passes — The authors put it forward as true.
- Checkable: passes — It can be checked against evidence.
- Load-bearing: passes — The paper’s conclusions depend on it.
- Based: passes — The paper gives a reason why it holds.
- Rests on an assumption: TCC rates are a valid indicator of over-trust or trust calibration status.
A conclusion the paper draws from its own results — it cites no other source for it, so there is none to check. The quote shows it is in the paper.
In the paper
“Our results indicated that they are not always sufficient to recover from over-trust”
§ Adaptive trust calibration for human-AI collaboration > Conclusion
hedged- Asserted: passes — The authors put it forward as true.
- Checkable: passes — It can be checked against evidence.
- Load-bearing: passes — The paper’s conclusions depend on it.
- Based: passes — The paper gives a reason why it holds.
A conclusion the paper draws from its own results — it cites no other source for it, so there is none to check. The quote shows it is in the paper.
In the paper
“our method of adaptive trust calibration significantly helped the participants change their behavior and recover from the over-trust.”
§ Adaptive trust calibration for human-AI collaboration > Conclusion
plaindirect- Asserted: passes — The authors put it forward as true.
- Checkable: passes — It can be checked against evidence.
- Load-bearing: passes — The paper’s conclusions depend on it.
- Based: passes — The paper gives a reason why it holds.
A conclusion the paper draws from its own results — it cites no other source for it, so there is none to check. The quote shows it is in the paper.
In the paper
“this study has demonstrated the effectiveness of presenting cognitive cues at the time of over-trust.”
§ Adaptive trust calibration for human-AI collaboration > Conclusion
boosteddirect- Asserted: passes — The authors put it forward as true.
- Checkable: passes — It can be checked against evidence.
- Load-bearing: passes — The paper’s conclusions depend on it.
- Based: passes — The paper gives a reason why it holds.
- Probably not a substantial claim. 16
- It may state two separate claims as one. 16
- The quote only partly states this claim. 1
A result the paper reports from its own data — it cites no other source for it, so there is none to check. The quote shows it is in the paper.
In the paper
“The participants did the manual inspection 504 times (the choice rate = 0.29).”
§ Adaptive trust calibration for human-AI collaboration > Results
plain- Asserted: passes — The authors put it forward as true.
- Checkable: passes — It can be checked against evidence.
- Load-bearing: fails — The paper’s conclusions may not depend on it.
- Based: passes — The paper gives a reason why it holds.
Probably not a substantial claim. The paper’s conclusions may not depend on it. It may state two separate claims as one.
A result the paper reports from its own data — it cites no other source for it, so there is none to check. The quote shows it is in the paper.
In the paper
“however, the verbal group showed the highest mean value (0.72 (SE 0.04)), and other groups with TCCs also had better accuracy values (0.6 (SE 0.04)) than the NoTCC group.”
§ Adaptive trust calibration for human-AI collaboration > Results > Performance: Sensitivity d′ and accuracy
plaincorrelational- Asserted: passes — The authors put it forward as true.
- Checkable: passes — It can be checked against evidence.
- Load-bearing: unclear — It is unclear whether the paper’s conclusions depend on it.
- Based: passes — The paper gives a reason why it holds.
It may state two separate claims as one.
A result the paper reports from its own data — it cites no other source for it, so there is none to check. The quote shows it is in the paper.
In the paper
“The visual and audio TCC groups also showed a similar trend”
§ Adaptive trust calibration for human-AI collaboration > Results > TCC rates
plaincorrelational- Asserted: passes — The authors put it forward as true.
- Checkable: passes — It can be checked against evidence.
- Load-bearing: unclear — It is unclear whether the paper’s conclusions depend on it.
- Based: passes — The paper gives a reason why it holds.
The quote only partly states this claim.
A result the paper reports from its own data — it cites no other source for it, so there is none to check. The quote shows it is in the paper.
In the paper
“They inspected the total of 1,740 CKPs from the 1st CKP to the 15th CKP, and the results of 1,282 inspections were correct, making the correct answer rate 0.74.”
§ Adaptive trust calibration for human-AI collaboration > Results
plainn = 16- Asserted: passes — The authors put it forward as true.
- Checkable: passes — It can be checked against evidence.
- Load-bearing: unclear — It is unclear whether the paper’s conclusions depend on it.
- Based: passes — The paper gives a reason why it holds.
It may state two separate claims as one.
A result the paper reports from its own data — it cites no other source for it, so there is none to check. The quote shows it is in the paper.
In the paper
“In the bad weather period, post-hoc comparisons indicated that the sensitivity d′ of the verbal group, which was the highest (0.92 (SE 0.14) among all the groups, was significantly higher than the sensitivity d′ of the NoTCC group [t(111) = 2.97, adj.p = 0.04, Cohen’s d = 0.75].”
§ Adaptive trust calibration for human-AI collaboration > Results > Performance: Sensitivity d′ and accuracy
hedged- Asserted: passes — The authors put it forward as true.
- Checkable: passes — It can be checked against evidence.
- Load-bearing: passes — The paper’s conclusions depend on it.
- Based: passes — The paper gives a reason why it holds.
It may state two separate claims as one.
A result the paper reports from its own data — it cites no other source for it, so there is none to check. The quote shows it is in the paper.
In the paper
“Automatic inspection was selected 1,236 times (the choice rate = 0.71).”
§ Adaptive trust calibration for human-AI collaboration > Results
plain- Asserted: passes — The authors put it forward as true.
- Checkable: passes — It can be checked against evidence.
- Load-bearing: fails — The paper’s conclusions may not depend on it.
- Based: passes — The paper gives a reason why it holds.
Probably not a substantial claim. The paper’s conclusions may not depend on it.
A result the paper reports from its own data — it cites no other source for it, so there is none to check. The quote shows it is in the paper.
In the paper
“Though there was no statistical difference in accuracy among the groups, all the groups with TCCs also showed better accuracy than the NoTCC group.”
§ Adaptive trust calibration for human-AI collaboration > Discussion > Performance
plain- Asserted: passes — The authors put it forward as true.
- Checkable: passes — It can be checked against evidence.
- Load-bearing: unclear — It is unclear whether the paper’s conclusions depend on it.
- Based: passes — The paper gives a reason why it holds.
It may state two separate claims as one.
A conclusion the paper draws from its own results — it cites no other source for it, so there is none to check. The quote shows it is in the paper.
In the paper
“To solve this dilemma that could perpetuate an inappropriate status of trust calibration, a new trigger would be necessary in instances of over-trust or under-trust.”
§ Adaptive trust calibration for human-AI collaboration > Introduction > Our approach: Adaptive trust calibration
hedgeddirect- Asserted: passes — The authors put it forward as true.
- Checkable: fails — It may be too vague to check against evidence.
- Load-bearing: passes — The paper’s conclusions depend on it.
- Based: passes — The paper gives a reason why it holds.
Probably not a substantial claim. It may be too vague to check against evidence.
In the paper
“Calibration can only occur in response to new evidence that may change the users’ prevailing recognition, while no new evidence can be learned without changing the current behavior first [5].”
§ Adaptive trust calibration for human-AI collaboration > Introduction > Our approach: Adaptive trust calibration
What the sources say
- Not checked yetcites [5] Adams BD, Bruyn LE, Houde S. Trust in automated systems literature review. Defence Research and Development Canada; 2003. Report No. CR-2003-096.
plaindirect- Asserted: passes — The authors put it forward as true.
- Checkable: passes — It can be checked against evidence.
- Load-bearing: passes — The paper’s conclusions depend on it.
- Based: passes — The paper gives a reason why it holds.
It may state two separate claims as one.
In the paper
“Regarding online experiments in general, Crump et al. [32] showed that the data collected online using a web-browser seemed mostly in line with laboratory results, so long as the experiment methods were solid.”
§ Adaptive trust calibration for human-AI collaboration > Materials and methods > Participants
What the sources say
- Not checked yetcites [32] MJC Crump, 2013, Evaluating amazon’s mechanical turk as a tool for experimental behavioral research, PLoS ONE source
hedged- Asserted: passes — The authors put it forward as true.
- Checkable: passes — It can be checked against evidence.
- Load-bearing: fails — The paper’s conclusions may not depend on it.
- Based: passes — The paper gives a reason why it holds.
Probably not a substantial claim. The paper’s conclusions may not depend on it.
A conclusion the paper draws from its own results — it cites no other source for it, so there is none to check. The quote shows it is in the paper.
In the paper
“This approach is to mitigate over-trust or under-trust, in contrast with the traditional approach of trying to maintain appropriate trust calibration with continuous system transparency.”
§ Adaptive trust calibration for human-AI collaboration > Introduction > Our approach: Adaptive trust calibration
plaindirect- Asserted: passes — The authors put it forward as true.
- Checkable: passes — It can be checked against evidence.
- Load-bearing: passes — The paper’s conclusions depend on it.
- Based: unclear — It is unclear why the paper says it holds.
It may state two separate claims as one.
In the paper
“Behaviors might not be observable if there is no interaction; nevertheless, behavioral measures are practical and can easily be used as a basis for modeling and prediction [25].”
§ Adaptive trust calibration for human-AI collaboration > Introduction > Measuring trust
What the sources say
- Not checked yetcites [25] K Drnec, 2016, From trust in automation to decision neuroscience: applying cognitive neuroscience methods to understand and improve interaction decisions involved in human automation interaction, Frontires In Human Neuroscience
plain- Asserted: passes — The authors put it forward as true.
- Checkable: passes — It can be checked against evidence.
- Load-bearing: unclear — It is unclear whether the paper’s conclusions depend on it.
- Based: passes — The paper gives a reason why it holds.
It may state two separate claims as one.
A conclusion the paper draws from its own results — it cites no other source for it, so there is none to check. The quote shows it is in the paper.
In the paper
“Instead of directly measuring Ptrust or , the first inequalities of (1) and (2) can be estimated by observing the user’s reliance behavior; thus, the trust calibration status can be detected, if the second inequalities of Pman and Pauto can be estimated.”
§ Adaptive trust calibration for human-AI collaboration > Introduction > Our approach: Adaptive trust calibration
hedgedconditional- Asserted: passes — The authors put it forward as true.
- Checkable: passes — It can be checked against evidence.
- Load-bearing: passes — The paper’s conclusions depend on it.
- Based: passes — The paper gives a reason why it holds.
It may state two separate claims as one.
What the paper did — it cites no source for this, so there is none to check. The quote shows it is in the paper.
In the paper
“194 participants joined the experiment online.”
§ Adaptive trust calibration for human-AI collaboration > Materials and methods > Participants
plainn = 194- Asserted: passes — The authors put it forward as true.
- Checkable: passes — It can be checked against evidence.
- Load-bearing: fails — The paper’s conclusions may not depend on it.
- Based: passes — The paper gives a reason why it holds.
Probably not a substantial claim. The paper’s conclusions may not depend on it.
What the paper did — it cites no source for this, so there is none to check. The quote shows it is in the paper.
In the paper
“As for the successful participants, their ages ranged from 20 to 69 years old (M = 43.25, SD = 14.01), 66 participants were male and 50 were females.”
§ Adaptive trust calibration for human-AI collaboration > Results
plainn = 16- Asserted: passes — The authors put it forward as true.
- Checkable: passes — It can be checked against evidence.
- Load-bearing: fails — The paper’s conclusions may not depend on it.
- Based: passes — The paper gives a reason why it holds.
Probably not a substantial claim. The paper’s conclusions may not depend on it. It may state two separate claims as one.
What the paper did — it cites no source for this, so there is none to check. The quote shows it is in the paper.
In the paper
“28 were in the NoTCC group, 18 in the visual group, 22 in the audio group, 29 in the verbal group, and 19 in the anthro. group.”
§ Adaptive trust calibration for human-AI collaboration > Results
plainn = 16- Asserted: passes — The authors put it forward as true.
- Checkable: passes — It can be checked against evidence.
- Load-bearing: fails — The paper’s conclusions may not depend on it.
- Based: passes — The paper gives a reason why it holds.
Probably not a substantial claim. The paper’s conclusions may not depend on it.
What the paper did — it cites no source for this, so there is none to check. The quote shows it is in the paper.
In the paper
“Seventy eight participants unintentionally moved the drone far from the area where the CKPs were located, and they failed to complete the tasks within the time limit.”
§ Adaptive trust calibration for human-AI collaboration > Results
plainn = 78- Asserted: passes — The authors put it forward as true.
- Checkable: passes — It can be checked against evidence.
- Load-bearing: fails — The paper’s conclusions may not depend on it.
- Based: passes — The paper gives a reason why it holds.
Probably not a substantial claim. The paper’s conclusions may not depend on it.
What the paper did — it cites no source for this, so there is none to check. The quote shows it is in the paper.
In the paper
“One hundred sixteen participants successfully inspected 15 CKPs or more within the time limit.”
§ Adaptive trust calibration for human-AI collaboration > Results
plainn = 116- Asserted: passes — The authors put it forward as true.
- Checkable: passes — It can be checked against evidence.
- Load-bearing: fails — The paper’s conclusions may not depend on it.
- Based: passes — The paper gives a reason why it holds.
Probably not a substantial claim. The paper’s conclusions may not depend on it.
What the paper did — it cites no source for this, so there is none to check. The quote shows it is in the paper.
In the paper
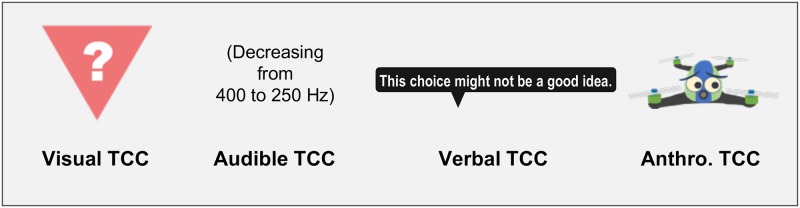
“Participants were randomly assigned to one of five groups with the corresponding TCCs: NoTCC group (without TCCs), visual group (with the visual sign TCC), audio group (with the audio TCC), verbal group (with the verbal TCC), and anthro. group (with the anthropomorphic TCC).”
§ Adaptive trust calibration for human-AI collaboration > Materials and methods > Procedure
plain- Asserted: passes — The authors put it forward as true.
- Checkable: passes — It can be checked against evidence.
- Load-bearing: passes — The paper’s conclusions depend on it.
- Based: passes — The paper gives a reason why it holds.
Probably not a substantial claim.
A conclusion the paper draws from its own results — it cites no other source for it, so there is none to check. The quote shows it is in the paper.
In the paper
“TCCs were given right after the behavior only if the participants were judged to over-trust, so that it would be easier for the participants to understand the implication of the cues and to move forward in the trust calibration process.”
§ Adaptive trust calibration for human-AI collaboration > Discussion > Adaptive method vs. continuous method
hedgeddirect- Asserted: passes — The authors put it forward as true.
- Checkable: passes — It can be checked against evidence.
- Load-bearing: passes — The paper’s conclusions depend on it.
- Based: passes — The paper gives a reason why it holds.
Probably not a substantial claim. It may state two separate claims as one.
In the paper
“However, automation could be beneficial beyond a better performance, such as for faster task completion, lighter workloads, fewer risks, etc. [3]”
§ Adaptive trust calibration for human-AI collaboration > Discussion > Limitations and future research
What the sources say
- Not checked yetcites [3] R Parasuraman, 1997, Humans and automation: Use, misuse, disuse, abuse, Human Factors source
hedgedconditional- Asserted: passes — The authors put it forward as true.
- Checkable: passes — It can be checked against evidence.
- Load-bearing: fails — The paper’s conclusions may not depend on it.
- Based: passes — The paper gives a reason why it holds.
Probably not a substantial claim. The paper’s conclusions may not depend on it. It may state two separate claims as one.
The paper states this without a source or data behind it here, so there is nothing to check it against. The quote shows it is in the paper.
In the paper
“Previous studies emphasized the importance of the system transparency for proper trust calibration.”
§ Adaptive trust calibration for human-AI collaboration > Conclusion
plaindirect- Asserted: passes — The authors put it forward as true.
- Checkable: passes — It can be checked against evidence.
- Load-bearing: passes — The paper’s conclusions depend on it.
- Based: fails — The paper may give no reason why it holds.
Probably not a substantial claim. The paper may give no reason why it holds.
A conclusion the paper draws from its own results — it cites no other source for it, so there is none to check. The quote shows it is in the paper.
In the paper
“These results indicated that adaptively presenting TCCs promoted appropriate trust calibration leading to the better performance in the bad weather period.”
§ Adaptive trust calibration for human-AI collaboration > Discussion > Performance
hedgeddirect- Asserted: passes — The authors put it forward as true.
- Checkable: passes — It can be checked against evidence.
- Load-bearing: passes — The paper’s conclusions depend on it.
- Based: passes — The paper gives a reason why it holds.
It may state two separate claims as one.
None of the sources cited for this claim have been checked yet.
In the paper
“It was obvious that the participants recognized these visually impressive TCCs; however, the results suggested that just being salient on the screen was not enough for some of the participants to change their choice behavior [31, 40].”
§ Adaptive trust calibration for human-AI collaboration > Discussion > Effects of TCCs to change the participants’ behavior
What the sources say
- Not checked yetcites [31] KR Laughery, 2014, A three-stage model summarizes product warning and environmental sign research, Safety Science source
- Not checked yetcites [40] VC Conzola, 2001, A Communication—Human Information Processing (C–HIP) approach to warning effectiveness in the workplace, Journal of Risk Research source
hedged- Asserted: passes — The authors put it forward as true.
- Checkable: passes — It can be checked against evidence.
- Load-bearing: passes — The paper’s conclusions depend on it.
- Based: passes — The paper gives a reason why it holds.
It may state two separate claims as one.
A conclusion the paper draws from its own results — it cites no other source for it, so there is none to check. The quote shows it is in the paper.
In the paper
“The proposed method deals with users’ behaviors to choose Auto or Manual and does not guarantee the convergence of the behaviors, which is the result of trust calibration by users.”
§ Adaptive trust calibration for human-AI collaboration > Discussion > Limitations and future research
plain- Asserted: passes — The authors put it forward as true.
- Checkable: passes — It can be checked against evidence.
- Load-bearing: fails — The paper’s conclusions may not depend on it.
- Based: passes — The paper gives a reason why it holds.
Probably not a substantial claim. The paper’s conclusions may not depend on it. It may state two separate claims as one.
In the paper
“Therefore, trust as the observable and rational choice behavior can be a product of believing that these benefits will outweigh the costs [5].”
§ Adaptive trust calibration for human-AI collaboration > Discussion > Limitations and future research
What the sources say
- Not checked yetcites [5] Adams BD, Bruyn LE, Houde S. Trust in automated systems literature review. Defence Research and Development Canada; 2003. Report No. CR-2003-096.
plaindirect- Asserted: passes — The authors put it forward as true.
- Checkable: passes — It can be checked against evidence.
- Load-bearing: fails — The paper’s conclusions may not depend on it.
- Based: passes — The paper gives a reason why it holds.
Probably not a substantial claim. The paper’s conclusions may not depend on it.
A conclusion the paper draws from its own results — it cites no other source for it, so there is none to check. The quote shows it is in the paper.
In the paper
“The feedback information given for each inspection was very important for the participants to make decisions.”
§ Adaptive trust calibration for human-AI collaboration > Discussion > Limitations and future research
plaindirect- Asserted: passes — The authors put it forward as true.
- Checkable: passes — It can be checked against evidence.
- Load-bearing: fails — The paper’s conclusions may not depend on it.
- Based: fails — The paper may give no reason why it holds.
Probably not a substantial claim. The paper’s conclusions may not depend on it. The paper may give no reason why it holds.
The paper states this without a source or data behind it here, so there is nothing to check it against. The quote shows it is in the paper.
In the paper
“The pothole inspection task in the experiment is a remote sensing task, and it would be quite difficult for the system to know the correct answer (ground truth) at the time of each inspection in practical situations because the only information available is the image data and the results of automatic recognition.”
§ Adaptive trust calibration for human-AI collaboration > Discussion > Limitations and future research
hedgeddirect- Asserted: passes — The authors put it forward as true.
- Checkable: passes — It can be checked against evidence.
- Load-bearing: passes — The paper’s conclusions depend on it.
- Based: passes — The paper gives a reason why it holds.
It may state two separate claims as one.
The authors state this as an assumption.
Pauto fluctuates more widely than Pman under changing weather conditions.
“Therefore, we assumed that Pauto would fluctuate more widely than Pman under changing weather conditions.”
The paper relies on this without support.
Trust is a latent construct and cannot be directly measured; measuring trust experimentally is difficult in general.
“Trust is a latent construct and cannot be directly measured; measuring trust experimentally is difficult in general.”
The paper relies on this without support.
Users often fail to calibrate their trust in the agent and end up in over-trust or under-trust.
“While an agent’s reliability changes for various reasons in an environment, the users often fail to calibrate their trust in the agent and end up in the status called over-trust or under-trust.”
The paper relies on this without support.
Self-report measures are too intrusive to be viable in applied settings.
“Most previous literature used self-report measures such as subjective rating with questionnaires [18] or rating scales [19, 20]; however, self-report measures are too intrusive to be viable in applied settings.”
The paper relies on this without support.
Physiological and neural measures usually require special hardware.
“Although these measures can be used for dynamic tracking of trust, they usually require special hardware.”
The paper relies on this without support.
TCC rates are a valid indicator of over-trust or trust calibration status.
“TCC rates in the verbal TCC group were higher in the early part of the period and gradually decreased. This indicates that over-trust decreased during this period.”
The authors state this as an assumption.
Manual accuracy can be used to estimate Pman.
“The results of the manual accuracy were consistent with our assumption to estimate Pman − Pauto in this experiment.”
Claims other papers make about this one
Each is checked against this paper’s own text: does it say what the citing paper says it does?
The source backs part of the claim, not all of it — or backs it for a different population, condition or comparison.
In the citing paper
“Notwithstanding a clear agenda on the issues that we should explore further, we still have limited evidence-based knowledge of the context, design, and psychological mechanisms that would craft an optimal human–ai team15–17.”
From Experimental evidence of effective human–AI collaboration in medical decision-making (2022) · cites this paper as [16]
Experimental — accuracy not yet measuredThe source backs part of the claim, not all of it — or backs it for a different population, condition or comparison.
In the citing paper
“They also found that giving additional trigger signals was effective in resolving this problem [16].”
From Dynamic Selection of Reliance Calibration Cues With AI Reliance Model (2023) · cites this paper as [16]
Experimental — accuracy not yet measuredThe source backs part of the claim, not all of it — or backs it for a different population, condition or comparison.
In the citing paper
“Avoiding misplaced trust in AI results is not essentially a technical challenge (Okamura and Yamada 2020).”
From Keeping the organization in the loop: a socio-technical extension of human-centered artificial intelligence (2023) · cites this paper as Okamura and Yamada 2020
Experimental — accuracy not yet measuredThe cited source says what the claim attributes to it.
In the citing paper
“In their experiment, participants did not change their over-reliance in spite of a reliability indicator being continuously displayed to them.”
From Dynamic Selection of Reliance Calibration Cues With AI Reliance Model (2023) · cites this paper as [16]
The cited source says what the claim attributes to it.
In the citing paper
“Various interventions have been explored to foster trust calibration, such as displaying confidence scores that indicate the likelihood of a model's outputs being correct to end users [124], and designing adaptive monitoring systems that visually prompt users to calibrate their trust when over-trust or under-trust is detected during human-AI collaboration [87]”
From Understanding the Practices, Perceptions, and (Dis)Trust of Generative AI among Instructors: A Mixed-methods Study in the U.S. Higher Education (2025) · cites this paper as [87]
Statistics recomputed
Every reported test result, recomputed from its test statistic and degrees of freedom. A result shows as not adding up only once an independent check has confirmed it.
- ConsistentF(1, 111) = 51.69reported p < .01 · recomputed p < .001
“F(1, 111) = 51.69, p < .01”
- ConsistentF(4, 111) = 4.86reported p < .01 · recomputed p = .001
“F(4, 111) = 4.86, p < .01”
- ConsistentF(1, 17) = 9.2reported p < .01 · recomputed p = .008
“F(1, 17) = 9.20, p < .01”
- ConsistentF(1, 21) = 5.54reported p = .03 · recomputed p = .028
“F(1, 21) = 5.54, p = .03”
- ConsistentF(1, 28) = 62.9reported p < .001 · recomputed p < .001
“F(1, 28) = 62.9, p < .001”
- ConsistentF(1, 18) = 8.55reported p < .01 · recomputed p = .009
“F(1, 18) = 8.55, p < .01”
- Consistentt(114) = -1.08reported p = .28 · recomputed p = .282
“t(114) = −1.08, p = .28”
- Consistentt(71) = -2.17reported p = .03 · recomputed p = .033
“t(71) = −2.17, p = .03”
- Consistentt(200) = 17.79reported p < .01 · recomputed p < .001
“t(200) = 17.79, p < .01”
Self-check
Percentages, sums and reported differences re-computed from the paper’s own numbers.
Each contradiction between two passages listed here was confirmed by an independent check.
Rated minor: it would not touch a result — a value no result rests on, a p-value that stays on the same side of the significance level, or a conflict that is clerical, resolved elsewhere in the paper, or outside its own findings.
In the paper
§ Adaptive trust calibration for human-AI collaboration > Results
“TCCs were not presented in the period from the 7th CKP to the 9th CKP”
§ Adaptive trust calibration for human-AI collaboration > Results
“| Visual TCC | 0.78 (0.10) | 0.67 (0.11) | 0.56 (0.12) | 0.67 (0.11) | 0.67 (0.11) | 0.50 (0.12) | 0.56 (0.12) |”
Citations
Cites
ImageNet classification with deep convolutional neural networks
Krizhevsky, A., Sutskever, I., & Hinton, G. E. (2017) · Communications of the ACM · doi:10.1145/3065386 · Cited by 112,155
Trust in Automation: Designing for Appropriate Reliance
Lee, J. D., & See, K. A. (2004) · Human Factors: The Journal of the Human Factors and Ergonomics Society · doi:10.1518/hfes.46.1.50_30392 · Cited by 6,605
Humans and automation: Use, misuse, disuse, abuse
Parasuraman, R., & Riley, V. (1997) · Human Factors: The Journal of the Human Factors and Ergonomics Society · doi:10.1518/001872097778543886 · Cited by 4,554
A model for types and levels of human interaction with automation
Parasuraman, R., Sheridan, T. B., & Wickens, C. D. (2000) · IEEE Transactions on Systems, Man, and Cybernetics - Part A: Systems and Humans · doi:10.1109/3468.844354 · Cited by 4,195 · cited 1×
“A possible explanation for the result could be made by discussing models for the trust process [1, 27, 41].”
BackgroundTrust in Automation: Integrating Empirical Evidence on Factors That Influence Trust
Hoff, K. A., & Bashir, M. (2015) · Human Factors: The Journal of the Human Factors and Ergonomics Society · doi:10.1177/0018720814547570 · Cited by 2,817
Calculation of signal detection theory measures
Stanislaw, H., & Todorov, N. (1999) · Behavior Research Methods, Instruments, & Computers · doi:10.3758/bf03207704 · Cited by 2,673
A Meta-Analysis of Factors Affecting Trust in Human-Robot Interaction
Hancock, P. A., Billings, D. R., Schaefer, K. E., Chen, J. Y. C., de Visser, E. J., & Parasuraman, R. (2011) · Human Factors: The Journal of the Human Factors and Ergonomics Society · doi:10.1177/0018720811417254 · Cited by 2,051 · cited 1×
“[10] examined factors that affect trust by applying meta-analysis methods to existing empirical studies.”
MethodFoundations for an Empirically Determined Scale of Trust in Automated Systems
Jian, J.-Y., Bisantz, A. M., & Drury, C. G. (2000) · International Journal of Cognitive Ergonomics · doi:10.1207/s15327566ijce0401_04 · Cited by 1,799
Evaluating amazon’s mechanical turk as a tool for experimental behavioral research
Crump, M. J. C., McDonnell, J. V., & Gureckis, T. M. (2013) · PLoS ONE · doi:10.1371/journal.pone.0057410 · Cited by 1,617
The mind in the machine: Anthropomorphism increases trust in an autonomous vehicle
Waytz, A., Heafner, J., & Epley, N. (2014) · Journal of Experimental Social Psychology · doi:10.1016/j.jesp.2014.01.005 · Cited by 1,439
Research works printed but not linked: 1
- Adams BD, Bruyn LE, Houde S. Trust in automated systems literature review. Defence Research and Development Canada; 2003. Report No. CR-2003-096.
Cited by
Sorted by citations
Trust in AI: progress, challenges, and future directions
Afroogh, S., Akbari, A., Malone, E., Kargar, M., & Alambeigi, H. (2024) · Humanities and Social Sciences Communications · doi:10.1057/s41599-024-04044-8 · Cited by 718
Six Human-Centered Artificial Intelligence Grand Challenges
Ozmen Garibay, O., Winslow, B., Andolina, S., Antona, M., Bodenschatz, A., Coursaris, C., Falco, G., Fiore, S. M., Garibay, I., Grieman, K., et al. (2023) · International Journal of Human–Computer Interaction · doi:10.1080/10447318.2022.2153320 · Cited by 501
Experimental evidence of effective human–AI collaboration in medical decision-making
Reverberi, C., Rigon, T., Solari, A., Hassan, C., Cherubini, P., GI Genius CADx Study Group, Antonelli, G., Awadie, H., Bernhofer, S., Carballal, S., et al. (2022) · Scientific Reports · doi:10.1038/s41598-022-18751-2 · Cited by 281
Trust in Robots: Challenges and Opportunities
Kok, B. C., & Soh, H. (2020) · Current Robotics Reports · doi:10.1007/s43154-020-00029-y · Cited by 245
Deciding Fast and Slow: The Role of Cognitive Biases in AI-assisted Decision-making
Rastogi, C., Zhang, Y., Wei, D., Varshney, K. R., Dhurandhar, A., & Tomsett, R. (2022) · Proceedings of the ACM on Human-Computer Interaction · doi:10.1145/3512930 · Cited by 216
Metadata
- Authors
- Okamura, K., & Yamada, S.
- Affiliations
- The Graduate University for Advanced Studies, SOKENDAI (JP)
- National Institute of Informatics (JP)
- Corresponding author
- Okamura, Kazuo
- Venue
- PLOS ONE
- Publisher
- Public Library of Science (PLoS)
- Published
- 2020-02-21
- Volume
- 15
- Issue
- 2
- Pages
- e0229132
- ISSN
- 1932-6203 (ISSN-L)
- PMC
- PMC7034851
- OpenAlex
- W2954555759
- Semantic Scholar
- acc10c9ebf9456d71474d79a61b2f0af3d3b29b2
- Cited by
- 239
- References
- 43
- Citations by year
- 2026: 65 · 2025: 56 · 2024: 46 · 2023: 31 · 2022: 18 · 2021: 16 · 2020: 7
- FWCI
- 19.67
- Type
- journal article
- Language
- en
- Open access
- gold
- doi.org
- Licence
- Locations
- PLoS ONE (publishedVersion, cc-by)
- Europe PMC (PubMed Central) (publishedVersion, cc-by)
- PubMed Central (publishedVersion, cc-by)
- PubMed (publishedVersion)
- DOAJ (DOAJ: Directory of Open Access Journals) (submittedVersion, cc-by-sa)
- The Japanese Society for Artificial Intelligence
- Funders
- Japan Society for the Promotion of Science (26118005)
- Topics
- Social Sciences › Human Factors and Ergonomics › Human-Automation Interaction and Safety
- Social Sciences › Psychology › Social Psychology › Social Robot Interaction and HRI
- Physical Sciences › Computer Science › Human-Computer Interaction › Usability and User Interface Design
- Keywords
- trust calibration, human-AI collaboration, cognitive cues, adaptive prompts, system transparency, trust in AI, drone inspection, human-AI decision-making
- MeSH terms
- Adult, Aged, Artificial Intelligence, Calibration, Female, Humans, Male, Man-Machine Systems, Middle Aged, Surveys and Questionnaires, Young Adult
About these checks
Registry, retraction, Cites and statistics results are computed, not judged, with one exception: a printed reference that no index lists is read once by a model before it counts as a citation error. Claims are extracted by a model and kept only when their quote appears verbatim in the text; each cited source is then checked, with a model’s help, for whether it says what the claim relies on. Those verdicts can be wrong — read the claim’s quote and the cited source before relying on one.
A language model drew the claims from the paper on 2026-10-09, under version 3 of the claim definition (model deepseek-v4.1-flash, prompt extract-v3).
A second model labelled each claim on 2026-10-09 (model jev-1.13-20260917, definition revision gold-guideline-v0.2).
Statistics and arithmetic are recomputed, not judged.
Confidence bands are shown only for fields calibrated on our annotated test set. None is calibrated yet, so no band is shown.
What counts as a claim ›How we measure confidence ›How we check this ›
Are you an author, or do you see a problem with this page? Request a review
