

The DOI matches its Crossref record; 6 of the 6 references it cites were found in a registry or an index.
Comparative MD simulations and advanced analytics based studies on wild-type and hot-spot mutant A59G HRas
Open accessPublished version of a preprint
Abstract
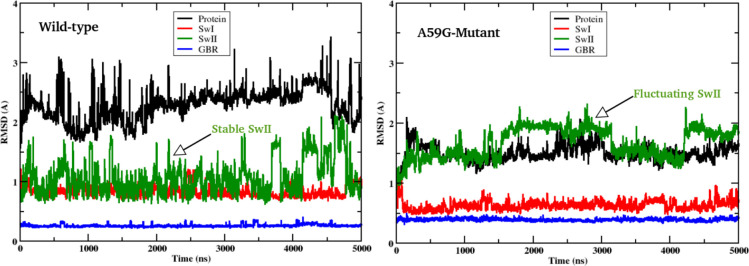
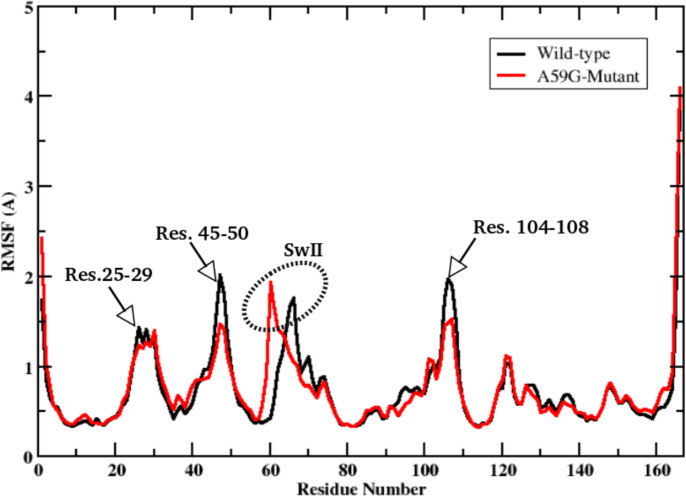
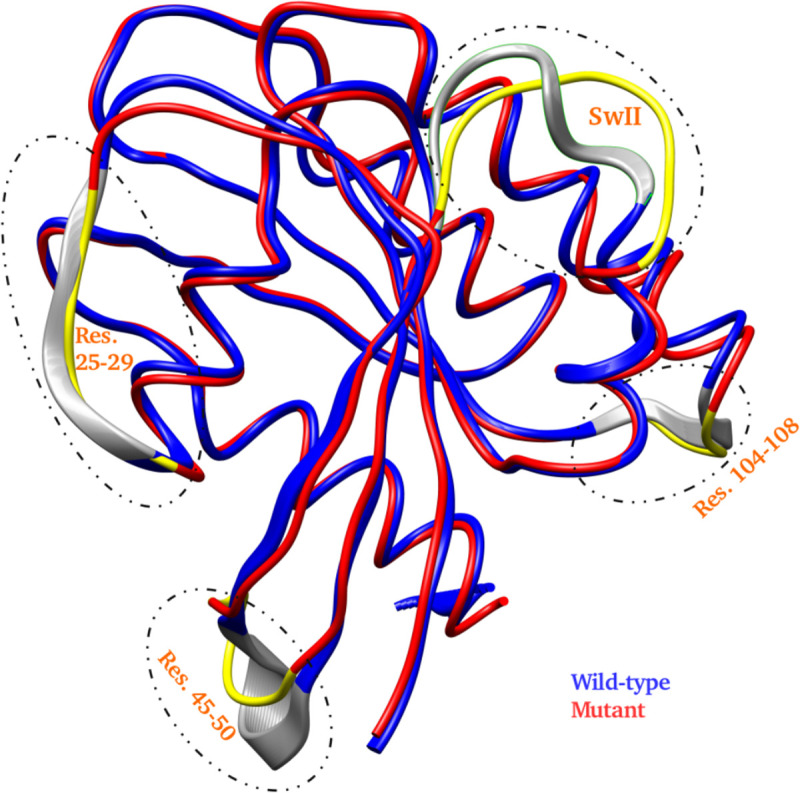
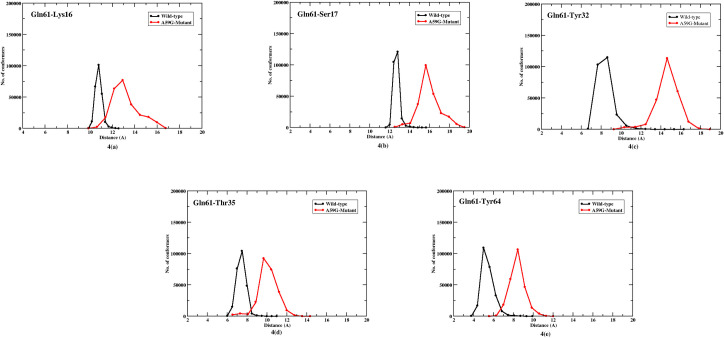
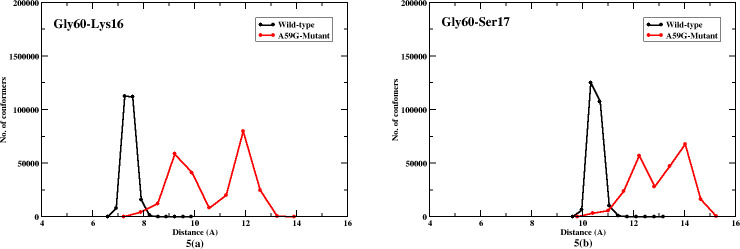
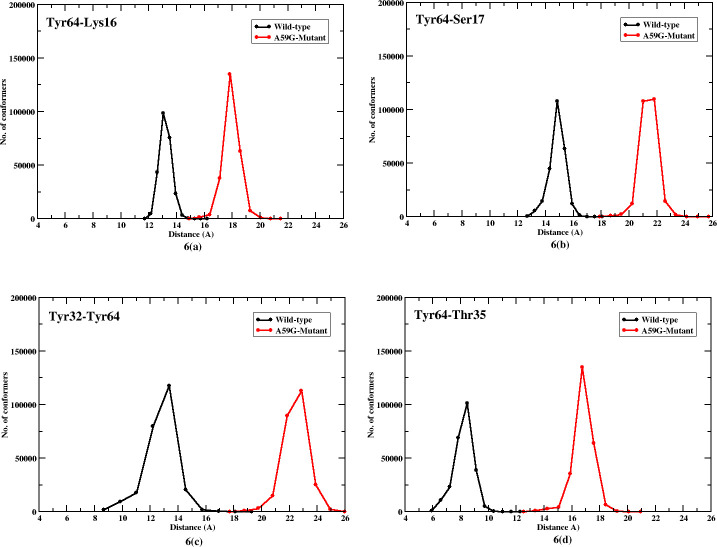
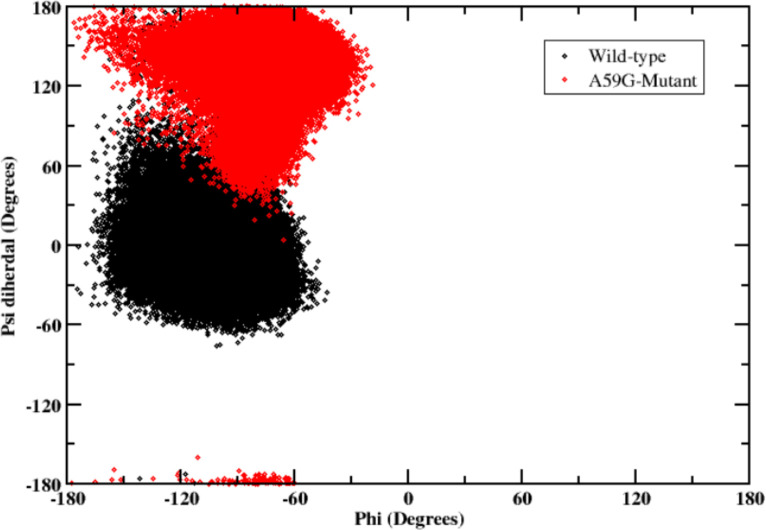
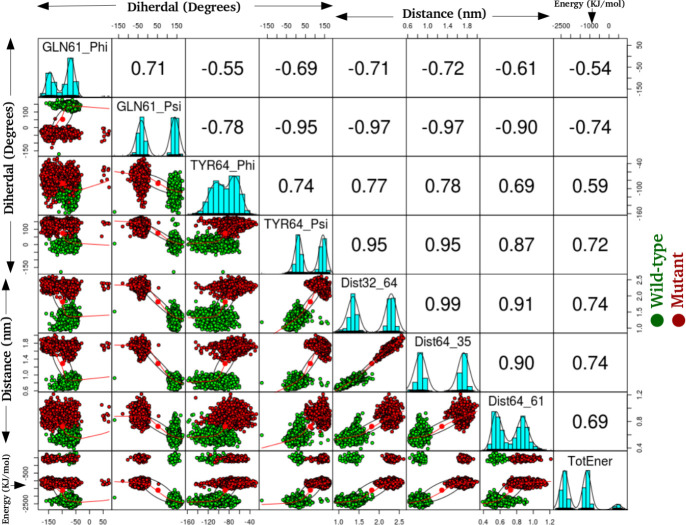
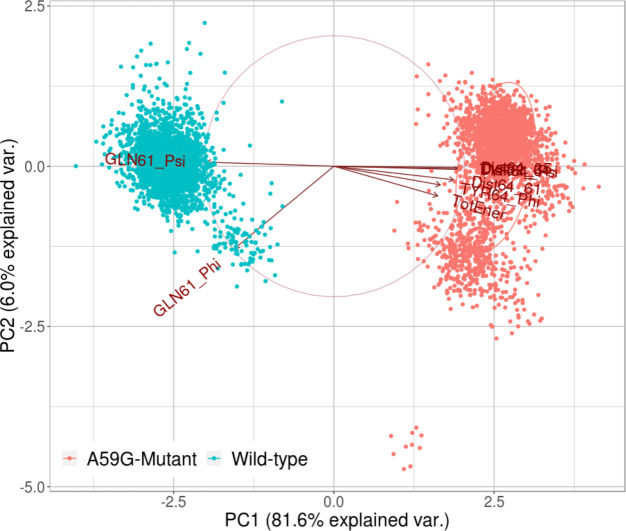
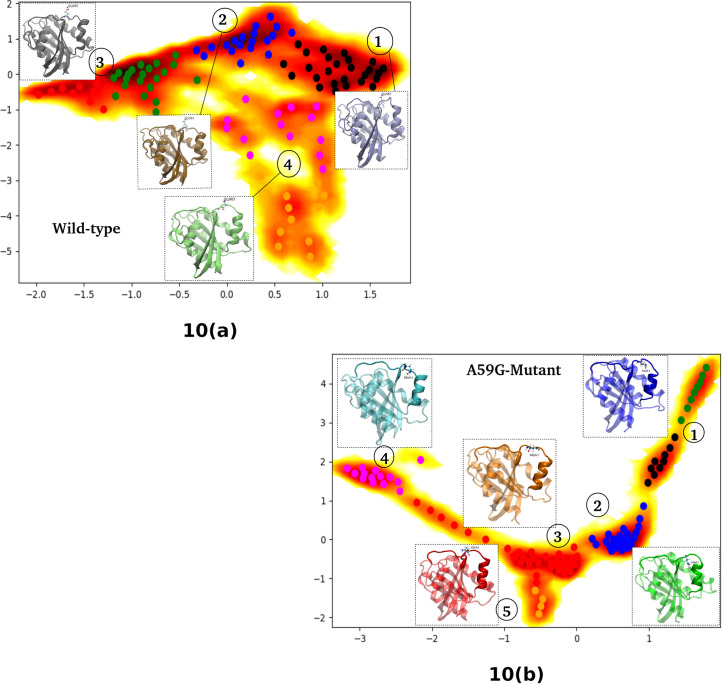
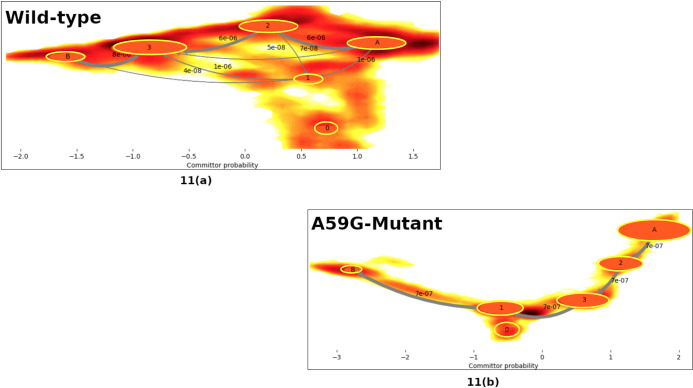
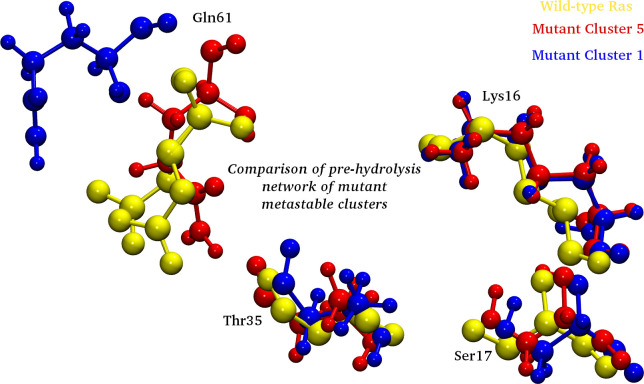
The Ras family of proteins is known to play an important role in cellular signal transduction. The oncoprotein Ras is also found to be mutated in ~90% of the pancreatic cancers, of which G12V, G13V, A59G and Q61L are the known hot-spot mutants. These ubiquitous proteins fall in the family of G-proteins, and hence switches between active GTP bound and inactive GDP bound states, which is hindered in most of its oncogenic mutant counterparts. Moreover, Ras being a GTPase has an intrinsic property to hydrolyze GTP to GDP, which is obstructed due to mutations and lends the mutants stuck in constitutively active state leading to oncogenic behavior. In this regard, the present study aims to understand the dynamics involved in the hot-spot mutant A59G-Ras using long 10μs classical MD simulations (5μs for each of the wild-type and mutant systems) and comparing the same with its wild-type counterpart. Advanced analytics using Markov State Model (MSM) based approach has been deployed to comparatively understand the transition path for the wild-type and mutant systems. Roles of crucial residues like Tyr32, Gln61 and Tyr64 have also been established using multivariate PCA analyses. Furthermore, this multivariate PCA analysis also provides crucial features which may be used as reaction coordinates for biased simulations for further studies. The absence of formation of pre-hydrolysis network is also reported for the mutant conformation, using the distance-based analyses (between crucial residues) of the conserved regions. The implications of this study strengthen the hypothesis that the disruption of the pre-hydrolysis network in the mutant A59G ensemble might lead to permanently active oncogenic conformation in the mutant conformers.
Overview
The claims and statistics of this paper haven’t been checked yet.
Run the check — free, no account needed. It reads the open-access text and checks the sources it cites.
Integrity signals
Registry
Cites
Statistics
Figures
Verification
Claims the paper makes
The claims and statistics of this paper haven’t been checked yet.
Run the check — free, no account needed. It reads the open-access text and checks the sources it cites.
Self-check
Percentages, sums and reported differences re-computed from the paper’s own numbers.
The self-check needs the paper’s full text.
Citations
Cites
Ras oncogenes: split personalities
Karnoub, A. E., & Weinberg, R. A. (2008) · Nature Reviews Molecular Cell Biology · doi:10.1038/nrm2438 · Cited by 1,467
Markov models of molecular kinetics: Generation and validation
Prinz, J.-H., Wu, H., Sarich, M., Keller, B., Senne, M., Held, M., Chodera, J. D., Schütte, C., & Noé, F. (2011) · The Journal of Chemical Physics · doi:10.1063/1.3565032 · Cited by 1,275
Stephen, A. G., Esposito, D., Bagni, R. K., & McCormick, F. (2014) · Cancer Cell · doi:10.1016/j.ccr.2014.02.017 · Cited by 795
Markov state models of biomolecular conformational dynamics
Chodera, J. D., & Noé, F. (2014) · Current Opinion in Structural Biology · doi:10.1016/j.sbi.2014.04.002 · Cited by 776
Allele-specific inhibitors inactivate mutant KRAS G12C by a trapping mechanism
Lito, P., Solomon, M., Li, L.-S., Hansen, R., & Rosen, N. (2016) · Science · doi:10.1126/science.aad6204 · Cited by 691
Ras Conformational Ensembles, Allostery, and Signaling
Lu, S., Jang, H., Muratcioglu, S., Gursoy, A., Keskin, O., Nussinov, R., & Zhang, J. (2016) · Chemical Reviews · doi:10.1021/acs.chemrev.5b00542 · Cited by 355
Research works printed but not linked: 61
- E Castellano, 2011, Functional specificity of ras isoforms: so similar but so different., Genes Cancer, 2, 216, 10.1177/1947601911408081 · DOI
- GA Hobbs, 2016, RAS isoforms and mutations in cancer at a glance, J Cell Sci, 129, 1287, 10.1242/jcs.182873 · DOI · Paper page
- MF Olson, 2000, Ras protein signalling., Semin Immunol., 12, 63, 10.1006/smim.2000.0208 · DOI
- Y Takai, 2001, Small GTP-binding proteins., Physiol Rev, 81, 153, 10.1152/physrev.2001.81.1.153 · DOI
- D Matallanas, 2011, Raf family kinases: old dogs have learned new tricks., Genes Cancer, 2, 232, 10.1177/1947601911407323 · DOI
- PJ Kraulis, 1994, Solution structure and dynamics of ras p21.GDP determined by heteronuclear three- and four-dimensional NMR spectroscopy, Biochemistry, 33, 3515, 10.1021/bi00178a008 · DOI
- MV Milburn, 1990, Molecular switch for signal transduction: structural differences between active and inactive forms of protooncogenic ras proteins, Science, 247, 939, 10.1126/science.2406906 · DOI
- M. Barbacid, 1987, ras genes., Annu Rev Biochem, 56, 779, 10.1146/annurev.bi.56.070187.004023 · DOI · Paper page
- F Raimondi, 2011, Nucleotide binding switches the information flow in ras GTPases., PLoS Comput Biol, 7, e1001098, 10.1371/journal.pcbi.1001098 · DOI
- DK Simanshu, 2017, RAS Proteins and Their Regulators in Human Disease, Cell, 170, 17, 10.1016/j.cell.2017.06.009 · DOI · Paper page
- R Gasper, 2010, GTPase activity of Di-Ras proteins is stimulated by Rap1GAP proteins., Small GTPases., 1, 133, 10.4161/sgtp.1.3.14742 · DOI
- DS Goodsell, 1999, The molecular perspective: the ras oncogene, Oncologist, 4, 263, 10.1634/theoncologist.4-3-263 · DOI
- BJ Grant, 2009, Ras conformational switching: simulating nucleotide-dependent conformational transitions with accelerated molecular dynamics., PLoS Comput Biol., 5, e1000325, 10.1371/journal.pcbi.1000325 · DOI
- K Scheffzek, 1997, The Ras-RasGAP complex: structural basis for GTPase activation and its loss in oncogenic Ras mutants, Science, 277, 333, 10.1126/science.277.5324.333 · DOI · Paper page
- JL Bos, 2007, GEFs and GAPs: critical elements in the control of small G proteins, Cell, 129, 865, 10.1016/j.cell.2007.05.018 · DOI · Paper page
- TM Glennon, 2000, How does GAP catalyze the GTPase reaction of Ras? A computer simulation study, Biochemistry, 39, 9641, 10.1021/bi000640e · DOI
- J Cherfils, 1999, GEFs: structural basis for their activation of small GTP-binding proteins, Trends Biochem Sci, 24, 306, 10.1016/S0968-0004(99)01429-2 · DOI
- AJ Scheidig, 1999, The pre-hydrolysis state of p21(ras) in complex with GTP: new insights into the role of water molecules in the GTP hydrolysis reaction of ras-like proteins., Structure, 7, 1311, 10.1016/S0969-2126(00)80021-0 · DOI
- H te Heesen, 2007, Role of the arginine finger in Ras.RasGAP revealed by QM/MM calculations, FEBS Lett, 581, 5677, 10.1016/j.febslet.2007.11.026 · DOI
- MG Khrenova, 2015, Hydrolysis of Guanosine Triphosphate (GTP) by the Ras·GAP Protein Complex: Reaction Mechanism and Kinetic Scheme., J Phys Chem B, 119, 12838, 10.1021/acs.jpcb.5b07238 · DOI
- S Schubbert, 2007, Hyperactive Ras in developmental disorders and cancer, Nat Rev Cancer, 7, 295, 10.1038/nrc2109 · DOI · Paper page
- S Lukman, 2010, The distinct conformational dynamics of K-Ras and H-Ras A59G., PLoS Comput Biol., 6, e1000922, 10.1371/journal.pcbi.1000922 · DOI
- BJ Grant, 2011, Novel allosteric sites on Ras for lead generation., PLoS One., 6, e25711, 10.1371/journal.pone.0025711 · DOI
- HJ Hocker, Andrographolide derivatives inhibit guanine nucleotide exchange and abrogate oncogenic Ras function, Proc Natl Acad Sci U S A, 110, 10201, 10.1073/pnas.1300016110 · DOI
- A Shurki, 2004, Why does the Ras switch "break" by oncogenic mutations?, Proteins, 55, 1, 10.1002/prot.20004 · DOI
- C Gao, 2013, Impact of Mutations on K-Ras-p120GAP Interaction., Computational Molecular Bioscience, 3, 9, 10.4236/cmb.2013.32002 · DOI
- AA Adjei, 2001, Blocking oncogenic Ras signaling for cancer therapy, J Natl Cancer Inst, 93, 1062, 10.1093/jnci/93.14.1062 · DOI
- J. Downward, 2003, Targeting RAS signalling pathways in cancer therapy, Nat Rev Cancer, 3, 11, 10.1038/nrc969 · DOI
- CK Foley, 1992, Simulation of the solution structure of the H-ras p21-GTP complex., Biochemistry, 31, 4951, 10.1021/bi00136a005 · DOI
- JF Díaz, 1995, Molecular dynamics simulation of the solution structures of Ha-ras-p21 GDP and GTP complexes: flexibility, possible hinges, and levers of the conformational transition, Biochemistry, 34, 12038, 10.1021/bi00037a047 · DOI
- S Kuppens, 2003, Conformational states of the switch I region of Ha-ras-p21 in hinge residue mutants studied by fluorescence lifetime and fluorescence anisotropy measurements, Protein Sci, 12, 930, 10.1110/ps.0236303 · DOI
- BL Grigorenko, 2007, Mechanisms of guanosine triphosphate hydrolysis by Ras and Ras-GAP proteins as rationalized by ab initio QM/MM simulations, Proteins, 66, 456, 10.1002/prot.21228 · DOI
- F Xia, 2011, The specific vibrational modes of GTP in solution and bound to Ras: a detailed theoretical analysis by QM/MM simulations, Phys Chem Chem Phys, 13, 21451, 10.1039/c1cp22741f · DOI
- P Prakash, 2014, Overview of simulation studies on the enzymatic activity and conformational dynamics of the GTPase Ras., Mol Simul., 40, 839, 10.1080/08927022.2014.895000 · DOI
- N Sharma, 2014, Probing the wild-type HRas activation mechanism using steered molecular dynamics, understanding the energy barrier and role of water in the activation, Eur Biophys J, 43, 81, 10.1007/s00249-014-0942-4 · DOI
- P Prakash, 2012, The role of conserved waters in conformational transitions of Q61H K-ras., PLoS Comput Biol., 8, e1002394, 10.1371/journal.pcbi.1002394 · DOI
- EF Pai, 1990, Refined crystal structure of the triphosphate conformation of H-ras p21 at 1.35 A resolution: implications for the mechanism of GTP hydrolysis, EMBO J, 9, 2351, 10.1002/j.1460-2075.1990.tb07409.x · DOI
- MJ Smith, 2013, NMR-based functional profiling of RASopathies and oncogenic RAS mutations, Proc Natl Acad Sci U S A, 110, 4574, 10.1073/pnas.1218173110 · DOI · Paper page
- MG Khrenova, 2014, Modeling the role of G12V and G13V Ras mutations in the Ras-GAP-catalyzed hydrolysis reaction of guanosine triphosphate, Biochemistry, 53, 7093, 10.1021/bi5011333 · DOI
- BL Grigorenko, 2005, QM/MM modeling the Ras-GAP catalyzed hydrolysis of guanosine triphosphate, Proteins, 60, 495, 10.1002/prot.20472 · DOI
- F Martín-García, 2012, The Role of Gln61 in HRas GTP hydrolysis: a quantum mechanics/molecular mechanics study, Biophys J, 102, 152, 10.1016/j.bpj.2011.11.4005 · DOI
- S Muraoka, 2012, Crystal structures of the state 1 conformations of the GTP-bound H-Ras protein and its oncogenic G12V and Q61L mutants., FEBS Lett, 586, 1715, 10.1016/j.febslet.2012.04.058 · DOI
- BE Hall, 2002, The structural basis for the transition from Ras-GTP to Ras-GDP, Proc Natl Acad Sci U S A, 99, 12138, 10.1073/pnas.192453199 · DOI
- N Sharma, 2017, Differentiating the pre-hydrolysis states of wild-type and A59G mutant HRas: An insight through MD simulations, Comput Biol Chem, 69, 96, 10.1016/j.compbiolchem.2017.05.008 · DOI
- FC Bernstein, 1977, The Protein Data Bank: a computer-based archival file for macromolecular structures, J Mol Biol, 112, 535, 10.1016/S0022-2836(77)80200-3 · DOI
- B Hess, 2008, GROMACS 4: Algorithms for Highly Efficient, Load-Balanced, and Scalable Molecular Simulation., J Chem Theory Comput., 4, 435, 10.1021/ct700301q · DOI
- V Hornak, 2006, Comparison of multiple Amber force fields and development of improved protein backbone parameters, Proteins, 65, 712, 10.1002/prot.21123 · DOI
- AW Schüttelkopf, 2004, PRODRG: a tool for high-throughput crystallography of protein-ligand complexes, Acta Crystallogr D Biol Crystallogr, 60, 1355, 10.1107/S0907444904011679 · DOI
- EF Pettersen, 2004, UCSF Chimera—a visualization system for exploratory research and analysis, J Comput Chem, 25, 1605, 10.1002/jcc.20084 · DOI
- W Humphrey, 1996, VMD: visual molecular dynamics, J Mol Graph, 14, 33, 10.1016/0263-7855(96)00018-5 · DOI · Paper page
- MK Scherer, 2015, PyEMMA 2: A Software Package for Estimation, Validation, and Analysis of Markov Models., J Chem Theory Comput., 11, 5525, 10.1021/acs.jctc.5b00743 · DOI
- JD Chodera, 2007, Automatic discovery of metastable states for the construction of Markov models of macromolecular conformational dynamics, J Chem Phys, 126, 155101, 10.1063/1.2714538 · DOI
- A Sirur, 2016, Markov state models of protein misfolding, J Chem Phys, 144, 075101, 10.1063/1.4941579 · DOI
- H Wu, 2020, Variational Approach for Learning Markov Processes from Time Series Data, J Nonlinear Sci, 30, 23, 10.1007/s00332-019-09567-y · DOI
- F Noé, 2009, Constructing the equilibrium ensemble of folding pathways from short off-equilibrium simulations. Version 2, Proc Natl Acad Sci U S A, 106, 19011, 10.1073/pnas.0905466106 · DOI · Paper page
- B Ford, 2006, Structure of a transient intermediate for GTP hydrolysis by ras, Structure, 14, 427, 10.1016/j.str.2005.12.010 · DOI
- J Chen, 2020, Unveiling conformational dynamics changes of H-Ras induced by mutations based on accelerated molecular dynamics, Phys Chem Chem Phys
- DK Menyhárd, 2020, Structural impact of GTP binding on downstream KRAS signaling., Chem Sci., 11, 9272, 10.1039/D0SC03441J · DOI
- SF Altschul, 1990, Basic local alignment search tool, J Mol Biol, 215, 403, 10.1016/S0022-2836(05)80360-2 · DOI · Paper page
- T. Pantsar, 2019, The current understanding of KRAS protein structure and dynamics, Comput Struct Biotechnol J, 18, 189, 10.1016/j.csbj.2019.12.004 · DOI
- J Lu, 2018, KRAS Switch Mutants D33E and A59G Crystallize in the State 1 Conformation., Biochemistry, 57, 324, 10.1021/acs.biochem.7b00974 · DOI
Metadata
- Authors
- Sharma, N., Sonavane, U., & Joshi, R.
- Affiliations
- Centre for Development of Advanced Computing (IN)
- Corresponding author
- Joshi, Rajendra
- Venue
- PLOS ONE
- Publisher
- Public Library of Science (PLoS)
- Published
- 2020-10-16
- Volume
- 15
- Issue
- 10
- Pages
- e0234836
- ISSN
- 1932-6203 (ISSN-L)
- PMC
- PMC7567374
- OpenAlex
- W3092863994
- Cited by
- 7
- References
- 6
- Citations by year
- 2025: 1 · 2024: 2 · 2023: 4
- FWCI
- 0.32
- Type
- journal article
- Language
- en
- Open access
- gold
- doi.org
- Licence
- Locations
- PLoS ONE (publishedVersion, cc-by)
- bioRxiv (Cold Spring Harbor Laboratory) (acceptedVersion, cc-by)
- PubMed Central (publishedVersion, cc-by)
- PubMed (publishedVersion)
- RePEc: Research Papers in Economics (submittedVersion)
- DOAJ (DOAJ: Directory of Open Access Journals) (submittedVersion, cc-by-sa)
- Funders
- National Patient Safety Foundation
- Ministry of Electronics and Information technology
- Topics
- Life Sciences › Biochemistry, Genetics and Molecular Biology › Molecular Biology › Protein Kinase Regulation and GTPase Signaling
- Life Sciences › Biochemistry, Genetics and Molecular Biology › Molecular Biology › Protein Structure and Dynamics
- Life Sciences › Biochemistry, Genetics and Molecular Biology › Molecular Biology › Receptor Mechanisms and Signaling
- Keywords
- HRAS, Ras GTPase, GTP hydrolysis, GTP/GDP binding, Markov state models, transition pathways, reaction coordinate, pancreatic cancer
- MeSH terms
- Guanosine Diphosphate, Guanosine Triphosphate, Humans, Hydrolysis, Mutation, Proto-Oncogene Proteins p21(ras), Molecular Dynamics Simulation
About these checks
Registry, retraction, Cites and statistics results are computed, not judged, with one exception: a printed reference that no index lists is read once by a model before it counts as a citation error. Claims are extracted by a model and kept only when their quote appears verbatim in the text; each cited source is then checked, with a model’s help, for whether it says what the claim relies on. Those verdicts can be wrong — read the claim’s quote and the cited source before relying on one.
Statistics and arithmetic are recomputed, not judged.
Confidence bands are shown only for fields calibrated on our annotated test set. None is calibrated yet, so no band is shown.
What counts as a claim ›How we measure confidence ›How we check this ›
Are you an author, or do you see a problem with this page? Request a review
How to cite
Cite CoChat for the checks on this page, and the paper for its own findings.
- This page
- CoChat. (2026). Citation check: Comparative MD simulations and advanced analytics based studies on wild-type and hot-spot mutant A59G HRas. https://app.cochat.ai/papers/10.1371/journal.pone.0234836
- The paper
- Sharma, N., Sonavane, U., & Joshi, R. (2020). Comparative MD simulations and advanced analytics based studies on wild-type and hot-spot mutant A59G HRas. PLOS ONE. https://doi.org/10.1371/journal.pone.0234836
