

The DOI matches its Crossref record; 36 of the 53 references it cites were found in a registry or an index, and 1 are not checked yet; 3 of the 26 sources its claims cite were checked for support.
igraph 1.0 enables fast and robust network analysis across programming languages
Open accessAbstract
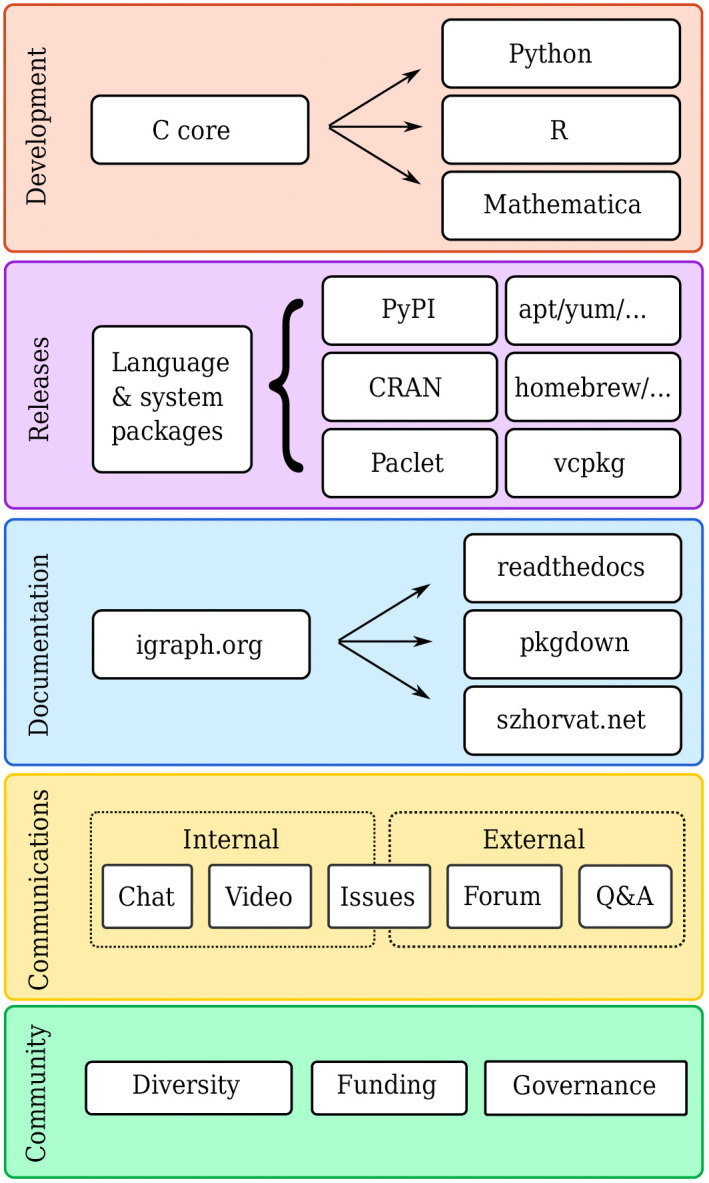
Networks or graphs are widely used across the sciences to represent relationships of many kinds. The igraph ( https://igraph.org ) software library supports graph construction, analysis, and visualisation, combining fast and robust performance with a low entry barrier. igraph pairs a fast core written in C with beginner-friendly interfaces in Python, R, and Mathematica. After twenty years of development, igraph 1.0 has been released, enabling public access to a robust and stable network analysis with over a million monthly downloads. Thanks to its cross-language design, igraph delivers both speed and flexibility: it can handle billions of edges, supports interactive plotting, integrates with notebooks, facilitates conversions to and from other network libraries, includes a rich library of graph layout and community detection algorithms, and has a detailed documentation including non-English translations. Modern testing features such as continuous integration, address sanitizers, stricter typing, and memory-managed vectors have also increased robustness. Hundreds of bug reports have been fixed and a community forum has been opened to connect users and developers. Specific effort has been made to broaden use and community participation by women, non-binary people, and other demographic groups typically underrepresented in open source software.
Verified 2026-10-11 · 1 reference not checked yet
Overview
CoChat Summary
## TL;DR
igraph 1.0 is presented as a fast, cross-language graph analysis library with a C core and Python, R, and Mathematica interfaces. The paper argues that it scales to billions of edges, is usually about an order of magnitude faster than NetworkX in the reported benchmarks, and includes broad documentation, testing, and community-support infrastructure.
## Key findings
- The codebase has had around 3 million lines of code edited across approximately 10,000 versioning commits; as of June 2026, the four main repositories had been forked approximately 800 times and starred 3,000 times.
- In June 2026, the Python and R packages were downloaded around 2.1 million and 600 thousand times, respectively.
- Using the C core, constructing an undirected Bethe lattice with 3.2 billion edges took 4 minutes on a server using a single CPU core; similar results were reported for a 400 million-edge random graph and a 3.3 billion-edge directed ring graph.
- In runtime comparisons against NetworkX, igraph was faster in essentially all cases across 1–30 thousand nodes, “usually by approximately one order of magnitude”; for large graphs, the Python interface was reported to be about 10 times faster than NetworkX, while for small graphs Python overhead reduced that advantage.
- The R interface is reported to be used by 713 CRAN packages as of June 2026.
- A workshop with Women in Network Science trained 25 women to use igraph; all expressed interest in continuing to use it, and the authors interpret this as evidence that targeted workshops can help onboard diverse users.
## Methods
- Performance and comparison tests were run 10 times each, with memory deallocation/garbage collection between runs; scalability tests for Figure 1 were done on a tower server with 512 GB RAM and a single Intel Xeon Platinum 8160T CPU at 2.10 GHz, while comparisons against scikit-network used a laptop with 32 GB RAM and Intel Core Ultra 7 265H CPUs.
- Graph layout demonstrations used synthetic graphs built from 10 tightly connected groups with random inter-group distances; the Fruchterman-Reingold and UMAP layouts were run on graphs up to 1,000 vertices, and only UMAP on a 100,000-node graph.
- The paper also reports package statistics from PyPI stats, cranlogs.app, GitHub’s interface, and code/function counts via Python’s `inspect` module and R’s `lsf.str("package:igraph")`.
## Limitations
- The paper states that igraph’s current internal data structure, based on numbered arrays of vertices and edges, is efficient for static graph analysis but less performant for dynamic networks where vertices and edges are frequently added or removed.
- It states that the R interface is more limited in network size because R internally uses double precision floating point numbers to represent integers.
- Evident from the text: the reported benchmarks are limited to the specific hardware, versions, and graph types described, so the results may not generalize to all workloads or implementations.
Model-written summary. Check it against the paper before relying on it.
Integrity signals
Registry
Cites
Statistics
Figures


Verification
Claims the paper makes
1 Valid · 4 Not valid · 17 Not checked · 42 Own results and interpretations
A result the paper reports from its own data — it cites no other source for it, so there is none to check. The quote shows it is in the paper.
In the paper
“Moreover, conversions are fast ( S5 Fig ): generating a graph in igraph and then converting it to a library of choice can sometimes be faster than using native constructor routines.”
hedgedstates a possible cause- Asserted: passes — The authors put it forward as true.
- Checkable: passes — It can be checked against evidence.
- Load-bearing: unclear — It is unclear whether the paper’s conclusions depend on it.
- Based: passes — The paper gives a reason why it holds.
A result the paper reports from its own data — it cites no other source for it, so there is none to check. The quote shows it is in the paper.
In the paper
“As an example, constructing an undirected Bethe lattice with 3.2 billion edges took 4 minutes on a server using a single CPU core ( Fig 1A ).”
plainSingle case- Asserted: passes — The authors put it forward as true.
- Checkable: passes — It can be checked against evidence.
- Load-bearing: unclear — It is unclear whether the paper’s conclusions depend on it.
- Based: passes — The paper gives a reason why it holds.
In the paper
“In addition, the team conducted interviews with 19 open-source community managers lasting 60–90 minutes each on strategies for increasing diversity, inclusion, and belonging in open-source communities [ 44 ].”
What the sources say
- Not checked yetcites [44] Lange RA, Gibson A, Trujillo MZ, Welles BF. Invisible Labor: The Backbone of Open Source Software; 2025. https://arxiv.org/abs/2503.13405
plain- Asserted: passes — The authors put it forward as true.
- Checkable: passes — It can be checked against evidence.
- Load-bearing: passes — The paper’s conclusions depend on it.
- Based: passes — The paper gives a reason why it holds.
A result the paper reports from its own data — it cites no other source for it, so there is none to check. The quote shows it is in the paper.
In the paper
“To further assess igraph’s speed against networkx, we computed runtime ratios for four algorithms across a wide range of graph sizes (1–30 thousand nodes) and found that igraph was faster in essentially all cases, usually by approximately one order of magnitude ( Fig 1C and S3 Fig ).”
plain- Asserted: passes — The authors put it forward as true.
- Checkable: passes — It can be checked against evidence.
- Load-bearing: passes — The paper’s conclusions depend on it.
- Based: passes — The paper gives a reason why it holds.
A result the paper reports from its own data — it cites no other source for it, so there is none to check. The quote shows it is in the paper.
In the paper
“Similar results were obtained when constructing a random graph with 400 million edges and a directed ring graph with 3.3 billion edges ( Fig 1A ).”
plain- Asserted: passes — The authors put it forward as true.
- Checkable: passes — It can be checked against evidence.
- Load-bearing: unclear — It is unclear whether the paper’s conclusions depend on it.
- Based: passes — The paper gives a reason why it holds.
10 more claims
Create a free account to see all 64 claims and to verify the 23 references still open.
- Probably not a substantial claim. 39
- It may state two separate claims as one. 26
- The quote only partly states this claim. 1
Citations
Cites
Cytoscape: A software Environment for integrated models of biomolecular interaction networks
Shannon, P., Markiel, A., Ozier, O., Baliga, N. S., Wang, J. T., Ramage, D., Amin, N., Schwikowski, B., & Ideker, T. (2003) · Genome Research · doi:10.1101/gr.1239303 · Cited by 51,888 · cited 1×
“Cytoscape is a popular choice for advanced graph visualization [17], while D3.js can be used from JavaScript to embed networks in a web page [18].”
Matplotlib: a 2D graphics environment
Hunter, J. D. (2007) · Computing in Science & Engineering · doi:10.1109/mcse.2007.55 · Cited by 39,249 · cited 2×
“In the Python interface, visualization functions are tested by pixel-by-pixel matching of the resulting images, as in matplotlib [37]. igraph ’s documentation includes an R package vignette and documentation website using pkgdown [42] designed to help new users.”
Emergence of Scaling in Random Networks
Barabási, A.-L., & Albert, R. (1999) · Science · doi:10.1126/science.286.5439.509 · Cited by 36,135
SPAdes: A New Genome Assembly Algorithm and Its Applications to Single-Cell Sequencing
Bankevich, A., Nurk, S., Antipov, D., Gurevich, A. A., Dvorkin, M., Kulikov, A. S., Lesin, V. M., Nikolenko, S. I., Pham, S., Prjibelski, A. D., et al. (2012) · Journal of Computational Biology · doi:10.1089/cmb.2012.0021 · Cited by 25,987
Fast unfolding of communities in large networks
Blondel, V. D., Guillaume, J.-L., Lambiotte, R., & Lefebvre, E. (2008) · Journal of Statistical Mechanics: Theory and Experiment · doi:10.1088/1742-5468/2008/10/p10008 · Cited by 21,424 · cited 1×
“Community detection includes, among others, Leiden [26], multilevel (or Louvain) [30] and fluid communities [31].”
Gephi: An Open Source Software for Exploring and Manipulating Networks
Bastian, M., Heymann, S., & Jacomy, M. (2009) · Proceedings of the International AAAI Conference on Web and Social Media · doi:10.1609/icwsm.v3i1.13937 · Cited by 11,675 · cited 1×
“Gephi is a popular network analysis tool with a central role for graph visualization [19], and both NetworkX and graph-tool can produce relatively simple visualisations from Python.”
Data Structures for Statistical Computing in Python
McKinney, W. (2010) · Proceedings of the Python in Science Conference · doi:10.25080/majora-92bf1922-00a · Cited by 11,032 · cited 1×
“Compatibility with pandas dataframes has been added as well [39].”
Exploring Network Structure, Dynamics, and Function Using NetworkX
Hagberg, A. A., Schult, D. A., & Swart, P. J. (2008) · Proceedings of the Python in Science Conference · doi:10.25080/tcwv9851 · Cited by 7,477 · cited 1×
“NetworkX is a popular library in the Python community [10] that is written in pure Python.”
UMAP: Uniform Manifold Approximation and Projection for Dimension Reduction
McInnes, L., Healy, J., & Melville, J. (2018) · arXiv · doi:10.48550/arxiv.1802.03426 · Cited by 7,101
What is Twitter, a social network or a news media?
Kwak, H., Lee, C., Park, H., & Moon, S. (2010) · Proceedings of the 19th international conference on World wide web · doi:10.1145/1772690.1772751 · Cited by 6,652 · cited 1×
“Huge networks, which include a Twitter network of 40 million vertices and 1.5 billion edges [45] and a citation network with more than 240 million vertices and almost 2 billion edges [46], have become increasingly common in recent years.”
Influential
Cited by
HyperNetX: A Python package for modeling complex network data as hypergraphs
Praggastis, B., Aksoy, S. G., Arendt, D., Bonicillo, M., Joslyn, C., Purvine, E., Shapiro, M. R., & Yun, J. Y. (2024) · The Journal of Open Source Software · doi:10.21105/joss.06016 · Cited by 38
AI-driven multi-omics modeling of myalgic encephalomyelitis/chronic fatigue syndrome
Xiong, R., Aiken, E., Caldwell, R., Vernon, S. D., Kozhaya, L., Gunter, C., Bateman, L., Unutmaz, D., & Oh, J. (2025) · Nature Medicine · doi:10.1038/s41591-025-03788-3 · Cited by 29
Uyar, B., Savchyn, T., Nilchi, A. N., Sarıgün, A., Wurmus, R., Shaik, M. M., Grüning, B. A., Franke, V., & Akalin, A. (2025) · Nature Communications · doi:10.1038/s41467-025-63688-5 · Cited by 24
Defining the limits of plant chemical space: challenges and estimations
Hart, C. E., Gadiya, Y., Kind, T., Krettler, C. A., Gaetz, M., Misra, B. B., Healey, D., Allen, A., Colluru, V., & Domingo‐Fernándéz, D. (2025) · GigaScience · doi:10.1093/gigascience/giaf033 · Cited by 20
Xiong, R., Aiken, E. S., Caldwell, R., Vernon, S. D., Kozhaya, L., Gunter, C., Bateman, L., Unutmaz, D., & Oh, J. (2024) · bioRxiv (Cold Spring Harbor Laboratory) · doi:10.1101/2024.06.24.600378 · Cited by 5
Metadata
- Authors
- Antonov, M., Csárdi, G., Horvát, S., Müller, K., Nepusz, T., Noom, D., Salmon, M., Traag, V., Welles, B. F., & Zanini, F.
- Affiliations
- cynkra GmbH (Switzerland) (CH)
- Posit Software, PBC (United States) (US)
- Reykjavík University (IS)
- Leiden University (NL)
- Northeastern University (US)
- UNSW Sydney (AU)
- Corresponding author
- Horvát, Szabolcs
- Zanini, Fabio
- ORCID
- Venue
- PLOS One
- Publisher
- Public Library of Science (PLoS)
- Published
- 2026-08-04
- Volume
- 21
- Issue
- 8
- Pages
- e0355108
- ISSN
- 1932-6203 (ISSN-L)
- PMC
- PMC13436765
- OpenAlex
- W4388843329
- Cited by
- 56
- References
- 53
- Citations by year
- 2026: 46
- FWCI
- 145.33
- Type
- journal article
- Language
- en
- Open access
- gold
- doi.org
- Licence
- Locations
- PLoS ONE (publishedVersion, cc-by)
- PubMed (publishedVersion)
- PubMed Central (publishedVersion, cc-by)
- arXiv (Cornell University) (submittedVersion, cc-by)
- Opin vísindi (Opin vísindi) (submittedVersion, cc-by-nc-sa)
- arXiv (Cornell University) (cc-by)
- Funders
- Chan Zuckerberg Initiative (EOSS2-0000000067, EOSS4-0000000179, EOSS-DI-0000000021)
- Topics
- Physical Sciences › Physics and Astronomy › Statistical and Nonlinear Physics › Complex Network Analysis Techniques
- Physical Sciences › Computer Science › Computational Theory and Mathematics › Graph Theory and Algorithms
- Social Sciences › Decision Sciences › Information Systems and Management › Scientific Computing and Data Management
- Keywords
- igraph, network analysis software, graph theory, network visualization, Python interface, R interface, graph layout algorithms, community detection, software robustness, open source software
- MeSH terms
- Algorithms, Computer Graphics, Humans, Programming Languages, Software
About these checks
Registry, retraction, Cites and statistics results are computed, not judged, with one exception: a printed reference that no index lists is read once by a model before it counts as a citation error. Claims are extracted by a model and kept only when their quote appears verbatim in the text; each cited source is then checked, with a model’s help, for whether it says what the claim relies on. Those verdicts can be wrong — read the claim’s quote and the cited source before relying on one.
The claim verdicts this report counts are experimental: their accuracy is not yet measured.
A language model drew the claims from the paper on 2026-10-11, under version 3 of the claim definition (model deepseek-v4.1-flash, prompt extract-v3).
A second model labelled each claim on 2026-10-11 (model jev-1.13-20260917, definition revision gold-guideline-v0.2).
Statistics and arithmetic are recomputed, not judged.
Confidence bands are shown only for fields calibrated on our annotated test set. None is calibrated yet, so no band is shown.
What counts as a claim ›How we measure confidence ›How we check this ›
Are you an author, or do you see a problem with this page? Request a review
How to cite
Cite CoChat for the checks on this page, and the paper for its own findings.
- This page
- CoChat. (2026). Citation check: igraph 1.0 enables fast and robust network analysis across programming languages. https://app.cochat.ai/papers/10.1371/journal.pone.0355108
- The paper
- Antonov, M., Csárdi, G., Horvát, S., Müller, K., Nepusz, T., Noom, D., Salmon, M., Traag, V., Welles, B. F., & Zanini, F. (2026). igraph 1.0 enables fast and robust network analysis across programming languages. PLOS One. https://doi.org/10.1371/journal.pone.0355108
Data sources
Bibliographic data: Semantic Scholar, OpenAlex, Crossref.
Contains information from the Semantic Scholar Academic Graph Datasets, made available under the ODC Attribution License (ODC-BY 1.0).
Semantic Scholar’s data is described in: Kinney, R., et al. (2023). The Semantic Scholar Open Data Platform. arXiv:2301.10140.
