Cited by 76

The DOI matches its Crossref record.

The HPV16 E6 Oncoprotein Causes Prolonged Receptor Protein Tyrosine Kinase Signaling and Enhances Internalization of Phosphorylated Receptor Species

Spangle, Jennifer M., Munger, Karl·2013·PLoS Pathogens

Overview

The claims and statistics of this paper haven’t been checked yet.

Run the check — free, no account needed. It reads the open-access text and checks the sources it cites.

A few free checks a day · papers already verified open instantly · results are public

Integrity signals

Registry

Crossref · 10.1371/journal.ppat.1003237

Cites

Statistics

Figures

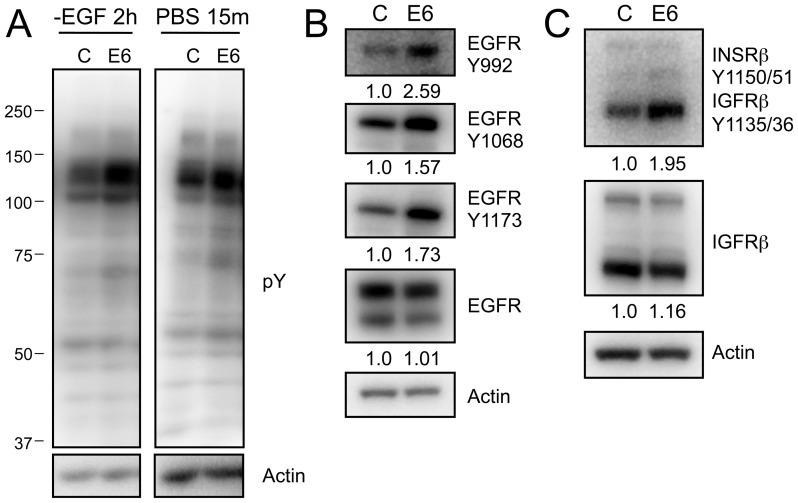
Figure 1 ERBB2 phosphorylation is increased in HPV16 E6 expressing HFKs. (A) Western blot analysis of proteins with phosphorylated tyrosine residues following EGF withdrawal (left) or PBS starvation (right) from HFK lysates stably expressing HPV16 E6 (E6) or the pLentiN6.3 control vector (C). (B) and (C) Western blot analyses probing the phosphorylation status of EGFR (B) or INSRβ/IGFRβ (C) using phosphospecific antibodies in HPV16 E6 (E6) or LXSN control vector (C) expressing stable HFKs. Representative experiments from three independent experiments are shown in panels A, B and C. Quantifications relative to actin are shown below each panel.
Figure 1 ERBB2 phosphorylation is increased in HPV16 E6 expressing HFKs. (A) Western blot analysis of proteins with phosphorylated tyrosine residues following EGF withdrawal (left) or PBS starvation (right) from HFK lysates stably expressing HPV16 E6 (E6) or the pLentiN6.3 control vector (C). (B) and (C) Western blot analyses probing the phosphorylation status of EGFR (B) or INSRβ/IGFRβ (C) using phosphospecific antibodies in HPV16 E6 (E6) or LXSN control vector (C) expressing stable HFKs. Representative experiments from three independent experiments are shown in panels A, B and C. Quantifications relative to actin are shown below each panel.CC BY · PubMed Central
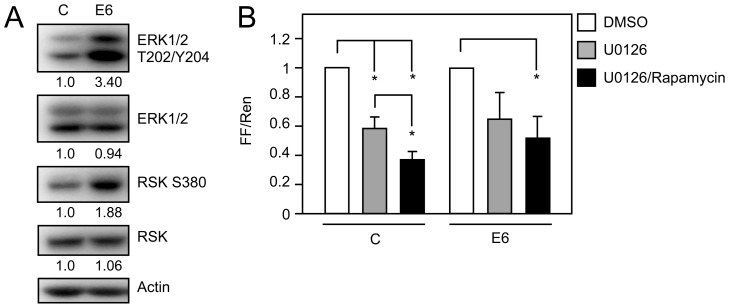
Figure 2 Signaling pathways downstream of RPTKs are activated in HPV16 E6 expressing HFKs. (A) Western blot analysis of MAPK signaling by analyzing ERK1/2 and RSK phosphorylation in HFKs with stable expression of HPV16 E6 (E6) or LSXN control vector (C) and experiencing nutrient withdrawal by PBS starvation for 30 minutes. Quantifications relative to actin are shown below each panel. A representative experiment from a total of four independent experiments is shown. (B) HPV16 E6 mediated increase in cap dependent translation is dependent on MEK and mTORC1 signaling. U2OS cells were transfected with pFR_CrPV_xb and the indicated plasmids and processed for firefly and Renilla luciferase activity at 48 hours post transfection. 20 hours prior to lysis, cells were treated with DMSO, 10 µM U0126 (a MEK inhibitor), or a combination of 10 µM U0126 and 100 nM Rapamycin (an mTORC1 inhibitor). Firefly and Renilla luciferase were normalized to levels in DMSO treated cells and are presented as fold changes of normalized firefly relative to normalized Renilla activity. The bar graph represents averages and standard deviations of three independent experiments, each performed in triplicate; the asterisk indicates statistical significance (P<0.05).
Figure 2 Signaling pathways downstream of RPTKs are activated in HPV16 E6 expressing HFKs. (A) Western blot analysis of MAPK signaling by analyzing ERK1/2 and RSK phosphorylation in HFKs with stable expression of HPV16 E6 (E6) or LSXN control vector (C) and experiencing nutrient withdrawal by PBS starvation for 30 minutes. Quantifications relative to actin are shown below each panel. A representative experiment from a total of four independent experiments is shown. (B) HPV16 E6 mediated increase in cap dependent translation is dependent on MEK and mTORC1 signaling. U2OS cells were transfected with pFR_CrPV_xb and the indicated plasmids and processed for firefly and Renilla luciferase activity at 48 hours post transfection. 20 hours prior to lysis, cells were treated with DMSO, 10 µM U0126 (a MEK inhibitor), or a combination of 10 µM U0126 and 100 nM Rapamycin (an mTORC1 inhibitor). Firefly and Renilla luciferase were normalized to levels in DMSO treated cells and are presented as fold changes of normalized firefly relative to normalized Renilla activity. The bar graph represents averages and standard deviations of three independent experiments, each performed in triplicate; the asterisk indicates statistical significance (P<0.05).CC BY · PubMed Central
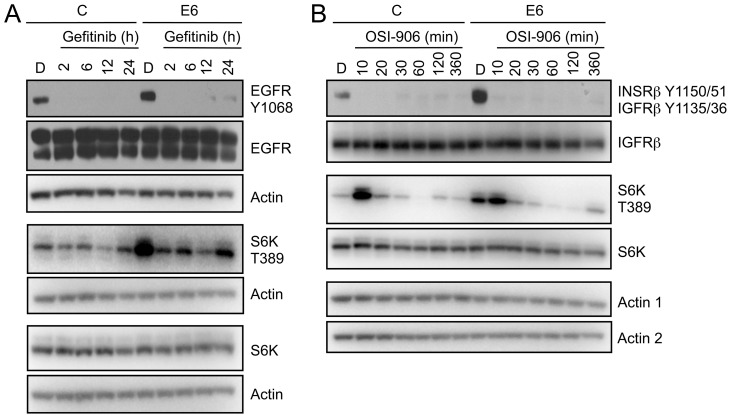
Figure 3 RPTK inhibition reduces mTORC1 activation in HPV16 E6 expressing HFKs. (A) Western blot analysis of EGFR and mTORC1 activation (S6K) in HFKs with stable expression of HPV16 E6 (E6) or pLentiN6.3 control vector (C) following EGFR inhibition with Gefitinib. Cells were treated with DMSO or 1 µM Gefitinib over a 24 hour time course. Actin blots are shown as loading controls. The experiment shown here represents one of three independent experiments. (B) Western blot analysis of INSRβ/IGFRβ and mTORC1 activation (S6K) in HFKs with stable expression of HPV16 E6 (E6) or pLentiN6.3 control vector (C) following INSRβ/IGFRβ chemical inhibition with OSI-906. These data represent one of two independent experiments. Cells were treated with DMSO or 150 nM OSI-906 over a 6 hour time course. Actin blots are shown as a loading control; “actin 1” corresponds to the blots with the phosphospecific antibodies, “actin 2” corresponds the other blots.
Figure 3 RPTK inhibition reduces mTORC1 activation in HPV16 E6 expressing HFKs. (A) Western blot analysis of EGFR and mTORC1 activation (S6K) in HFKs with stable expression of HPV16 E6 (E6) or pLentiN6.3 control vector (C) following EGFR inhibition with Gefitinib. Cells were treated with DMSO or 1 µM Gefitinib over a 24 hour time course. Actin blots are shown as loading controls. The experiment shown here represents one of three independent experiments. (B) Western blot analysis of INSRβ/IGFRβ and mTORC1 activation (S6K) in HFKs with stable expression of HPV16 E6 (E6) or pLentiN6.3 control vector (C) following INSRβ/IGFRβ chemical inhibition with OSI-906. These data represent one of two independent experiments. Cells were treated with DMSO or 150 nM OSI-906 over a 6 hour time course. Actin blots are shown as a loading control; “actin 1” corresponds to the blots with the phosphospecific antibodies, “actin 2” corresponds the other blots.CC BY · PubMed Central
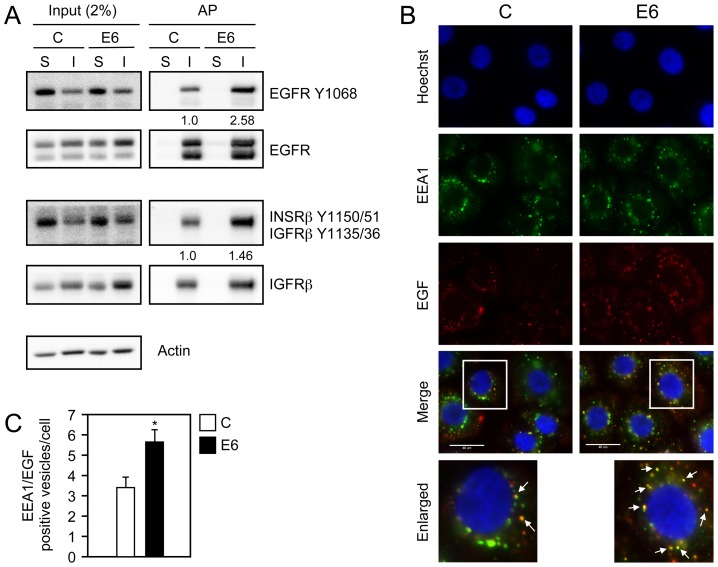
Figure 4 Internalization and degradation of activated receptor species are increased in HPV16 E6 expressing HFKs. (A) Western blot analysis of EGFR and INSRβ/IGFRβ following receptor internalization. After washing the cells with PBS they were incubated with biotin disulfide N-hydroxysulfosuccinimide ester for 40 minutes at 4°C followed by inactivation of the biotin reagent with NH4Cl for 10 min at 4°C. Cells were then stimulated with KSFM lacking growth factors and supplements for 3 hours at 37°C. Following ligand independent stimulation, cells were either lysed without reduction to measure surface bound receptors (S) or reduced and lysed to measure ligand independent internalization (I), Internalization assays were performed as described in the Materials and Methods. Levels of EGFR and INSRβ/IGFRβ in a 5 µg sample, representing 2% of the internalization assay, together with actin, are shown in the left panel (Input), and the resulting streptavidin affinity purification (AP) is shown in the right panel. Quantification representing the ratio of phosphorylated receptors to total receptors normalized to control vector (C) internalized phosphorylated receptors is shown below applicable panels. This experiment represents one of two independent experiments. (B) Immunofluorescence analysis of EGF co-staining with the endosomal marker EEA1 in HFKs with stable expression of HPV16 E6 (E6) or pLentiN6.3 control vector (C) following overnight starvation and stimulation with Alexa 647 labeled EGF (EGF) for 15 minutes. Cells were stained with Hoechst to visualize the nuclei. The scaling bar represents 40 µm. (C) Quantification of the number of EGF positive early endosomes from panel B. Bar graphs represent average numbers of EGF positive early endosomes per cell from four independent experiments. A total of 115 cells were evaluated. Error bars indicate standard deviations; the asterisk indicates statistical significance (P = 0.0017).
Figure 4 Internalization and degradation of activated receptor species are increased in HPV16 E6 expressing HFKs. (A) Western blot analysis of EGFR and INSRβ/IGFRβ following receptor internalization. After washing the cells with PBS they were incubated with biotin disulfide N-hydroxysulfosuccinimide ester for 40 minutes at 4°C followed by inactivation of the biotin reagent with NH4Cl for 10 min at 4°C. Cells were then stimulated with KSFM lacking growth factors and supplements for 3 hours at 37°C. Following ligand independent stimulation, cells were either lysed without reduction to measure surface bound receptors (S) or reduced and lysed to measure ligand independent internalization (I), Internalization assays were performed as described in the Materials and Methods. Levels of EGFR and INSRβ/IGFRβ in a 5 µg sample, representing 2% of the internalization assay, together with actin, are shown in the left panel (Input), and the resulting streptavidin affinity purification (AP) is shown in the right panel. Quantification representing the ratio of phosphorylated receptors to total receptors normalized to control vector (C) internalized phosphorylated receptors is shown below applicable panels. This experiment represents one of two independent experiments. (B) Immunofluorescence analysis of EGF co-staining with the endosomal marker EEA1 in HFKs with stable expression of HPV16 E6 (E6) or pLentiN6.3 control vector (C) following overnight starvation and stimulation with Alexa 647 labeled EGF (EGF) for 15 minutes. Cells were stained with Hoechst to visualize the nuclei. The scaling bar represents 40 µm. (C) Quantification of the number of EGF positive early endosomes from panel B. Bar graphs represent average numbers of EGF positive early endosomes per cell from four independent experiments. A total of 115 cells were evaluated. Error bars indicate standard deviations; the asterisk indicates statistical significance (P = 0.0017).CC BY · PubMed Central
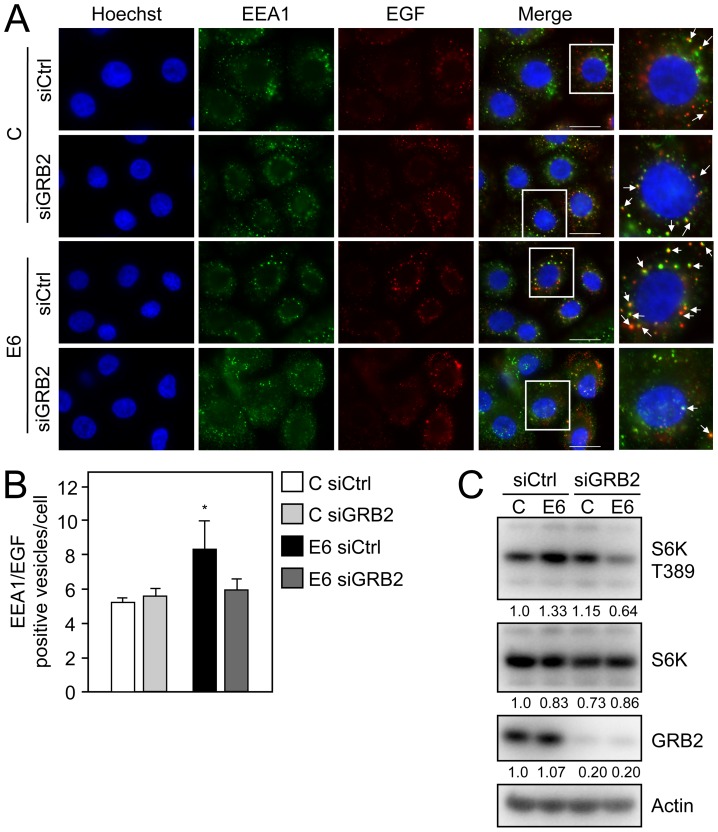
Figure 5 The signaling adaptor protein GRB2 is critical for HPV16 E6 mediated EGFR internalization and mTORC1 activation. (A) Immunofluorescence analysis of EGF co-staining with the endosomal marker EEA1 in GRB2 depleted (siGRB2) or control siRNA transfected (siCtrl) HFKs with stable expression of HPV16 E6 (E6) or pLentiN6.3 control vector (C) following overnight starvation and subsequent stimulation with Alexa 647 labeled EGF (EGF) for 15 minutes. Cells were stained with Hoechst to visualize the nuclei. The scaling bar represents 20 µm. (B) Quantification of the number of EGF positive early endosomes from panel A. Bar graphs represent average numbers of EGF positive early endosomes/cell with counts done in triplicate for a total of at least 95 analyzed cells per condition. Error bars indicate standard deviations; the asterisk indicates statistical significance (P = 0.03). (C) Western blot analysis of S6K T389 in GRB2 depleted (siGRB2) or control siRNA transfected (siCtrl) HFK populations with stable expression of HPV16 E6 (E6) or control vector (C). Cells were transfected with the corresponding siRNAs at 48 hours prior to lysis. An actin blot is shown as a loading control and quantifications relative to actin are shown below each panel. A representative experiment taken from four independent experiments is shown in panel C.
Figure 5 The signaling adaptor protein GRB2 is critical for HPV16 E6 mediated EGFR internalization and mTORC1 activation. (A) Immunofluorescence analysis of EGF co-staining with the endosomal marker EEA1 in GRB2 depleted (siGRB2) or control siRNA transfected (siCtrl) HFKs with stable expression of HPV16 E6 (E6) or pLentiN6.3 control vector (C) following overnight starvation and subsequent stimulation with Alexa 647 labeled EGF (EGF) for 15 minutes. Cells were stained with Hoechst to visualize the nuclei. The scaling bar represents 20 µm. (B) Quantification of the number of EGF positive early endosomes from panel A. Bar graphs represent average numbers of EGF positive early endosomes/cell with counts done in triplicate for a total of at least 95 analyzed cells per condition. Error bars indicate standard deviations; the asterisk indicates statistical significance (P = 0.03). (C) Western blot analysis of S6K T389 in GRB2 depleted (siGRB2) or control siRNA transfected (siCtrl) HFK populations with stable expression of HPV16 E6 (E6) or control vector (C). Cells were transfected with the corresponding siRNAs at 48 hours prior to lysis. An actin blot is shown as a loading control and quantifications relative to actin are shown below each panel. A representative experiment taken from four independent experiments is shown in panel C.CC BY · PubMed Central
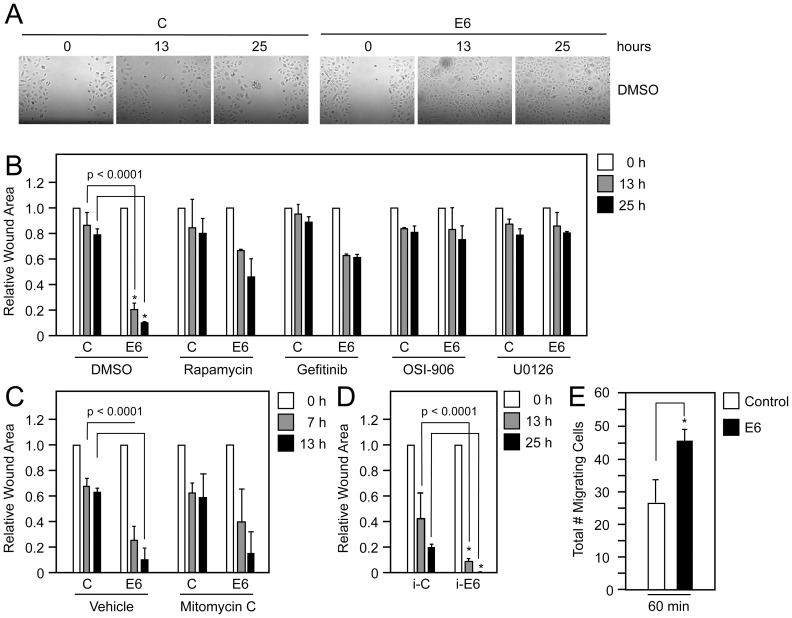
Figure 6 HPV16 E6 increases cellular migration in EGF depleted cells. (A) Wound healing assays with primary HFKs stably expressing HPV16 E6 (E6) or infected with pLentiN6.3 control vector (C) following wounding of the cellular monolayer in the absence of EGF following RPTK and effector pathway inhibition. Cells were treated with DMSO or 100 nM Rapamycin, 1 µM Gefitinib, 150 nM OSI-906, or 10 µM U0126 and closure of the monolayer was measured over a 25 hour time course. Only images of the DMSO treated samples are shown (B). Quantification of wound closure as shown in (A). Surface areas of wounds were calculated relative to the surface area of the wounds at t = 0 hour. Bar represent averages and standard deviations of three experiments; asterisks indicate statistical significance (P<0.0001). (C) Quantification of wound closure in the presence of 8 µg/ml Mitomycin C to inhibit cellular proliferation. (D) Quantification of wound closure in immortalized HFKs stably expressing HPV16 E6 (E6) or pLentiN6.3 control vector (C) (E). Transwell migration assay with HFKs stably expressing HPV16 E6 (E6) or pLentiN6.3 control vector (C). Cells were seeded in the absence of EGF on the top chamber of a transwell insert and migration to the bottom chamber in the absence of EGF was determined at 30 minutes and 60 minutes after seeding. The bars represent averages and standard deviations of three experiments; the asterisk indicates statistical significance (P<0.05).
Figure 6 HPV16 E6 increases cellular migration in EGF depleted cells. (A) Wound healing assays with primary HFKs stably expressing HPV16 E6 (E6) or infected with pLentiN6.3 control vector (C) following wounding of the cellular monolayer in the absence of EGF following RPTK and effector pathway inhibition. Cells were treated with DMSO or 100 nM Rapamycin, 1 µM Gefitinib, 150 nM OSI-906, or 10 µM U0126 and closure of the monolayer was measured over a 25 hour time course. Only images of the DMSO treated samples are shown (B). Quantification of wound closure as shown in (A). Surface areas of wounds were calculated relative to the surface area of the wounds at t = 0 hour. Bar represent averages and standard deviations of three experiments; asterisks indicate statistical significance (P<0.0001). (C) Quantification of wound closure in the presence of 8 µg/ml Mitomycin C to inhibit cellular proliferation. (D) Quantification of wound closure in immortalized HFKs stably expressing HPV16 E6 (E6) or pLentiN6.3 control vector (C) (E). Transwell migration assay with HFKs stably expressing HPV16 E6 (E6) or pLentiN6.3 control vector (C). Cells were seeded in the absence of EGF on the top chamber of a transwell insert and migration to the bottom chamber in the absence of EGF was determined at 30 minutes and 60 minutes after seeding. The bars represent averages and standard deviations of three experiments; the asterisk indicates statistical significance (P<0.05).CC BY · PubMed Central
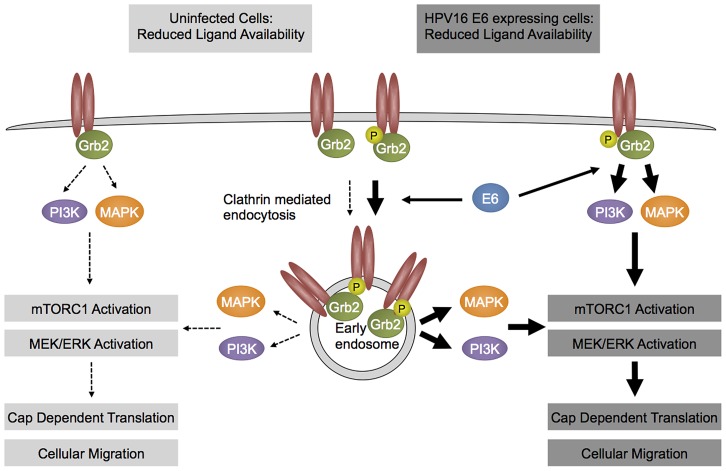
Figure 7 Hypothetical model. HPV16 E6 expressing cells (right) show enhanced activation of RPTKs at least in part by enhancing internalization of activated receptor species as compared to parental cell (left). As a consequence, downstream signaling circuits, including mTORC1 activity remain active even under conditions of limited growth factor availability. See text for details.
Figure 7 Hypothetical model. HPV16 E6 expressing cells (right) show enhanced activation of RPTKs at least in part by enhancing internalization of activated receptor species as compared to parental cell (left). As a consequence, downstream signaling circuits, including mTORC1 activity remain active even under conditions of limited growth factor availability. See text for details.CC BY · PubMed Central

Verification

Claims the paper makes

The claims and statistics of this paper haven’t been checked yet.

Run the check — free, no account needed. It reads the open-access text and checks the sources it cites.

A few free checks a day · papers already verified open instantly · results are public

Claims other papers make about this one

Each is checked against this paper’s own text: does it say what the citing paper says it does?

Self-check

Percentages, sums and reported differences re-computed from the paper’s own numbers.

The self-check needs the paper’s full text.

Citations

Cites

No references could be resolved yet.

Research works printed but not linked: 58

  1. ME McLaughlin-Drubin, 2009, Oncogenic activities of human papillomaviruses, Virus Res, 143, 195, 10.1016/j.virusres.2009.06.008 · DOI
  2. M Scheffner, 1993, The HPV-16 E6 and E6-AP complex functions as a ubiquitin-protein ligase in the ubiquitination of p53, Cell, 75, 495, 10.1016/0092-8674(93)90384-3 · DOI · Paper page
  3. D Gardiol, 1999, Oncogenic human papillomavirus E6 proteins target the discs large tumour suppressor for proteasome-mediated degradation, Oncogene, 18, 5487, 10.1038/sj.onc.1202920 · DOI · Paper page
  4. BA Glaunsinger, 2000, Interactions of the PDZ-protein MAGI-1 with adenovirus E4-ORF1 and high-risk papillomavirus E6 oncoproteins, Oncogene, 19, 5270, 10.1038/sj.onc.1203906 · DOI · Paper page
  5. M Jing, 2007, Degradation of tyrosine phosphatase PTPN3 (PTPH1) by association with oncogenic human papillomavirus E6 proteins, J Virol, 81, 2231, 10.1128/JVI.01979-06 · DOI
  6. T Kiyono, 1997, Binding of high-risk human papillomavirus E6 oncoproteins to the human homologue of the Drosophila discs large tumor suppressor protein, Proc Natl Acad Sci U S A, 94, 11612, 10.1073/pnas.94.21.11612 · DOI · Paper page
  7. SS Lee, 2000, Multi-PDZ domain protein MUPP1 is a cellular target for both adenovirus E4-ORF1 and high-risk papillomavirus type 18 E6 oncoproteins, J Virol, 74, 9680, 10.1128/JVI.74.20.9680-9693.2000 · DOI
  8. SS Lee, 1997, Binding of human virus oncoproteins to hDlg/SAP97, a mammalian homolog of the Drosophila discs large tumor suppressor protein, Proc Natl Acad Sci U S A, 94, 6670, 10.1073/pnas.94.13.6670 · DOI · Paper page
  9. S Nakagawa, 2000, Human scribble (Vartul) is targeted for ubiquitin-mediated degradation by the high-risk papillomavirus E6 proteins and the E6AP ubiquitin-protein ligase, Mol Cell Biol, 20, 8244, 10.1128/MCB.20.21.8244-8253.2000 · DOI · Paper page
  10. WC Spanos, 2008, The PDZ binding motif of human papillomavirus type 16 E6 induces PTPN13 loss, which allows anchorage-independent growth and synergizes with ras for invasive growth, J Virol, 82, 2493, 10.1128/JVI.02188-07 · DOI
  11. AJ Klingelhutz, 1996, Telomerase activation by the E6 gene product of human papillomavirus type 16, Nature, 380, 79, 10.1038/380079a0 · DOI · Paper page
  12. W Zwerschke, 1999, Modulation of type M2 pyruvate kinase activity by the human papillomavirus type 16 E7 oncoprotein, Proc Natl Acad Sci U S A, 96, 1291, 10.1073/pnas.96.4.1291 · DOI · Paper page
  13. X Zhou, 2009, Expression of the human papillomavirus type 16 E7 oncoprotein induces an autophagy-related process and sensitizes normal human keratinocytes to cell death in response to growth factor deprivation, Virology, 385, 192, 10.1016/j.virol.2008.12.003 · DOI
  14. A Eichten, 2004, Molecular pathways executing the “trophic sentinel” response in HPV-16 E7-expressing normal human diploid fibroblasts upon growth factor deprivation, Virology, 319, 81, 10.1016/j.virol.2003.11.008 · DOI
  15. GI Evan, 2001, Proliferation, cell cycle and apoptosis in cancer, Nature, 411, 342, 10.1038/35077213 · DOI · Paper page
  16. JM Spangle, 2010, The human papillomavirus type 16 E6 oncoprotein activates mTORC1 signaling and increases protein synthesis, J Virol, 84, 9398, 10.1128/JVI.00974-10 · DOI · Paper page
  17. Z Lu, 2004, Human papillomavirus 16 E6 oncoprotein interferences with insulin signaling pathway by binding to tuberin, J Biol Chem, 279, 35664, 10.1074/jbc.M403385200 · DOI · Paper page
  18. X Zhou, 2009, Expression of a viral oncoprotein in normal human epithelial cells triggers an autophagy-related process: is autophagy an “Achilles' heel” of human cancers, Autophagy, 5, 578, 10.4161/auto.5.4.8367 · DOI
  19. H Fernandes, 2001, Glycosylation-induced conformational modification positively regulates receptor-receptor association: a study with an aberrant epidermal growth factor receptor (EGFRvIII/DeltaEGFR) expressed in cancer cells, J Biol Chem, 276, 5375, 10.1074/jbc.M005599200 · DOI
  20. M Rojas, 1996, Controlling epidermal growth factor (EGF)-stimulated Ras activation in intact cells by a cell-permeable peptide mimicking phosphorylated EGF receptor, J Biol Chem, 271, 27456, 10.1074/jbc.271.44.27456 · DOI
  21. G Levkowitz, 1999, Ubiquitin ligase activity and tyrosine phosphorylation underlie suppression of growth factor signaling by c-Cbl/Sli-1, Mol Cell, 4, 1029, 10.1016/S1097-2765(00)80231-2 · DOI
  22. C Hernandez-Sanchez, 1995, The role of the tyrosine kinase domain of the insulin-like growth factor-I receptor in intracellular signaling, cellular proliferation, and tumorigenesis, J Biol Chem, 270, 29176, 10.1074/jbc.270.49.29176 · DOI
  23. MF White, 1988, A cascade of tyrosine autophosphorylation in the beta-subunit activates the phosphotransferase of the insulin receptor, J Biol Chem, 263, 2969, 10.1016/S0021-9258(18)69163-X · DOI
  24. S Sigismund, 2008, Clathrin-mediated internalization is essential for sustained EGFR signaling but dispensable for degradation, Dev Cell, 15, 209, 10.1016/j.devcel.2008.06.012 · DOI
  25. Q Wang, 2005, Control of epidermal growth factor receptor endocytosis by receptor dimerization, rather than receptor kinase activation, EMBO Rep, 6, 942, 10.1038/sj.embor.7400491 · DOI
  26. SJ McCormack, 1997, Activation of the focal adhesion kinase signal transduction pathway in cervical carcinoma cell lines and human genital epithelial cells immortalized with human papillomavirus type 18, Oncogene, 15, 265, 10.1038/sj.onc.1201186 · DOI
  27. SB Vande Pol, 1998, Association of Bovine Papillomavirus Type 1 E6 oncoprotein with the focal adhesion protein paxillin through a conserved protein interaction motif, Oncogene, 16, 43, 10.1038/sj.onc.1201504 · DOI
  28. CP Petersen, 2006, Short RNAs repress translation after initiation in mammalian cells, Mol Cell, 21, 533, 10.1016/j.molcel.2006.01.031 · DOI
  29. CF Yu, 2002, ERK negatively regulates the epidermal growth factor-mediated interaction of Gab1 and the phosphatidylinositol 3-kinase, J Biol Chem, 277, 19382, 10.1074/jbc.M200732200 · DOI
  30. Z Wang, 1996, Requirement for the adapter protein GRB2 in EGF receptor endocytosis, Science, 272, 1935, 10.1126/science.272.5270.1935 · DOI
  31. Y Romeo, 2012, Regulation and function of the RSK family of protein kinases, Biochem J, 441, 553, 10.1042/BJ20110289 · DOI
  32. H Zhou, 2010, mTOR signaling in cancer cell motility and tumor metastasis, Crit Rev Eukaryot Gene Expr, 20, 1, 10.1615/CritRevEukarGeneExpr.v20.i1.10 · DOI
  33. X Wang, 2007, NEDD4-1 is a proto-oncogenic ubiquitin ligase for PTEN, Cell, 128, 129, 10.1016/j.cell.2006.11.039 · DOI
  34. GP Lobo, 2008, ATP modulates PTEN subcellular localization in multiple cancer cell lines, Hum Mol Genet, 17, 2877, 10.1093/hmg/ddn185 · DOI
  35. A Contreras-Paredes, 2009, E6 variants of human papillomavirus 18 differentially modulate the protein kinase B/phosphatidylinositol 3-kinase (akt/PI3K) signaling pathway, Virology, 383, 78, 10.1016/j.virol.2008.09.040 · DOI · Paper page
  36. Y Zhou, 2007, Increased phosphorylation of p70 S6 kinase is associated with HPV16 infection in cervical cancer and esophageal cancer, Br J Cancer, 97, 218, 10.1038/sj.bjc.6603838 · DOI
  37. R McCloskey, 2010, Human papillomavirus type 16 E6/E7 upregulation of nucleophosmin is important for proliferation and inhibition of differentiation, J Virol, 84, 5131, 10.1128/JVI.01965-09 · DOI
  38. AC Hoover, 2009, Impaired PTPN13 phosphatase activity in spontaneous or HPV-induced squamous cell carcinomas potentiates oncogene signaling through the MAP kinase pathway, Oncogene, 28, 3960, 10.1038/onc.2009.251 · DOI
  39. GS Akerman, 2001, Human papillomavirus type 16 E6 and E7 cooperate to increase epidermal growth factor receptor (EGFR) mRNA levels, overcoming mechanisms by which excessive EGFR signaling shortens the life span of normal human keratinocytes, Cancer Res, 61, 3837
  40. N Sizemore, 1998, Transcriptional regulation of the EGF receptor promoter by HPV16 and retinoic acid in human ectocervical epithelial cells, Exp Cell Res, 244, 349, 10.1006/excr.1998.4179 · DOI
  41. D Johnston, 1999, Elevation of the epidermal growth factor receptor and dependent signaling in human papillomavirus-infected laryngeal papillomas, Cancer Res, 59, 968
  42. LK Goh, Multiple mechanisms collectively regulate clathrin-mediated endocytosis of the epidermal growth factor receptor, J Cell Biol, 189, 871
  43. AG Batzer, 1994, Hierarchy of binding sites for Grb2 and Shc on the epidermal growth factor receptor, Mol Cell Biol, 14, 5192, 10.1128/MCB.14.8.5192 · DOI
  44. EY Skolnik, 1993, The function of GRB2 in linking the insulin receptor to Ras signaling pathways, Science, 260, 1953, 10.1126/science.8316835 · DOI
  45. CE Bazenet, 1996, Phosphorylation of tyrosine 720 in the platelet-derived growth factor alpha receptor is required for binding of Grb2 and SHP-2 but not for activation of Ras or cell proliferation, Mol Cell Biol, 16, 6926, 10.1128/MCB.16.12.6926 · DOI
  46. RL Pratt, 2002, Activation of the EphA2 tyrosine kinase stimulates the MAP/ERK kinase signaling cascade, Oncogene, 21, 7690, 10.1038/sj.onc.1205758 · DOI
  47. K Talbert-Slagle, 2009, The bovine papillomavirus E5 protein and the PDGF beta receptor: it takes two to tango, Virology, 384, 345, 10.1016/j.virol.2008.09.033 · DOI
  48. DR Kaplan, 1987, Common elements in growth factor stimulation and oncogenic transformation: 85 kd phosphoprotein and phosphatidylinositol kinase activity, Cell, 50, 1021, 10.1016/0092-8674(87)90168-1 · DOI
  49. M Whitman, 1985, Association of phosphatidylinositol kinase activity with polyoma middle-T competent for transformation, Nature, 315, 239, 10.1038/315239a0 · DOI
  50. N Ichaso, 2001, Cell transformation by the middle T-antigen of polyoma virus, Oncogene, 20, 7908, 10.1038/sj.onc.1204859 · DOI
  51. SA Summers, 1998, Polyoma middle T antigen activates the Ser/Thr kinase Akt in a PI3-kinase-dependent manner, Biochem Biophys Res Commun, 246, 76, 10.1006/bbrc.1998.8575 · DOI
  52. M Shuda, 2011, Human Merkel cell polyomavirus small T antigen is an oncoprotein targeting the 4E-BP1 translation regulator, J Clin Invest, 9, 3623, 10.1172/JCI46323 · DOI
  53. CL Halbert, 1992, The E6 and E7 genes of human papillomavirus type 6 have weak immortalizing activity in human epithelial cells, J Virol, 66, 2125, 10.1128/JVI.66.4.2125-2134.1992 · DOI · Paper page
  54. SJ Baker, 1990, Suppression of human colorectal carcinoma cell growth by wild-type p53, Science, 249, 912, 10.1126/science.2144057 · DOI
  55. K Munger, 1989, The E6 and E7 genes of the human papillomavirus type 16 together are necessary and sufficient for transformation of primary human keratinocytes, J Virol, 63, 4417, 10.1128/JVI.63.10.4417-4421.1989 · DOI · Paper page
  56. JM Spangle, 2012, Activation of cap-dependent translation by mucosal human papillomavirus E6 proteins is dependent on the integrity of the LXXLL binding motif, J Virol, 14, 7466, 10.1128/JVI.00487-12 · DOI
  57. SA Sedman, 1991, The full-length E6 protein of human papillomavirus type 16 has transforming and trans-activating activities and cooperates with E7 to immortalize keratinocytes in culture, J Virol, 65, 4860, 10.1128/JVI.65.9.4860-4866.1991 · DOI
  58. ME McLaughlin-Drubin, 2008, Human papillomavirus type 16 E7 oncoprotein associates with E2F6, J Virol, 82, 8695, 10.1128/JVI.00579-08 · DOI · Paper page

Metadata

Authors
Spangle, J. M., & Munger, K.
Venue
PLoS Pathogens
Published
2013-03-14
Volume
9
Issue
3
Pages
e1003237
ISSN
1553-7374
Cited by
76
References
0
Language
en

About these checks

Registry, retraction, Cites and statistics results are computed, not judged, with one exception: a printed reference that no index lists is read once by a model before it counts as a citation error. Claims are extracted by a model and kept only when their quote appears verbatim in the text; each cited source is then checked, with a model’s help, for whether it says what the claim relies on. Those verdicts can be wrong — read the claim’s quote and the cited source before relying on one.

Statistics and arithmetic are recomputed, not judged.

Confidence bands are shown only for fields calibrated on our annotated test set. None is calibrated yet, so no band is shown.

What counts as a claim ›How we measure confidence ›How we check this ›

Are you an author, or do you see a problem with this page? Request a review