Cited by 232

The DOI matches its Crossref record; 4 of the 4 references it cites were found in a registry or an index.

Neuronal and psychophysical sensitivity to motion signals in extrastriate area MST of the macaque monkey

Celebrini, S, Newsome, WT·1994·The Journal of Neuroscience

Abstract

We recorded the responses of single neurons in extrastriate area MST while rhesus monkeys discriminated the direction of motion in a set of stochastic visual displays. By varying systematically the strength of a coherent motion signal within the visual display, we were able to measure simultaneously the monkeys' psychophysical thresholds for direction discrimination and the responses of single neurons to the same motion signals. Neuronal thresholds for reliably signaling the direction of motion in the visual display were calculated from the measured responses using a method based in signal detection theory. Neurons in MST were exquisitely sensitive to motion signals in the display, having thresholds for discriminating the direction of coherent motion that were, on average, equal to the psychophysical thresholds of the monkeys. For many MST neurons, the intensity of the response was correlated with the monkey's psychophysical judgements for repeated presentations of a given near-threshold stimulus; the monkey tended to choose the preferred direction of the neuron under study when that neuron responded more strongly to the stimulus. In both of these respects, MST neurons were indistinguishable from neurons in extrastriate area MT, a major source of afferent input to MST. In a second set of experiments, we found that both of these results held true in the face of pronounced manipulations of the visual stimulus. Severe reductions in stimulus size and speed, for example, compromised neuronal and psychophysical sensitivities by similar amounts so that the average neuronal and psychophysical thresholds remained approximately equal. In addition, the trial-to-trial covariation of neuronal response and perceptual decision was unaffected by our stimulus manipulations. Thus, MST neurons carry signals appropriate for supporting psychophysical performance on our task over an impressively wide range of stimulus configurations.

Overview

The claims and statistics of this paper haven’t been checked yet.

Run the check — free, no account needed. It reads the open-access text and checks the sources it cites.

A few free checks a day · papers already verified open instantly · results are public

Integrity signals

Registry

Crossref · 10.1523/jneurosci.14-07-04109.1994

Cites

4 of 4 references verified0 citation errors · 0 not checkable

Statistics

Figures

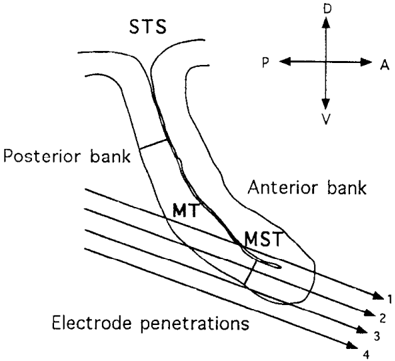
Figure 1 Electrode trajectories through the superior temporal sulcus (STS) commonly encountered in our experiments. The section outline shows a typical STS profile in brains sectioned parasagittally. The middle temporal area (MT), whose boundaries can be identified on myelin stained sections, lies on the posterior bank of the sulcus; the medial superior temporal area (MST) occupies the fundus and anterior bank of the sulcus. Electrode penetrations approach the STS from posterior to anterior at a 20° angle with respect to the horizontal plane.
Figure 1 Electrode trajectories through the superior temporal sulcus (STS) commonly encountered in our experiments. The section outline shows a typical STS profile in brains sectioned parasagittally. The middle temporal area (MT), whose boundaries can be identified on myelin stained sections, lies on the posterior bank of the sulcus; the medial superior temporal area (MST) occupies the fundus and anterior bank of the sulcus. Electrode penetrations approach the STS from posterior to anterior at a 20° angle with respect to the horizontal plane.CC-BY-NC-SA · From the PDF
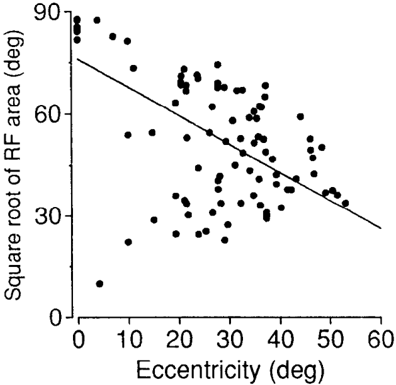
Figure 2 Square root of receptive field (RF) area as a function of the eccentricity of the RF center. Data are shown for 107 MST neurons; we were unable to obtain an accurate receptive field map for 13 neurons that failed to respond to bars or spots of light.
Figure 2 Square root of receptive field (RF) area as a function of the eccentricity of the RF center. Data are shown for 107 MST neurons; we were unable to obtain an accurate receptive field map for 13 neurons that failed to respond to bars or spots of light.CC-BY-NC-SA · From the PDF
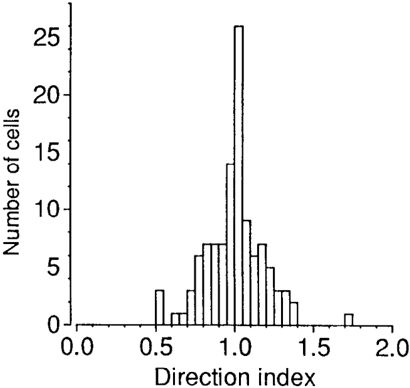
Figure 3 A frequency histogram of direction indices from 111 MST neurons for which direction tuning data were obtained. We used a conventional index of directionality, 1 – N/P, where P is the response of the neuron to preferred direction motion and N is the response to the opposite, or null, direction. Maintained activity was subtracted from the responses before the direction index was calculated. Indices near unity indicate strong direction selectivity, while indices near zero represent poor direction selectivity. Direction indices greater than unity result from inhibition to null direction motion.
Figure 3 A frequency histogram of direction indices from 111 MST neurons for which direction tuning data were obtained. We used a conventional index of directionality, 1 – N/P, where P is the response of the neuron to preferred direction motion and N is the response to the opposite, or null, direction. Maintained activity was subtracted from the responses before the direction index was calculated. Indices near unity indicate strong direction selectivity, while indices near zero represent poor direction selectivity. Direction indices greater than unity result from inhibition to null direction motion.CC-BY-NC-SA · From the PDF
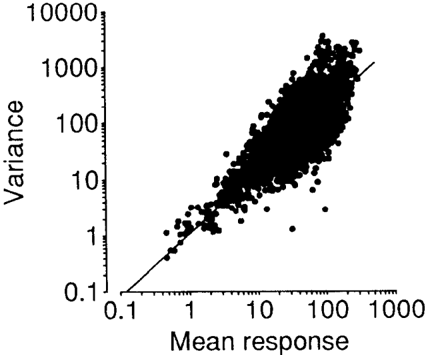
Figure 4 Relationship between mean response level and response variance for 120 MST neurons. The variance and mean response were calculated and plotted for each stimulus condition tested for each cell. The best-fitting regression is indicated by the solid line.
Figure 4 Relationship between mean response level and response variance for 120 MST neurons. The variance and mean response were calculated and plotted for each stimulus condition tested for each cell. The best-fitting regression is indicated by the solid line.CC-BY-NC-SA · From the PDF
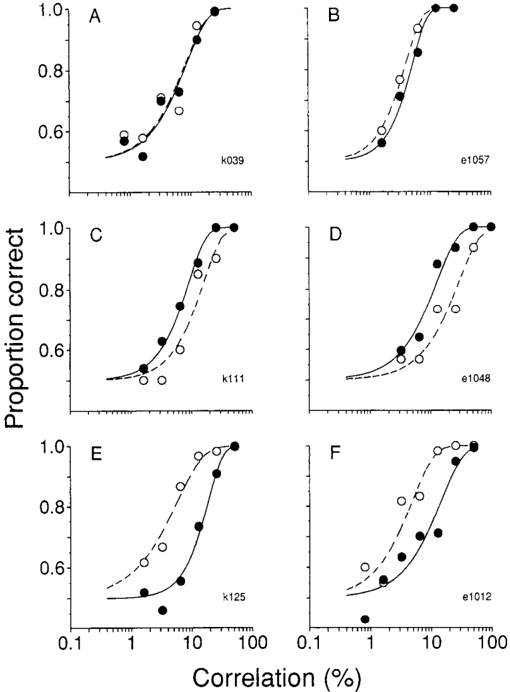
Figure 5 Psychometric and neurometric functions obtained in six MST experiments. The open symbols and broken lines describe psychometric data; the solid symbols and solid lines describe neurometric data. A, An experiment in which the psychometric and neurometric functions were statistically indistinguishable. Psychometric α = 8% correlation, β = 1.15; neurometric α = 8.4% correlation, β = 1.16. B, A second experiment in which psychometric and neurometric functions were indistinguishable. Psychometric α = 4% correlation, β = 1.6; neurometric α = 5.1% correlation, β = 1.7. C, An experiment in which the neural threshold was lower than the psychophysical threshold. Psychometric α = 15.5% correlation, β = 1.38; neurometric α = 8.8% correlation, β = 1.41. D, A second experiment in which the neuron was more sensitive. Psychometric α = 28.4% correlation, β = 1.19; neurometric α = 12.3% correlation, β = 1.19. E, An experiment in which the psychophysical threshold was lower than the neuronal threshold. Psychometric α = 5.7% correlation, β = 1.0; neurometric α = 18.5% correlation, β = 1.7. F, A second experiment in which the psychophysical observer was more sensitive. Psychophysical α = 4.8% correlation, β = 1.16; neurometric α = 14.5% correlation, β = 1.13.
Figure 5 Psychometric and neurometric functions obtained in six MST experiments. The open symbols and broken lines describe psychometric data; the solid symbols and solid lines describe neurometric data. A, An experiment in which the psychometric and neurometric functions were statistically indistinguishable. Psychometric α = 8% correlation, β = 1.15; neurometric α = 8.4% correlation, β = 1.16. B, A second experiment in which psychometric and neurometric functions were indistinguishable. Psychometric α = 4% correlation, β = 1.6; neurometric α = 5.1% correlation, β = 1.7. C, An experiment in which the neural threshold was lower than the psychophysical threshold. Psychometric α = 15.5% correlation, β = 1.38; neurometric α = 8.8% correlation, β = 1.41. D, A second experiment in which the neuron was more sensitive. Psychometric α = 28.4% correlation, β = 1.19; neurometric α = 12.3% correlation, β = 1.19. E, An experiment in which the psychophysical threshold was lower than the neuronal threshold. Psychometric α = 5.7% correlation, β = 1.0; neurometric α = 18.5% correlation, β = 1.7. F, A second experiment in which the psychophysical observer was more sensitive. Psychophysical α = 4.8% correlation, β = 1.16; neurometric α = 14.5% correlation, β = 1.13.CC-BY-NC-SA · From the PDF
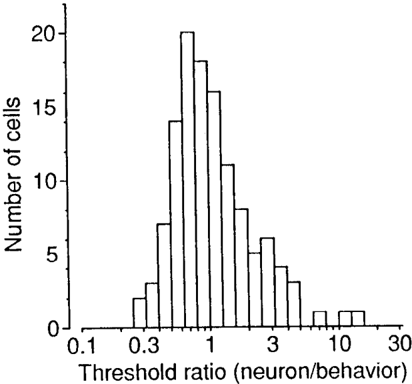
Figure 6 Relative sensitivities of single MST neurons and animal observers. The frequency histogram shows the ratio of neuronal threshold (α) to psychophysical threshold (α) for the 120 experiments in our sample. Ratios greater than unity indicate that the psychophysical observer was more sensitive than the neuron; ratios less than unity indicate that the neuron was more sensitive.
Figure 6 Relative sensitivities of single MST neurons and animal observers. The frequency histogram shows the ratio of neuronal threshold (α) to psychophysical threshold (α) for the 120 experiments in our sample. Ratios greater than unity indicate that the psychophysical observer was more sensitive than the neuron; ratios less than unity indicate that the neuron was more sensitive.CC-BY-NC-SA · From the PDF
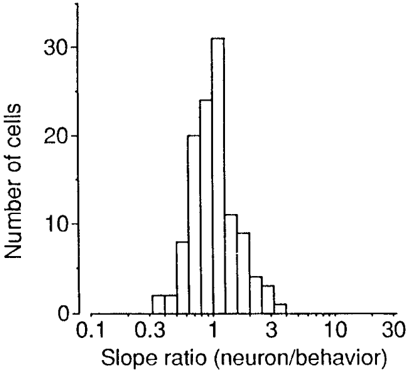
Figure 7 Relative slopes of neurometric and psychometric functions. The frequency histogram shows the ratio of the slope of the neurometric function (β) to the slope of the psychometric function (β) for the 120 experiments in our sample. Ratios less than unity indicate that the psychometric function was steeper than the neurometric function; ratios greater than unity indicate the converse.
Figure 7 Relative slopes of neurometric and psychometric functions. The frequency histogram shows the ratio of the slope of the neurometric function (β) to the slope of the psychometric function (β) for the 120 experiments in our sample. Ratios less than unity indicate that the psychometric function was steeper than the neurometric function; ratios greater than unity indicate the converse.CC-BY-NC-SA · From the PDF
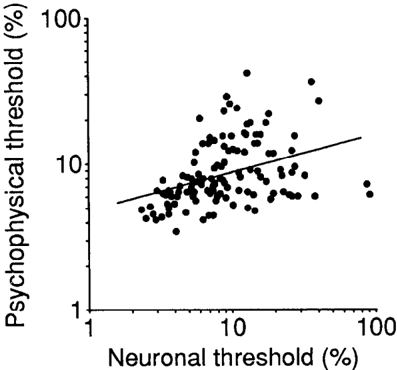
Figure 8 A scatterplot of neuronal threshold against psychophysical threshold for the 120 neurons in our sample. The solid line is the straight line that best fits the data (linear regression, r = 0.37, p ≤ 0.0001).
Figure 8 A scatterplot of neuronal threshold against psychophysical threshold for the 120 neurons in our sample. The solid line is the straight line that best fits the data (linear regression, r = 0.37, p ≤ 0.0001).CC-BY-NC-SA · From the PDF
Image 9
CC-BY-NC-SA · From the PDF
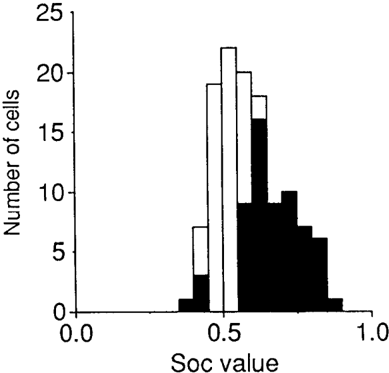
Figure 10 A frequency histogram of SOC values measured for the 120 MST neurons in our sample. Solid bars, representing 52% of the neurons in our sample, indicate SOC values that differed significantly from 0.5.
Figure 10 A frequency histogram of SOC values measured for the 120 MST neurons in our sample. Solid bars, representing 52% of the neurons in our sample, indicate SOC values that differed significantly from 0.5.CC-BY-NC-SA · From the PDF
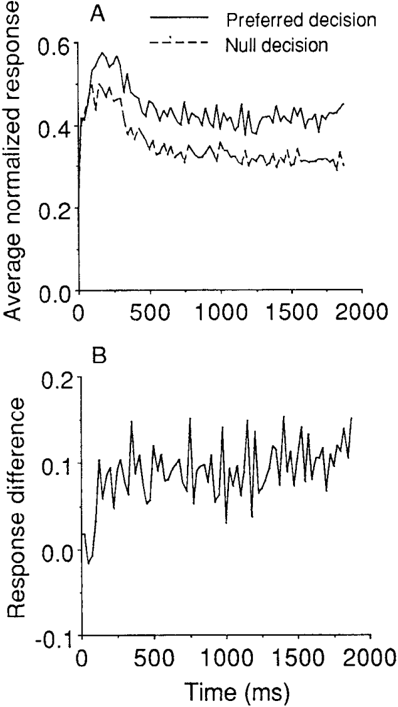
Figure 11 Time course of the SOC effect. A, Average responses are shown as a function of time within the 2 sec interval of visual stimulation. The solid line represents data for trials on which the monkey decided in favor of the preferred direction of motion; the dashed line depicts data for trials on which the monkey chose the null direction. Data from 57 MST neurons showing a significant SOC effect were normalized and averaged (0% correlation trials only). The bin size is 25 msec. B, Response difference as a function of time. The null decision data in A are subtracted from the preferred decision data, and the difference is plotted bin by bin.
Figure 11 Time course of the SOC effect. A, Average responses are shown as a function of time within the 2 sec interval of visual stimulation. The solid line represents data for trials on which the monkey decided in favor of the preferred direction of motion; the dashed line depicts data for trials on which the monkey chose the null direction. Data from 57 MST neurons showing a significant SOC effect were normalized and averaged (0% correlation trials only). The bin size is 25 msec. B, Response difference as a function of time. The null decision data in A are subtracted from the preferred decision data, and the difference is plotted bin by bin.CC-BY-NC-SA · From the PDF
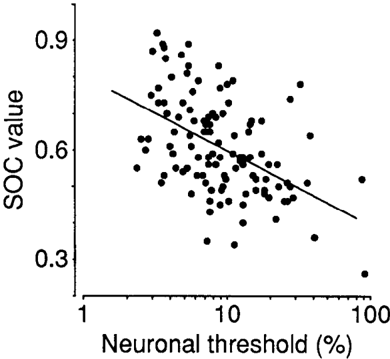
Figure 12 The relationship between the neuronal threshold (α) and SOC value for 120 MST neurons. The two measures are inversely related (r = −0.47, p ≤ 0.0001, slope = −0.17, intercept = 0.75), indicating that the responses of sensitive neurons were better correlated with the monkey's decisions.
Figure 12 The relationship between the neuronal threshold (α) and SOC value for 120 MST neurons. The two measures are inversely related (r = −0.47, p ≤ 0.0001, slope = −0.17, intercept = 0.75), indicating that the responses of sensitive neurons were better correlated with the monkey's decisions.CC-BY-NC-SA · From the PDF
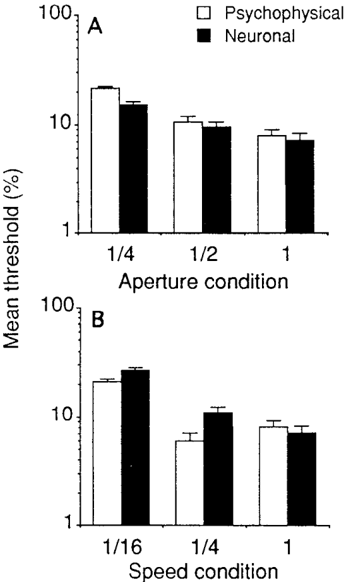
Figure 13 Influence of nonoptimal stimulus conditions on psychophysical and neuronal thresholds (open bars and solid bars, respectively). Thresholds are given as geometric means with associated error bars. A, Influence of aperture size. Three conditions were tested: an aperture diameter as close as possible to optimal (1), 50% of optimal (1/2), or 25% of optimal (1/4). All other stimulus parameters were held constant. B, Influence of stimulus speed. Three conditions were tested: (1) the optimal speed for the neuron, 25% of optimal (1/4), and 6.25% of optimal (1/16). All other parameters were held constant.
Figure 13 Influence of nonoptimal stimulus conditions on psychophysical and neuronal thresholds (open bars and solid bars, respectively). Thresholds are given as geometric means with associated error bars. A, Influence of aperture size. Three conditions were tested: an aperture diameter as close as possible to optimal (1), 50% of optimal (1/2), or 25% of optimal (1/4). All other stimulus parameters were held constant. B, Influence of stimulus speed. Three conditions were tested: (1) the optimal speed for the neuron, 25% of optimal (1/4), and 6.25% of optimal (1/16). All other parameters were held constant.CC-BY-NC-SA · From the PDF
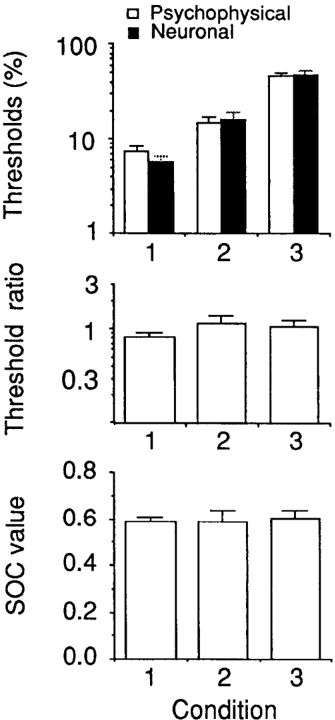
Figure 14 Psychophysical and neuronal performance when aperture size and speed are changed simultaneously. Top, Psychophysical and neuronal thresholds for three stimulus conditions: optimal speed and aperture size (1), 25% of optimal speed and 25% of optimal aperture diameter (2), 6.25% of optimal speed and 12.5% of optimal aperture diameter (3). Thresholds are given as geometric means with associated error bars. Middle, Ratios of neuronal threshold to psychophysical threshold for the three test conditions described in the top panel. Threshold ratios are given as geometric means with associated error bars. Bottom, Mean ŠOC values for the three test conditions described in the top panel.
Figure 14 Psychophysical and neuronal performance when aperture size and speed are changed simultaneously. Top, Psychophysical and neuronal thresholds for three stimulus conditions: optimal speed and aperture size (1), 25% of optimal speed and 25% of optimal aperture diameter (2), 6.25% of optimal speed and 12.5% of optimal aperture diameter (3). Thresholds are given as geometric means with associated error bars. Middle, Ratios of neuronal threshold to psychophysical threshold for the three test conditions described in the top panel. Threshold ratios are given as geometric means with associated error bars. Bottom, Mean ŠOC values for the three test conditions described in the top panel.CC-BY-NC-SA · From the PDF
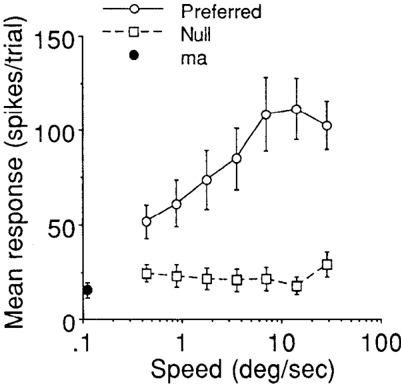
Figure 15 Mean response as a function of motion speed for 14 MST neurons. The open circles and the solid line represent responses to preferred direction motion; the open squares and the dashed line illustrate responses to null direction motion. The solid circle shows mean maintained activity for the 14 neurons. On average, the MST neurons responded well and were directionally selective across the entire range of speeds tested. Figure 15. Mean response as a function of motion speed for 14 MST neurons. The open circles and the solid line represent responses to preferred direction motion; the open squares and the dashed line illustrate responses to null direction motion. The solid circle shows mean maintained activity for the 14 neurons. On average, the MST neurons responded well and were directionally selective across the entire range of speeds tested.
Figure 15 Mean response as a function of motion speed for 14 MST neurons. The open circles and the solid line represent responses to preferred direction motion; the open squares and the dashed line illustrate responses to null direction motion. The solid circle shows mean maintained activity for the 14 neurons. On average, the MST neurons responded well and were directionally selective across the entire range of speeds tested. Figure 15. Mean response as a function of motion speed for 14 MST neurons. The open circles and the solid line represent responses to preferred direction motion; the open squares and the dashed line illustrate responses to null direction motion. The solid circle shows mean maintained activity for the 14 neurons. On average, the MST neurons responded well and were directionally selective across the entire range of speeds tested.CC-BY-NC-SA · From the PDF

Verification

Claims the paper makes

The claims and statistics of this paper haven’t been checked yet.

Run the check — free, no account needed. It reads the open-access text and checks the sources it cites.

A few free checks a day · papers already verified open instantly · results are public

Claims other papers make about this one

Each is checked against this paper’s own text: does it say what the citing paper says it does?

Self-check

Percentages, sums and reported differences re-computed from the paper’s own numbers.

The self-check needs the paper’s full text.

Citations

Cites

Research works printed but not linked: 4

  1. Albright TD (1993) Cortical processing of visual motion. In: Visual motion and its role in the stabilization of gaze (Miles FA, Wallman J, eds), pp 177-201. New York: Elsevier.
  2. Green DM, Swets JA (1966) Signal detection theory and psycho- physics. New York: Wiley.
  3. Hawken MJ, Parker AJ (1990) Detection and discrimination mech- anisms in the striate cortex of the Old-World monkey. In: Vision: coding and efficiency (Blakemore C, ed), pp 103-l 16. Cambridge: Cambridge UP.
  4. Newsome WT, B&ten KH, Movshon JA, Shadlen M (1989) Single neurons and the perception of visual motion. In: Neural mechanisms of visual perception. Proceedings of the retina research foundation (Lam DM-K, Gilbert CD, eds), pp 171-198. The Woodlands, TX: Portfolio.

Cited by

Sorted by citations

See all 232

Metadata

Authors
Celebrini, S., & Newsome, W.
Venue
The Journal of Neuroscience
Published
1994-07-01
Volume
14
Issue
7
Pages
4109-4124
ISSN
  • 0270-6474
  • 1529-2401
Cited by
232
References
4
Language
en

About these checks

Registry, retraction, Cites and statistics results are computed, not judged, with one exception: a printed reference that no index lists is read once by a model before it counts as a citation error. Claims are extracted by a model and kept only when their quote appears verbatim in the text; each cited source is then checked, with a model’s help, for whether it says what the claim relies on. Those verdicts can be wrong — read the claim’s quote and the cited source before relying on one.

Statistics and arithmetic are recomputed, not judged.

Confidence bands are shown only for fields calibrated on our annotated test set. None is calibrated yet, so no band is shown.

What counts as a claim ›How we measure confidence ›How we check this ›

Are you an author, or do you see a problem with this page? Request a review