

The DOI matches its Crossref record; 52 of the 52 references it cites were found in a registry or an index.
Control of Amygdala Circuits by 5-HT Neurons via 5-HT and Glutamate Cotransmission
Open accessAbstract
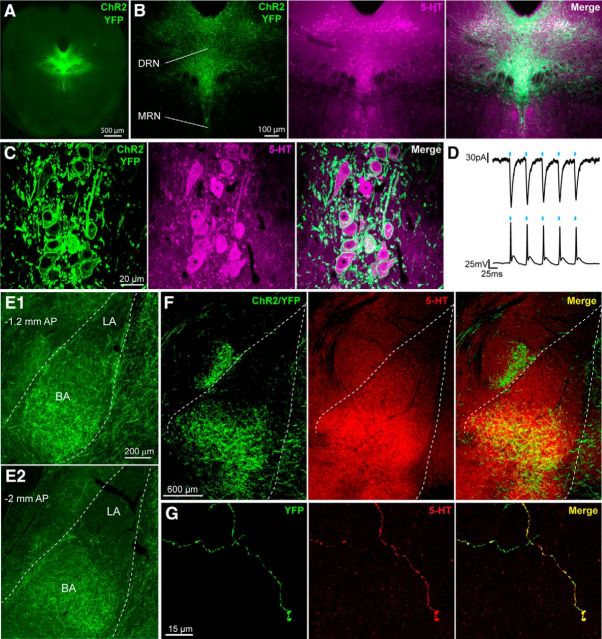
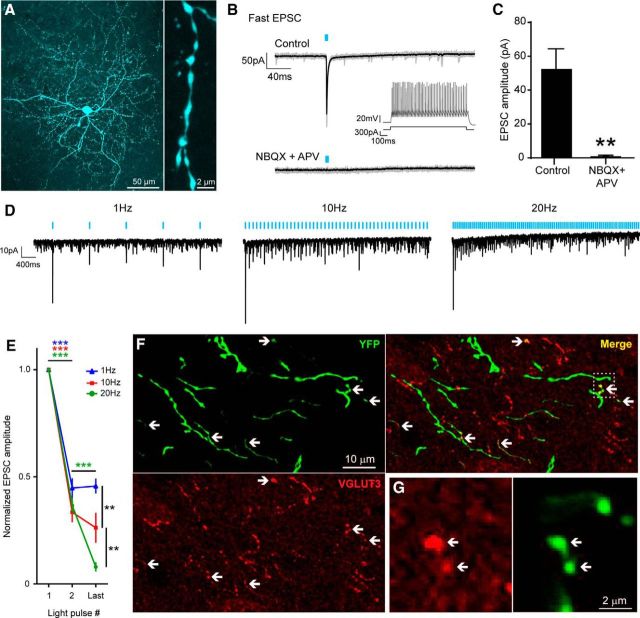
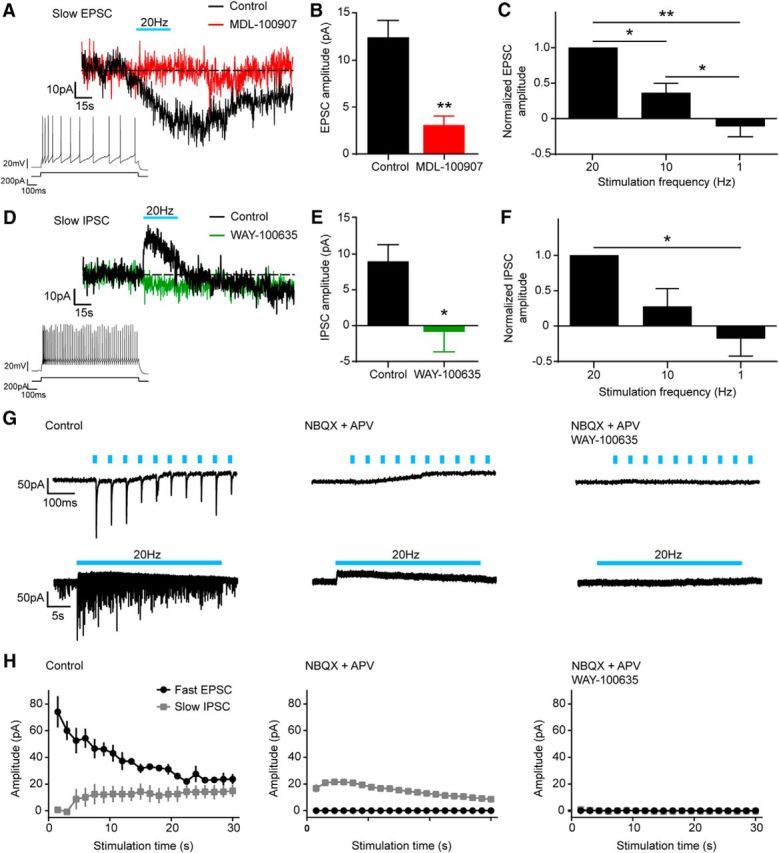
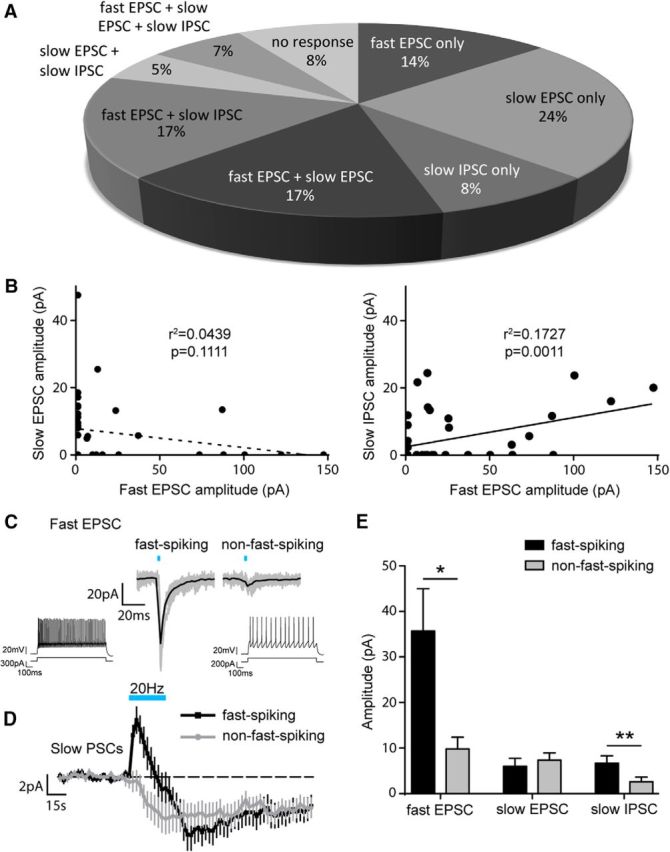
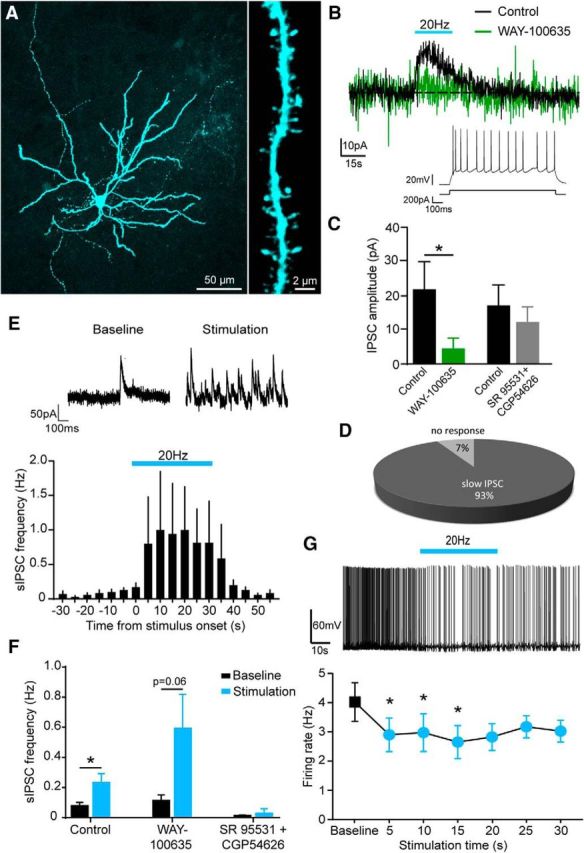
The serotonin (5-HT) system and the amygdala are key regulators of emotional behavior. Several lines of evidence suggest that 5-HT transmission in the amygdala is implicated in the susceptibility and drug treatment of mood disorders. Therefore, elucidating the physiological mechanisms through which midbrain 5-HT neurons modulate amygdala circuits could be pivotal in understanding emotional regulation in health and disease. To shed light on these mechanisms, we performed patch-clamp recordings from basal amygdala (BA) neurons in brain slices from mice with channelrhodopsin genetically targeted to 5-HT neurons. Optical stimulation of 5-HT terminals at low frequencies (≤1 Hz) evoked a short-latency excitation of BA interneurons (INs) that was depressed at higher frequencies. Pharmacological analysis revealed that this effect was mediated by glutamate and not 5-HT because it was abolished by ionotropic glutamate receptor antagonists. Optical stimulation of 5-HT terminals at higher frequencies (10–20 Hz) evoked both slow excitation and slow inhibition of INs. These effects were mediated by 5-HT because they were blocked by antagonists of 5-HT2Aand 5-HT1Areceptors, respectively. These fast glutamate- and slow 5-HT-mediated responses often coexisted in the same neuron. Interestingly, fast-spiking and non-fast-spiking INs displayed differential modulation by glutamate and 5-HT. Furthermore, optical stimulation of 5-HT terminals did not evoke glutamate release onto BA principal neurons, but inhibited these cells directly via activation of 5-HT1Areceptors and indirectly via enhanced GABA release. Collectively, these findings suggest that 5-HT neurons exert a frequency-dependent, cell-type-specific control over BA circuitry via 5-HT and glutamate co-release to inhibit the BA output. SIGNIFICANCE STATEMENTThe modulation of the amygdala by serotonin (5-HT) is important for emotional regulation and is implicated in the pathogenesis and treatment of affective disorders. Therefore, it is essential to determine the physiological mechanisms through which 5-HT neurons in the dorsal raphe nuclei modulate amygdala circuits. Here, we combined optogenetic, electrophysiological, and pharmacological approaches to study the effects of activation of 5-HT axons in the basal nucleus of the amygdala (BA). We found that 5-HT neurons co-release 5-HT and glutamate onto BA neurons in a cell-type-specific and frequency-dependent manner. Therefore, we suggest that theories on the contribution of 5-HT neurons to amygdala function should be revised to incorporate the concept of 5-HT/glutamate cotransmission.
Overview
The claims and statistics of this paper haven’t been checked yet.
Run the check — free, no account needed. It reads the open-access text and checks the sources it cites.
Integrity signals
Registry
Cites
Statistics
Figures
Verification
Claims the paper makes
The claims and statistics of this paper haven’t been checked yet.
Run the check — free, no account needed. It reads the open-access text and checks the sources it cites.
Claims other papers make about this one
Each is checked against this paper’s own text: does it say what the citing paper says it does?
In the citing paper
“~60% of DR serotonin neurons co-express the vesicular glutamate transporter Vglut3 in the rat (Gras et al., 2002) and co-release glutamate in the mouse (Liu et al., 2014; Sengupta et al., 2017).”
From Anatomically defined and functionally distinct dorsal raphe serotonin sub-systems (2018) · cites this paper as Sengupta et al., 2017
Self-check
Percentages, sums and reported differences re-computed from the paper’s own numbers.
The self-check needs the paper’s full text.
Citations
Cites
Steinbusch, H. W. M. (1981) · Neuroscience · doi:10.1016/0306-4522(81)90146-9 · Cited by 2,415
From circuits to behaviour in the amygdala
Janak, P. H., & Tye, K. M. (2015) · Nature · doi:10.1038/nature14188 · Cited by 2,011 · cited 1×
“The amygdala is a brain region that comprises multiple nuclei that collectively encode many aspects of emotionality including fear learning and memory (Duvarci and Pare, 2014; Janak and Tye, 2015).”
BackgroundPetilla terminology: nomenclature of features of GABAergic interneurons of the cerebral cortex
The Petilla Interneuron Nomenclature Group (PING) (2008) · Nature Reviews Neuroscience · doi:10.1038/nrn2402 · Cited by 1,491
Amygdala circuitry mediating reversible and bidirectional control of anxiety
Tye, K. M., Prakash, R., Kim, S.-Y., Fenno, L. E., Grosenick, L., Zarabi, H., Thompson, K. R., Gradinaru, V., Ramakrishnan, C., & Deisseroth, K. (2011) · Nature · doi:10.1038/nature09820 · Cited by 1,289
West, M. J. (1999) · Trends in Neurosciences · doi:10.1016/s0166-2236(98)01362-9 · Cited by 820
Amygdala Microcircuits Controlling Learned Fear
Duvarci, S., & Pare, D. (2014) · Neuron · doi:10.1016/j.neuron.2014.04.042 · Cited by 751
A third vesicular glutamate transporter expressed by cholinergic and serotoninergic neurons
Gras, C., Herzog, E., Bellenchi, G. C., Bernard, V., Ravassard, P., Pohl, M., Gasnier, B., Giros, B., & El Mestikawy, S. (2002) · The Journal of Neuroscience · doi:10.1523/jneurosci.22-13-05442.2002 · Cited by 639
A circuit mechanism for differentiating positive and negative associations
Namburi, P., Beyeler, A., Yorozu, S., Calhoon, G. G., Halbert, S. A., Wichmann, R., Holden, S. S., Mertens, K. L., Anahtar, M., Felix-Ortiz, A. C., et al. (2015) · Nature · doi:10.1038/nature14366 · Cited by 614
Long-range connectivity defines behavioral specificity of amygdala neurons
Senn, V., Wolff, S. B. E., Herry, C., Grenier, F., Ehrlich, I., Gründemann, J., Fadok, J. P., Müller, C., Letzkus, J. J., & Lüthi, A. (2014) · Neuron · doi:10.1016/j.neuron.2013.11.006 · Cited by 522
Amygdala interneuron subtypes control fear learning through disinhibition
Wolff, S. B. E., Gründemann, J., Tovote, P., Krabbe, S., Jacobson, G. A., Müller, C. R., Herry, C., Ehrlich, I., Friedrich, R. W., Letzkus, J. J., et al. (2014) · Nature · doi:10.1038/nature13258 · Cited by 515
Cited by
Sorted by citations
Items 101–136 of 136
Collins, H. M., Gullino, L. S., Fuller, C., Pinacho, R., Bannerman, D. M., & Sharp, T. (2025) · Neuropharmacology · doi:10.1016/j.neuropharm.2025.110541 · Cited by 3
“The latter comprise an important subpopulation of midbrain 5-HT neurons that have recently been linked to anxiety-like behaviours and stress responses (Sengupta et al., 2017; Ren et al., 2018; Gullino et al., 2024).”
Roles of the Serotoninergic System in Coping with Traumatic Stress
Vitalis, T., & Verney, C. (2021) · IntechOpen eBooks · doi:10.5772/intechopen.97221 · Cited by 4
“Abbreviation list 5-HT 5-hydroxytryptamin 5-HIAA 5hydroxyindolacetic acid AADC aminoacid decarboxylase ACTH adrenocorticotropic hormone AMY amygdala complex BA basal nucleus of amygdala BBB brain blood barrier BLA basolateral nucleus of amygdala BNST bed nucleus of the stria terminalis cAMP cyclic adenosin monophospha…”
BackgroundInfluentialCellular effects of serotonin in the CNS
Andrade, R., & Haj‐Dahmane, S. (2020) · Handbook of behavioral neuroscience · doi:10.1016/b978-0-444-64125-0.00015-3 · Cited by 3
Kolling, L. J., Balasubramanian, N., Ismail, S., Feller, A. J., Alberhasky, J. M. H., Wang, R., Jennings, L., Hefti, M. M., & Marcinkiewcz, C. A. (2026) · Alzheimer s & Dementia · doi:10.1002/alz.71317 · Cited by 2
Saito, Y., & Sugimura, T. (2025) · eNeuro · doi:10.1523/eneuro.0352-25.2025 · Cited by 3
Reverse-filtering on extracellular action potential for waveform analysis
Mizuhiki, T., Setogawa, T., & Shidara, M. (2019) · Neuroscience Research · doi:10.1016/j.neures.2019.10.009 · Cited by 2
Filippo, R. D. (2021) · DZNE Pub · doi:10.6084/m9.figshare.14229545 · Cited by 2
Araragi, N., Petermann, M., Mototaka Suzuki, A., Larkum, M. E., Mosienko, V., Bäder, M., Alenina, N. V., & Klempin, F. (2025) · ACS Chemical Neuroscience · doi:10.1021/acschemneuro.4c00771 · Cited by 1
Hyperexcitability of female serotonin neurons underlies sex-specific anxiety responsesPreprint
Pizzoccaro, L., van der Veldt, S., Henderson, F. J., Simard, A.-S., Perreault, F., Fortin‐Houde, J., Lalot, E., Ducharme, G., & Amilhon, B. (2025) · bioRxiv (Cold Spring Harbor Laboratory) · doi:10.1101/2025.08.17.670715 · Cited by 3
Neurotransmitters and signalling
Sharp, T. (2020) · doi:10.1093/med/9780198713005.003.0014
Optogenetic Studies of the Pathophysiological Mechanisms and Treatment of Depression
Дыгало, Н. Н., & Shishkina, G. T. (2019) · Neuroscience and Behavioral Physiology · doi:10.1007/s11055-019-00712-4
The Ministry of Fear: ‘The Conjuring’ of Fright in the Amygdala by the Raphe
Tiwari, P., Fanibunda, S. E., & Vaidya, V. A. (2019) · Neuron · doi:10.1016/j.neuron.2019.07.020
Dopamine and Opioid regulation of amygdala function
Patel, S. (2020) · The Sydney eScholarship Repository (The University of Sydney)
The Receptor Basis of Serotonergic Modulation in an Olfactory Network
Sizemore, T. R. (2021) · The Research Repository @ WVU (West Virginia University) · doi:10.33915/etd.8318
Marco Capogna, a pioneering neuroscientist and true European
Ferraguti, F., Fredes, F., Hou, W., Somogyi, P., & Thompson, S. (2023) · European Journal of Neuroscience · doi:10.1111/ejn.15950
Kiyokawa, Y., Ootaki, M., Kambe, Y., Tanaka, K., Kimura, G., Tanikawa, T., & Takeuchi, Y. (2023) · SSRN Electronic Journal · doi:10.2139/ssrn.4635802
Effects of SSRIs on the spatial transcriptome of dorsal raphe serotonin neurons
Henningson, C., Mlost, J., & Dorocic, I. P. (2026) · Molecular Psychiatry · doi:10.1038/s41380-026-03644-x · Cited by 2
“Brain tissue was fl ash-frozen on dry ice and stored at − 80 °C. Cryosections were cut at 10 μ m (spatial transcriptomics) or 20 μ m (RNAscope) and mounted on Visium slides or SuperFrost+ slides, respectively.”
Fan, Y., Ge, S., Lu, L., Niu, W., Wang, Z., Jiao, X., & Fang, G. (2024) · bioRxiv (Cold Spring Harbor Laboratory) · doi:10.1101/2024.11.12.623319
Zhao, B., Wang, Y., Wang, S., Mu, G., & Wu, X. (2024) · Journal of the Science of Food and Agriculture · doi:10.1002/jsfa.14032
Hirai, H., Konno, K., Yamasaki, M., Watanabe, M., Sakaba, T., & Hashimotodani, Y. (2024) · eLife · doi:10.7554/elife.99711.2 · Cited by 1
Neurobiology of Ingestive Behavior
Howe, W. M., & DiFeliceantonio, A. G. (2025) · Oxford University Press eBooks · doi:10.1093/9780197675212.003.0003
Ye, S., Dave, A., Lan, X., Witter, M. P., Salami, A., & Ziaei, M. (2026) · bioRxiv (Cold Spring Harbor Laboratory) · doi:10.64898/2026.02.04.703682
Saidi, L., Rioux, V., Wallman, M., Rajan, S. S., Metzakopian, E., Lévesque, M., Proulx, C. D., & Parent, M. (2026) · bioRxiv (Cold Spring Harbor Laboratory) · doi:10.64898/2026.02.23.707446
Fan, Y.-Z., Ge, S., Lu, L.-D., Niu, W., Wang, Z., Jiao, X.-G., & Fang, G.-Z. (2026) · PLoS Biology · doi:10.1371/journal.pbio.3003687
Régulation du sommeil et de l’anxiété par VGLUT3, le transporteur vésiculaire du glutamate de type 3
Henderson, F. J. (2019) · theses.fr (ABES) · doi:10.70675/72ea7d04ze3b3z4768zab1fz66b684e1ed22
Rôle du récepteur 5-HT2B dans la motilité des cellules microgliales
Etienne, F. (2020) · theses.fr (ABES) · doi:10.70675/525a2c9ez9415z45f8z8838z1155f108aaf2
The role of VGLUT3 in behaviour, with a focus on VGLUT3 positive neurons of the median raphe region
Fazekas, C. L. (2023) · theses.fr (ABES) · doi:10.70675/517bbedbz9f8ez4541z9f7dzead2ac6bb84e
Yates, J. R. (2026) · Springer eBooks · doi:10.1007/978-3-032-15602-0_9
Venkatesh, S., Prisinzano, H., Lipari, N., Nardiello, J., Budrow, C., McManus, G., Wheelis, E., Manfredsson, F. P., Tseng, K. Y., Stokes, A. M., et al. (2026) · Research Square · doi:10.21203/rs.3.rs-9917408/v1
Role of the Amygdala in the Complex Relationship Between Sleep and Anxiety
Grzybowski, F., Kaczmarski, P., Strzelecki, D., Wysokiński, A., Białasiewicz, P., & Gabryelska, A. (2026) · International Journal of Molecular Sciences · doi:10.3390/ijms27177814
“For instance, activation of 5-HT1A receptors generally inhibits amygdala activity, leading to anxiolytic effects, while stimulation of 5-HT2A receptors can enhance excitatory neurotransmission, potentially contributing to anxiety and fear responses [22].”
Circuit-specific remodeling of synaptic co-transmission in stress-responsive networks
Park, H., Kim, H., Sim, M., Ham, D., & Chung, C. (2026) · Animal Cells and Systems · doi:10.1080/19768354.2026.2730204
“…circuits, serotonin–glutamate co-transmission supports rapid modulation of cortical activity (Ren et al. 2018), whereas in the BA and VTA it contributes to anxiety-related behaviors and motivational processing through distinct synaptic mechanisms (Qi et al. 2014; Sengupta et al. 2017) (Figure 1A).”
InfluentialAmygdala: Function and neural basis
Chen, G.-D. (2026) · Hearing Research · doi:10.1016/j.heares.2026.109839
Taherianfard, M., Rowhanirad, S., & Arefkashfi, S. A. (2026) · Journal of Kermanshah University of Medical Sciences · doi:10.5812/jkums-173063
“The inhibitory action of serotonin may occur either directly through 5-HT2 α receptor activation on BLA neurons or indirectly via GABAergic interneurons expressing 5-HT3 receptors (26).”
Coordinated cerebellar–midbrain activity for predictive signaling during fear learning in micePreprint
Desmaison, J. D. U., Léna, C., & Popa, D. (2026) · bioRxiv (Cold Spring Harbor Laboratory) · doi:10.64898/2026.10.17.759883
Serotonergic control of valence processing in amygdalo- striaterminalis circuits
Lim, I. E., & Ogundele, O. M. (2026) · Frontiers in Neural Circuits · doi:10.3389/fncir.2026.1906095
“Previous studies have shown that the amygdala and BNST express distinct 5-HT receptors (Douglass et al., 2017; Sengupta et al., 2017; Asan et al., 2013; Hazra et al., 2012; Levita et al., 2004; Guo et al., 2009).”
Metadata
- Authors
- Sengupta, A., Bocchio, M., Bannerman, D. M., Sharp, T., & Capogna, M.
- Affiliations
- University of Oxford (GB)
- Aarhus University (DK)
- Corresponding author
- Sharp, Trevor
- Capogna, Marco
- Venue
- The Journal of Neuroscience
- Publisher
- Society for Neuroscience
- Published
- 2017-01-13
- Volume
- 37
- Issue
- 7
- Pages
- 1785-1796
- ISSN
- 0270-6474 (ISSN-L)
- 1529-2401
- PMC
- PMC5320609
- OpenAlex
- W2573649328
- Cited by
- 136
- References
- 52
- Citations by year
- 2026: 15 · 2025: 9 · 2024: 18 · 2023: 13 · 2022: 9 · 2021: 19 · 2020: 21 · 2019: 18 · 2018: 11 · 2017: 3
- FWCI
- 7.10
- Type
- journal article
- Language
- en
- Open access
- hybrid
- doi.org
- Locations
- Journal of Neuroscience (publishedVersion, cc-by)
- PubMed Central (publishedVersion, cc-by)
- PubMed (publishedVersion)
- Durham Research Online (Durham University) (submittedVersion, cc-by)
- Scopus (Elsevier) (submittedVersion)
- Newcastle University ePrints (Newcastle Univesity) (cc-by)
- Funders
- Wellcome Trust
- University of Oxford
- National Institutes of Health
- Medical Research Council
- Topics
- Life Sciences › Neuroscience › Cellular and Molecular Neuroscience › Neuroscience and Neuropharmacology Research
- Life Sciences › Neuroscience › Cellular and Molecular Neuroscience › Neurotransmitter Receptor Influence on Behavior
- Life Sciences › Neuroscience › Cognitive Neuroscience › Memory and Neural Mechanisms
- Keywords
- serotonin, glutamate co-release, amygdala, basal amygdala, dorsal raphe nucleus, 5-HT1A receptor, 5-HT2A receptor, interneurons, principal neurons, emotion regulation, mood disorders, GABA release, optogenetics, channelrhodopsin, ionotropic glutamate receptors, fast-spiking interneurons
- MeSH terms
- Channelrhodopsins, Amygdala, Animals, Animals, Newborn, Female, Luminescent Proteins, Male, Mice, Inbred C57BL, Mice, Transgenic, Nerve Net, Synaptic Transmission, Neurons, Piperazines, Pyridines, Receptors, Serotonin, Serotonin, Serotonin Antagonists, Excitatory Amino Acid Agents, Glutamic Acid, GABA Antagonists, Serotonin Plasma Membrane Transport Proteins, Mice
About these checks
Registry, retraction, Cites and statistics results are computed, not judged, with one exception: a printed reference that no index lists is read once by a model before it counts as a citation error. Claims are extracted by a model and kept only when their quote appears verbatim in the text; each cited source is then checked, with a model’s help, for whether it says what the claim relies on. Those verdicts can be wrong — read the claim’s quote and the cited source before relying on one.
Statistics and arithmetic are recomputed, not judged.
Confidence bands are shown only for fields calibrated on our annotated test set. None is calibrated yet, so no band is shown.
What counts as a claim ›How we measure confidence ›How we check this ›
Are you an author, or do you see a problem with this page? Request a review
