

The DOI matches its Crossref record; 52 of the 52 references it cites were found in a registry or an index.
Supraspinal Brain-Derived Neurotrophic Factor Signaling: A Novel Mechanism for Descending Pain Facilitation
Open accessAbstract
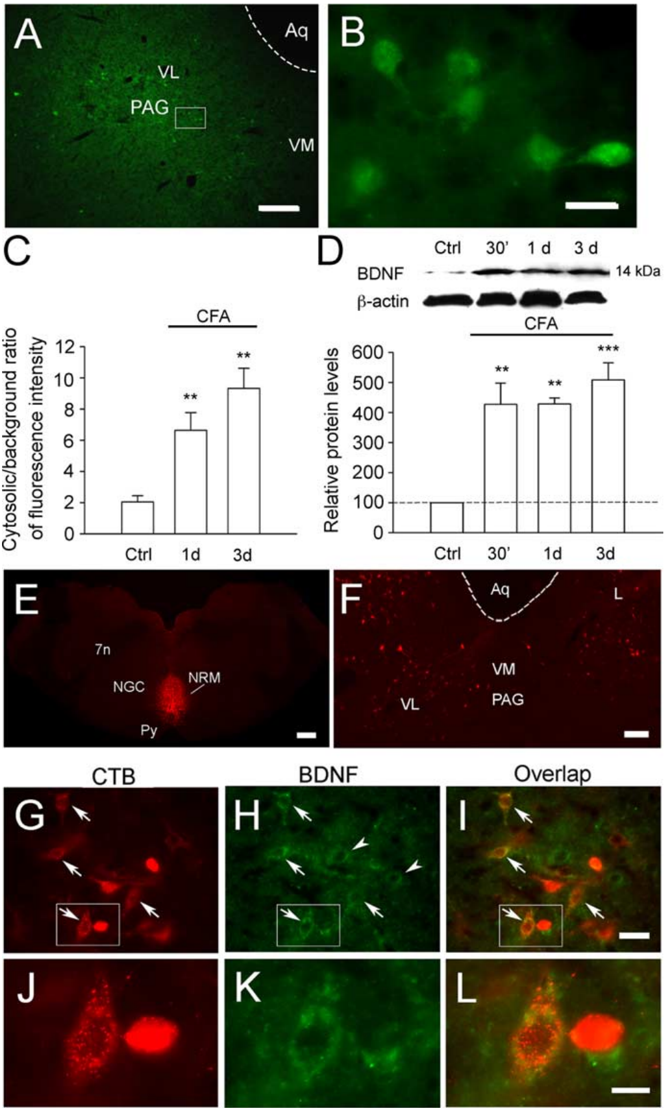
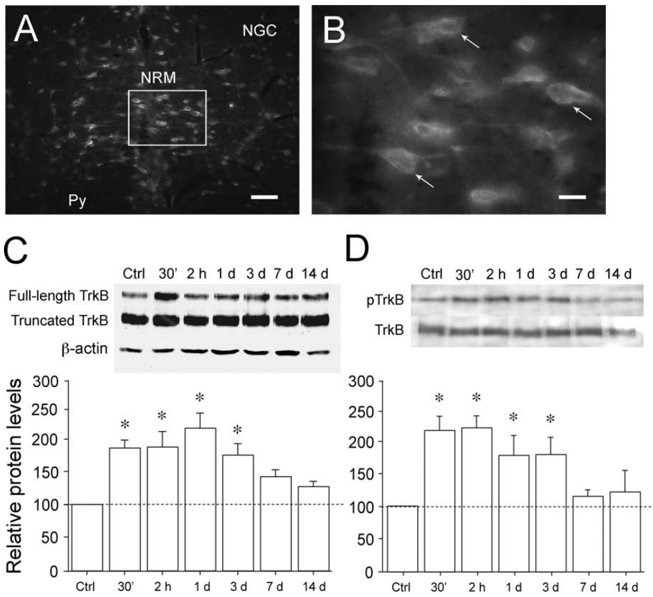
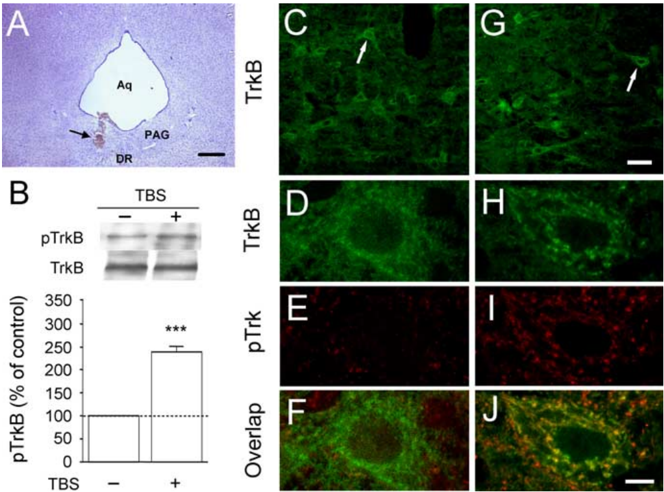
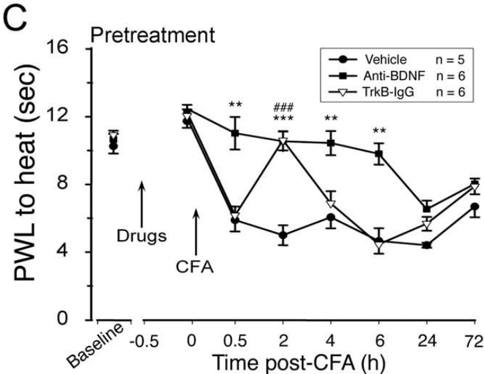
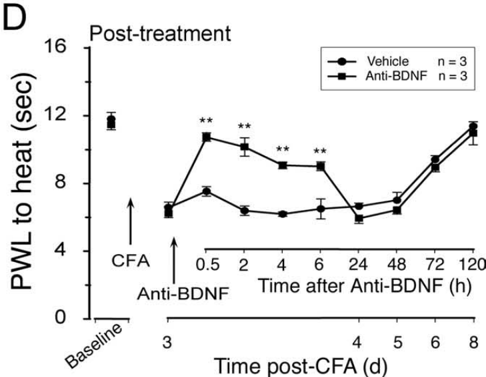
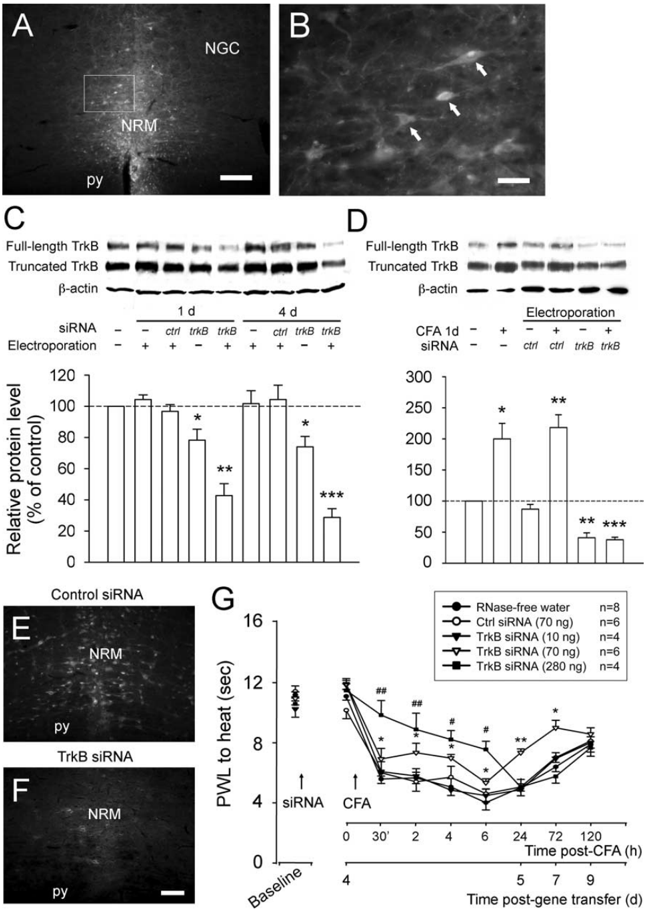
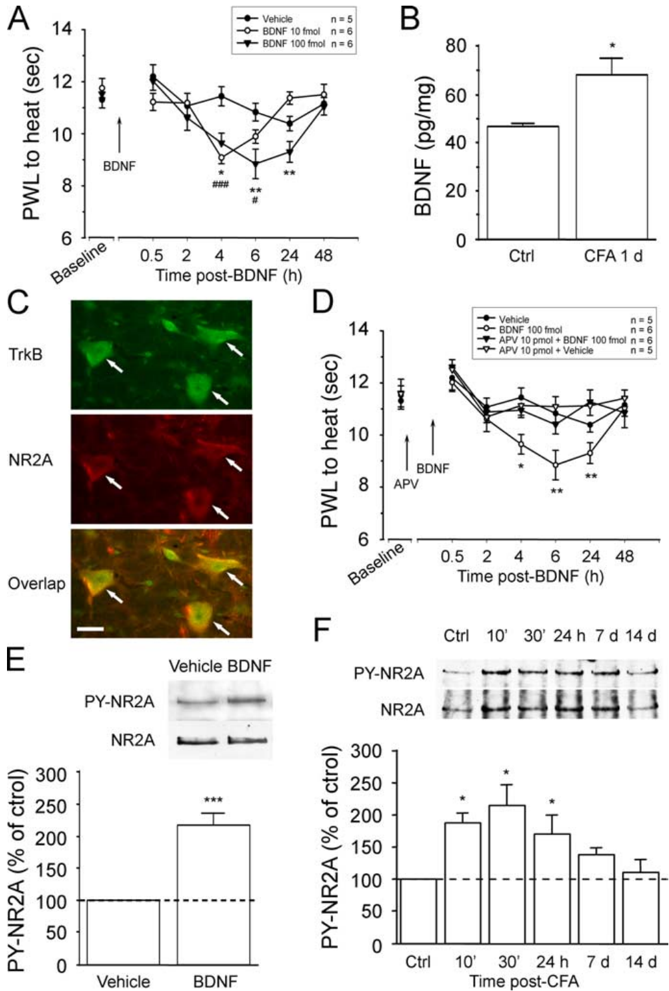
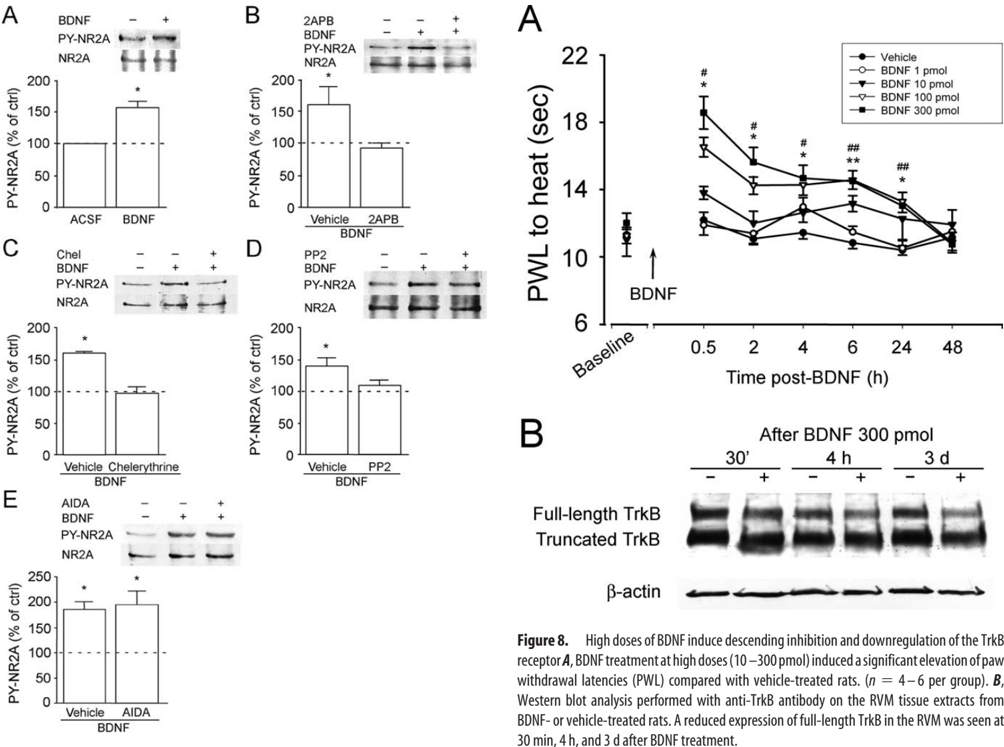
In the adult mammalian brain, brain-derived neurotrophic factor (BDNF) is critically involved in long-term synaptic plasticity. Here, we show that supraspinal BDNF-tyrosine kinase receptor B (TrkB) signaling contributes to pain facilitation. We show that BDNF-containing neurons in the periaqueductal gray (PAG), the central structure for pain modulation, project to and release BDNF in the rostral ventromedial medulla (RVM), a relay between the PAG and spinal cord. BDNF in PAG and TrkB phosphorylation in RVM neurons are upregulated after inflammation. Intra-RVM sequestration of BDNF and knockdown of TrkB by RNA interference attenuate inflammatory pain. Microinjection of BDNF (10-100 fmol) into the RVM facilitates nociception, which is dependent on NMDA receptors (NMDARs). In vitro studies with RVM slices show that BDNF induces tyrosine phosphorylation of the NMDAR NR2A subunit in RVM via a signal transduction cascade involving IP(3), PKC, and Src. The supraspinal BDNF-TrkB signaling represents a previously unknown mechanism underlying the development of persistent pain. Our findings also caution that application of BDNF for recovery from CNS disorders could lead to undesirable central pain.
Overview
The claims and statistics of this paper haven’t been checked yet.
Run the check — free, no account needed. It reads the open-access text and checks the sources it cites.
Integrity signals
Registry
Cites
Statistics
Figures
Verification
Claims the paper makes
The claims and statistics of this paper haven’t been checked yet.
Run the check — free, no account needed. It reads the open-access text and checks the sources it cites.
Claims other papers make about this one
Each is checked against this paper’s own text: does it say what the citing paper says it does?
In the citing paper
“BDNF enhances the pain signal transmission in the descending control system (170).”
From Nociplastic pain: the prominent role of non-neuronal cells in central and peripheral sensitization (2026) · cites this paper as [170]
Self-check
Percentages, sums and reported differences re-computed from the paper’s own numbers.
The self-check needs the paper’s full text.
Citations
Cites
The Rat Brain in Stereotaxic Coordinates
Paxinos, G., & Watson, C. (1983) · Elsevier eBooks · doi:10.1016/c2009-0-63235-9 · Cited by 28,585
Molecular Mechanisms of Depression: Perspectives on New Treatment Strategies
Lang, U. E., & Borgwardt, S. (2013) · Cellular Physiology and Biochemistry · doi:10.1159/000350094 · Cited by 8,526
A new and sensitive method for measuring thermal nociception in cutaneous hyperalgesia
Hargreaves, K., Dubner, R. A., Brown, F. J., Flores, C., & Joris, J. L. (1988) · Pain · doi:10.1016/0304-3959(88)90026-7 · Cited by 5,155
Self-citationTrk Receptors: Roles in Neuronal Signal Transduction
Huang, E. J., & Reichardt, L. F. (2003) · Annual Review of Biochemistry · doi:10.1146/annurev.biochem.72.121801.161629 · Cited by 2,537 · cited 1×
“The effects of BDNF are mediated through its binding to the tyrosine kinase receptor B (TrkB) and subsequent activation of downstream signaling pathways (Huang and Reichardt, 2003).”
BackgroundBonica, J. J., Melzack, R., & Wall, P. D. (1999) · Cited by 2,537
Figurov, A., Pozzo-Miller, L. D., Olafsson, P., Wang, T., & Lu, B. (1996) · Nature · doi:10.1038/381706a0 · Cited by 1,106
Conner, J. M., Lauterborn, J. C., Yan, Q., Gall, C. M., & Varon, S. (1997) · The Journal of Neuroscience · doi:10.1523/jneurosci.17-07-02295.1997 · Cited by 1,097
Chronic pain and medullary descending facilitation
Porreca, F. (2002) · Trends in Neurosciences · doi:10.1016/s0166-2236(02)02157-4 · Cited by 1,007
BDNF and Activity-Dependent Synaptic Modulation: Figure 1.
Lu, B. (2003) · Learning & Memory · doi:10.1101/lm.54603 · Cited by 945
Activation of p75NTR by proBDNF facilitates hippocampal long-term depression
Woo, N. H., Teng, H. K., Siao, C.-J., Chiaruttini, C., Pang, P. T., Milner, T. A., Hempstead, B. L., & Lu, B. (2005) · Nature Neuroscience · doi:10.1038/nn1510 · Cited by 815
Research works printed but not linked: 2
- 1999, Proc Natl Acad Sci USA, 69, 7687
- 10.1038/nn855 · DOI
Cited by
Sorted by citations
The mechanisms of manual therapy in the treatment of musculoskeletal pain: A comprehensive model
Bialosky, J. E., Bishop, M. D., Price, D. D., Robinson, M. E., & George, S. Z. (2008) · Manual Therapy · doi:10.1016/j.math.2008.09.001 · Cited by 1,146
Descending pain modulation and chronification of pain
Ossipov, M. H., Morimura, K., & Porreca, F. (2014) · Current Opinion in Supportive and Palliative Care · doi:10.1097/spc.0000000000000055 · Cited by 875
Central mechanisms of pathological pain
Kuner, R. (2010) · Nature Medicine · doi:10.1038/nm.2231 · Cited by 795
Chapman, C. R., & Vierck, C. J. (2017) · The Journal of Pain · doi:10.1016/j.jpain.2016.11.004 · Cited by 423
Neurobiology of depression, fibromyalgia and neuropathic pain
Maletic, V. (2009) · Frontiers in bioscience · doi:10.2741/3598 · Cited by 384
Merighi, A., Salio, C., Ghirri, A., Lossi, L., Ferrini, F., Betelli, C., & Bardoni, R. (2008) · Progress in Neurobiology · doi:10.1016/j.pneurobio.2008.04.004 · Cited by 362
Supraspinal Glial–Neuronal Interactions Contribute to Descending Pain Facilitation
Wei, F., Guo, W., Zou, S., Ren, K., & Dubner, R. A. (2008) · Journal of Neuroscience · doi:10.1523/jneurosci.3593-08.2008 · Cited by 322
Self-citationRoles of reactive oxygen and nitrogen species in pain
Salvemini, D., Little, J. W., Doyle, T. M., & Neumann, W. L. (2011) · Free Radical Biology and Medicine · doi:10.1016/j.freeradbiomed.2011.01.026 · Cited by 311
BDNF in sensory neurons and chronic pain
Obata, K., & Noguchi, K. (2006) · Neuroscience Research · doi:10.1016/j.neures.2006.01.005 · Cited by 243
The physiology of regulated BDNF release
Brigadski, T., & Leßmann, V. (2020) · Cell and Tissue Research · doi:10.1007/s00441-020-03253-2 · Cited by 218
Norman, G. J., Karelina, K., Zhang, N., Walton, J. C., Morris, J. S., & DeVries, A. C. (2010) · Molecular Psychiatry · doi:10.1038/mp.2009.91 · Cited by 209
Wei, F., Dubner, R. A., Zou, S., Ren, K.-Y., Bai, G., Di, W., & Guo, W. (2010) · Journal of Neuroscience · doi:10.1523/jneurosci.5389-09.2010 · Cited by 208
Self-citationNeurotrophins and Neuropathic Pain: Role in Pathobiology
Khan, N., & Smith, M. T. (2015) · Molecules · doi:10.3390/molecules200610657 · Cited by 199
Samineni, V. K., Grajales‐Reyes, J. G., Copits, B. A., O’Brien, D. E., Trigg, S. L., Gomez, A. M., Bruchas, M. R., & Gereau, R. W. (2017) · eNeuro · doi:10.1523/eneuro.0129-16.2017 · Cited by 188
Nijs, J., Meeus, M., Versijpt, J. J., Moens, M., Bos, I., Knaepen, K., & MEEUSEN, R. R. (2014) · Expert Opinion on Therapeutic Targets · doi:10.1517/14728222.2014.994506 · Cited by 187
Epigenetics and the Transition from Acute to Chronic Pain
Buchheit, T. E., de Ven, T. V., & Shaw, A. (2012) · Pain Medicine · doi:10.1111/j.1526-4637.2012.01488.x · Cited by 178
Pain Pathways and Nervous System Plasticity: Learning and Memory in Pain
McCarberg, B. H., & Peppin, J. F. (2019) · Pain Medicine · doi:10.1093/pm/pnz017 · Cited by 192
BDNF: The career of a multifaceted neurotrophin in spinal cord injury
Weishaupt, N., Blesch, A., & Fouad, K. (2012) · Experimental Neurology · doi:10.1016/j.expneurol.2012.09.001 · Cited by 168
DeSantana, J. M., Silva, L. F. S. D., Resende, M. A. D., & Sluka, K. A. (2009) · Neuroscience · doi:10.1016/j.neuroscience.2009.06.056 · Cited by 160
Spinal Plasticity and Behavior: BDNF-Induced Neuromodulation in Uninjured and Injured Spinal Cord
Garraway, S. M., & Huie, J. R. (2016) · Neural Plasticity · doi:10.1155/2016/9857201 · Cited by 165
Protein kinase C in pain: Involvement of multiple isoforms
Velázquez, K. T., Mohammad, H. K., & Sweitzer, S. M. (2007) · Pharmacological Research · doi:10.1016/j.phrs.2007.04.006 · Cited by 151
Zhu, X., Li, Q., Chang, R., Yang, D., Song, Z., Guo, Q., & Huang, C. (2014) · PLoS ONE · doi:10.1371/journal.pone.0091303 · Cited by 149
Carlson, J. D., Maire, J. J., Martenson, M. E., & Heinricher, M. M. (2007) · Journal of Neuroscience · doi:10.1523/jneurosci.3715-07.2007 · Cited by 141
Ni, H., Wang, Y., An, K., Liu, Q., Xu, L., Zhu, C., Deng, H., He, Q., Wang, T., Xu, M., et al. (2019) · Journal of Neuroinflammation · doi:10.1186/s12974-018-1391-2 · Cited by 139
Epigenetics in pain and analgesia: An imminent research field
Doehring, A., Geißlinger, G., & Lötsch, J. (2010) · European Journal of Pain · doi:10.1016/j.ejpain.2010.06.004 · Cited by 121
Ren, K., & Dubner, R. A. (2007) · Molecular Neurobiology · doi:10.1007/s12035-007-0028-8 · Cited by 124
Self-citationBone Marrow Stromal Cells Produce Long-Term Pain Relief in Rat Models of Persistent Pain
Guo, W., Wang, H., Zou, S., Gu, M., Watanabe, M., Wei, F., Dubner, R. A., Huang, G. T. ‐., & Ren, K. (2011) · Stem Cells · doi:10.1002/stem.667 · Cited by 111
Self-citationSmith, P. A. (2014) · Neuroscience · doi:10.1016/j.neuroscience.2014.05.044 · Cited by 110
Boadas‐Vaello, P., Castany, S., Homs, J., Álvarez-Pérez, B., Deulofeu, M., & Verdú, E. (2016) · Spinal Cord · doi:10.1038/sc.2015.225 · Cited by 106
Caumo, W., Deitos, A., Carvalho, S., Leite, J., Carvalho, F. M., Dussán‐Sarria, J. A., Tarragó, M. D. G. L., de Souza, A., Torres, I. L. D. S., & Fregni, F. (2016) · Frontiers in Human Neuroscience · doi:10.3389/fnhum.2016.00357 · Cited by 112
The search for novel analgesics: targets and mechanisms
Yaksh, T. L., Woller, S. A., Ramachandran, R., & Sorkin, L. S. (2015) · F1000Prime Reports · doi:10.12703/p7-56 · Cited by 100
Tajerian, M., Leu, D., Zou, Y., Sahbaie, P., Li, W., Khan, H., Hsu, V. C., Kingery, W. S., Huang, T., Becerra, L. R., et al. (2014) · Anesthesiology · doi:10.1097/aln.0000000000000403 · Cited by 99
Zhang, W., Gardell, S. E., Zhang, D., Xie, J. Y., Agnes, R. S., Badghisi, H., Hruby, V. J., Rance, N. E., Ossipov, M. H., Vanderah, T. W., et al. (2008) · Brain · doi:10.1093/brain/awn330 · Cited by 94
Wang, X., Ratnam, J., Zou, B., England, P. M., & Basbaum, A. I. (2009) · Journal of Neuroscience · doi:10.1523/jneurosci.4288-08.2009 · Cited by 91
Zhuo, M. (2017) · Molecular Pain · doi:10.1177/1744806917699212 · Cited by 90
Acupuncture-Analgesia-Mediated Alleviation of Central Sensitization
Lai, H.-C., Lin, Y., & Hsieh, C. (2019) · Evidence-based Complementary and Alternative Medicine · doi:10.1155/2019/6173412 · Cited by 87
Maratou, K., Wallace, V. C. J., Hasnie, F. S., Okuse, K., Hosseini, R., Jina, N., Blackbeard, J., Pheby, T., Orengo, C. A., Dickenson, A. H., et al. (2008) · European Journal of Pain · doi:10.1016/j.ejpain.2008.05.011 · Cited by 89
Bałkowiec-Iskra, E., Vermehren‐Schmaedick, A., & Bałkowiec, A. (2011) · Neuroscience · doi:10.1016/j.neuroscience.2011.02.028 · Cited by 87
Lee, M., Moon, W., & Kim, J. (2014) · Evidence-based Complementary and Alternative Medicine · doi:10.1155/2014/203173 · Cited by 85
Rodrigues, G. M., Toffoli, L. V., Manfredo, M. H. F., de Oliveira, J. F., Silva, A. S., Raquel, H. D. A., Martins‐Pinge, M. C., Moreira, E. G., Fernandes, K. B. P., Pelosi, G. G., et al. (2014) · Behavioural Brain Research · doi:10.1016/j.bbr.2014.11.023 · Cited by 84
Little, J. W., Doyle, T. M., & Salvemini, D. (2010) · Amino Acids · doi:10.1007/s00726-010-0633-0 · Cited by 84
Thibault, K., Lin, W. K., Rancillac, A., Fan, M., Snollaerts, T., Sordoillet, V., Hamon, M., Smith, G. M., Lenkei, Z., & Pezet, S. (2014) · Journal of Neuroscience · doi:10.1523/jneurosci.0860-14.2014 · Cited by 83
Vry, J. D., Martínez‐Martínez, P., Losen, M. H., Temel, Y., Steckler, T., Steinbusch, H. W. M., Baets, M. H. D., & Prickaerts, J. (2010) · Progress in Neurobiology · doi:10.1016/j.pneurobio.2010.10.001 · Cited by 73
Pharmacology of Morphine in Obese Patients
Lloret‐Linares, C., Declèves, X., Oppert, J., Basdevant, A., Clément, K., Bardin, C., Scherrmann, J. M. G., Lepine, J. P., Bergmann, J., & Mouly, S. J. (2009) · Clinical Pharmacokinetics · doi:10.2165/11317150-000000000-00000 · Cited by 67
Ottem, E. N., Beck, L. A., Jordan, C. L., & Breedlove, S. M. (2007) · Endocrinology · doi:10.1210/en.2007-0308 · Cited by 65
Xu, M., Kim, C. J., Neubert, M. J., & Heinricher, M. M. (2006) · Pain · doi:10.1016/j.pain.2006.08.020 · Cited by 64
Ho, Y., Cheng, J., & Chiou, L. (2013) · Journal of Neuroscience · doi:10.1523/jneurosci.5583-12.2013 · Cited by 61
Bretzner, F., Liu, J., Currie, E., Roskams, A. J., & Tetzlaff, W. (2008) · European Journal of Neuroscience · doi:10.1111/j.1460-9568.2008.06462.x · Cited by 60
Neuroplasticity of Supraspinal Structures Associated with Pathological Pain
Boadas‐Vaello, P., Homs, J., Reina, F., Carrera, A., & Verdú, E. (2017) · The Anatomical Record · doi:10.1002/ar.23587 · Cited by 60
Zhang, Z., Wang, X., Wang, W., Lu, Y.-G., & Pan, Z. Z. (2013) · Molecular Pharmacology · doi:10.1124/mol.113.086496 · Cited by 59
LaGraize, S. C., Guo, W., Yang, K., Wei, F., Ren, K., & Dubner, R. A. (2010) · Neuroscience · doi:10.1016/j.neuroscience.2010.09.040 · Cited by 56
Self-citationSingh, L., Kaur, A., Bhatti, M. S., & Bhatti, R. (2019) · Neurochemical Research · doi:10.1007/s11064-019-02805-5 · Cited by 55
Peters, M., Bletsch, M., Catapano, R., Zhang, X., Tully, T., & Bourtchouladze, R. (2009) · Genes Brain & Behavior · doi:10.1111/j.1601-183x.2009.00474.x · Cited by 57
Impact of sex on pain and opioid analgesia: a review
Fullerton, E. F., Doyle, H. H., & Murphy, A. Z. (2018) · Current Opinion in Behavioral Sciences · doi:10.1016/j.cobeha.2018.08.001 · Cited by 55
Sun, T., Luo, J., Jia, M., Li, H., Li, K., & Fu, Z. (2012) · European Journal of Pharmacology · doi:10.1016/j.ejphar.2012.02.017 · Cited by 54
Cleary, D. R., & Heinricher, M. M. (2013) · Pain · doi:10.1016/j.pain.2013.02.019 · Cited by 53
Hu, J. R., Wang, Z., Guo, Y., Zhang, X.-N., Xu, Z., Liu, S., Guo, G.-J., Yang, Q., Zhang, F.-X., Sun, X., et al. (2009) · Molecular Pain · doi:10.1186/1744-8069-5-71 · Cited by 53
Papathanassoglou, E. D. E., Miltiadous, P., & Karanikola, M. N. K. (2014) · Biological Research For Nursing · doi:10.1177/1099800414555411 · Cited by 55
NK-1 Receptors Modulate the Excitability of on Cells in the Rostral Ventromedial Medulla
Budai, D., Khasabov, S. G., Mantyh, P. W., & Simone, D. A. (2006) · Journal of Neurophysiology · doi:10.1152/jn.00450.2006 · Cited by 51
Increasing Intensity of TENS Prevents Analgesic Tolerance in Rats
Sato, K., Sanada, L. S., Rakel, B. A., & Sluka, K. A. (2012) · Journal of Pain · doi:10.1016/j.jpain.2012.06.004 · Cited by 50
Brain-derived neurotrophic factor and its receptor in the human and the sand rat intervertebral disc
Gruber, H. E., Ingram, J. A., Hoelscher, G. L., Zinchenko, N., Norton, H. J., & Hanley, E. N. (2008) · Arthritis Research & Therapy · doi:10.1186/ar2456 · Cited by 49
Brain-derived neurotrophic factor and exercise in fibromyalgia syndrome patients: a mini review
Nugraha, B., Karst, M., Engeli, S., & Gutenbrunner, C. M. (2011) · Rheumatology International · doi:10.1007/s00296-011-2348-2 · Cited by 49
Mills, E. P., Keay, K. A., & Henderson, L. A. (2021) · Frontiers in Pain Research · doi:10.3389/fpain.2021.705345 · Cited by 47
Epigenetics: A Promising Paradigm for Better Understanding and Managing Pain
Seo, S., Grzenda, A. L., Lomberk, G. A., Ou, X., Cruciani, R. A., & Urrutia, R. A. (2013) · Journal of Pain · doi:10.1016/j.jpain.2013.01.772 · Cited by 48
Tarsa, L., Bałkowiec-Iskra, E., Kratochvil, F. J., Jenkins, V. K., McLean, A., Brown, A. L., Smith, J. A., Baumgartner, J. C., & Bałkowiec, A. (2010) · Neuroscience · doi:10.1016/j.neuroscience.2010.03.002 · Cited by 47
Reilly, S. C., Quinn, J. P., Cossins, A. R., & Sneddon, L. U. (2008) · Neuroscience Letters · doi:10.1016/j.neulet.2008.03.075 · Cited by 47
Lopes, B. C., Medeiros, L. F., de Souza, V. S., Cioato, S. G., Medeiros, H. R., Regner, G. G., de Oliveira, C. L., Fregni, F., Caumo, W., & Torres, I. L. D. S. (2020) · Brain stimulation · doi:10.1016/j.brs.2020.02.025 · Cited by 46
Xu, M., Fei, Y., He, Q., Fu, J., Zhu, J., Tao, J., Ni, C., Xu, C., Zhou, Q., Yao, M., et al. (2021) · ACS Chemical Neuroscience · doi:10.1021/acschemneuro.1c00224 · Cited by 43
Ren, K., & Dubner, R. A. (2008) · Elsevier eBooks · doi:10.1016/b978-012370880-9.00192-4 · Cited by 44
Self-citationExogenous melatonin in the treatment of pain: a systematic review and meta-analysis
Zhu, C.-J., Xu, Y., Duan, Y., Li, W., Zhang, L., Huang, Y., Zhao, W., Wang, Y., Li, J., Feng, T., et al. (2017) · Oncotarget · doi:10.18632/oncotarget.21504 · Cited by 43
Redivo, D. D. B., Schreiber, A. K., Adami, E. R., Ribeiro, D. E., Joca, S. R. L., Zanoveli, J. M., & da Cunha, J. M. (2015) · Behavioural Brain Research · doi:10.1016/j.bbr.2015.10.058 · Cited by 44
RNA interference in pain research
Röhl, T., & Kurreck, J. (2006) · Journal of Neurochemistry · doi:10.1111/j.1471-4159.2006.04082.x · Cited by 39
Stimulated neuronal expression of brain-derived neurotrophic factor by Neurotropin
Fukuda, Y., Berry, T. L., Nelson, M., Hunter, C. L., Fukuhara, K., Imai, H., Ito, S., Granholm-Bentley, A.-C., Kaplan, A. P., & Mutoh, T. (2010) · Molecular and Cellular Neuroscience · doi:10.1016/j.mcn.2010.06.013 · Cited by 39
Differential modulation of neurons in the rostral ventromedial medulla by neurokinin-1 receptors
Brink, T. S., Pacharinsak, C., Khasabov, S. G., Beitz, A. J., & Simone, D. A. (2011) · Journal of Neurophysiology · doi:10.1152/jn.00678.2011 · Cited by 39
BDNF in Neuropathic Pain; the Culprit that Cannot be Apprehended
Smith, P. A. (2024) · Neuroscience · doi:10.1016/j.neuroscience.2024.02.020 · Cited by 40
Zhang, L., Wang, G., Ma, J., Liu, C., Liu, X., Zhan, Y., & Zhang, M. (2016) · Brain Research Bulletin · doi:10.1016/j.brainresbull.2016.08.016 · Cited by 37
Constandil, L., Goich, M., Hernández, A., Bourgeais, L., Cazorla, M., Hamon, M., Villanueva, L., & Pélissier, T. (2012) · Journal of Pain · doi:10.1016/j.jpain.2012.03.008 · Cited by 38
Tao, W., Chen, Q., Zhou, W., Wang, Y., Wang, L., & Zhang, Z. (2014) · Journal of Biological Chemistry · doi:10.1074/jbc.m114.580381 · Cited by 37
Yin, J.-B., Wu, H., Dong, Y., Zhang, T., Wang, J., Zhang, Y., Wei, Y., Lu, Y.-C., Wu, S., Wang, W., et al. (2014) · Frontiers in Neural Circuits · doi:10.3389/fncir.2014.00137 · Cited by 38
Morphine-responsive neurons that regulate mechanical antinociception
Fatt, M. P., Zhang, M.-D., Kupari, J., Altınkök, M., Yang, Y., Hu, Y., Svenningsson, P., & Ernfors, P. (2024) · Science · doi:10.1126/science.ado6593 · Cited by 35
Microinjection of angiotensin II in the caudal ventrolateral medulla induces hyperalgesia
Marques-Lopes, J., Pinto, M. T., Pinho, D., Morato, M., Patinha, D., Albino‐Teixeira, A., & Tavares, I. (2008) · Neuroscience · doi:10.1016/j.neuroscience.2008.11.044 · Cited by 35
Takeda, M., Takahashi, M., Kitagawa, J., Kanazawa, T., Nasu, M., & Matsumoto, S. (2013) · Molecular Pain · doi:10.1186/1744-8069-9-49 · Cited by 35
BDNF Signaling and Pain Modulation
Mazzitelli, M., Kiritoshi, T., Presto, P., Hurtado, Z., Antenucci, N., Ji, G., & Neugebauer, V. (2025) · Cells · doi:10.3390/cells14070476 · Cited by 36
The role of HCN channels within the periaqueductal gray in neuropathic pain
Du, L., Wang, S., Cui, J. G., He, W., & Ruan, H. (2013) · Brain Research · doi:10.1016/j.brainres.2013.01.035 · Cited by 34
Pacharinsak, C., Khasabov, S. G., Beitz, A. J., & Simone, D. A. (2008) · Pain · doi:10.1016/j.pain.2008.02.032 · Cited by 34
Guo, W., Chu, Y.-X., Imai, S., Yang, J.-L., Zou, S., Mohammad, Z., Wei, F., Dubner, R. A., & Ren, K. (2016) · Molecular Pain · doi:10.1177/1744806916658043 · Cited by 33
Self-citationBaranowski, B. J., Mohammad, A., Finch, M. S., Brown, A. D. H., Dhaliwal, R., Marko, D. M., LeBlanc, P. J., McCormick, C. M., Fajardo, V. A., & MacPherson, R. E. K. (2023) · Journal of Applied Physiology · doi:10.1152/japplphysiol.00114.2023 · Cited by 36
In Vivo Evidence that Truncated Trkb.T1 Participates in Nociception
Renn, C. L., Leitch, C. C., & Dorsey, S. G. (2009) · Molecular Pain · doi:10.1186/1744-8069-5-61 · Cited by 33
Chou, D. (2020) · Neuropharmacology · doi:10.1016/j.neuropharm.2020.108068 · Cited by 29
Chung, E. K. Y., Bian, Z., Xu, H., & Sung, J. J. �. (2009) · Neurosignals · doi:10.1159/000224631 · Cited by 32
Guedes, A. G. P. (2017) · Veterinary Clinics of North America Equine Practice · doi:10.1016/j.cveq.2016.11.006 · Cited by 32
Gu, M., Miyoshi, K., Dubner, R. A., Guo, W., Zou, S., Ren, K., Noguchi, K., & Wei, F. (2011) · Journal of Neuroscience · doi:10.1523/jneurosci.1564-11.2011 · Cited by 30
Self-citationRetractedAira, Z., Buesa, I., del Caño, G. G., Salgueiro, M., Mendiable, N., Mingo, J., Aguilera, L., Bilbao, J., & Azkue, J. J. (2012) · Pain · doi:10.1016/j.pain.2012.03.017 · Cited by 30
The BDNF/TrkB Signaling Pathway Is Involved in Heat Hyperalgesia Mediated by Cdk5 in Rats
Zhang, H., Zhang, X., Xue, Q., YanLuo, Huang, J., Zhang, S., Shao, H., Han, L., Wang, W., & Yu, B. (2014) · PLoS ONE · doi:10.1371/journal.pone.0085536 · Cited by 29
Zhang, L. N., & Hammond, D. L. (2010) · Pain · doi:10.1016/j.pain.2010.01.017 · Cited by 27
Khasabov, S. G., Malecha, P. W., Noack, J., Tabakov, J., Giesler, G. J., & Simone, D. A. (2017) · Journal of Neurophysiology · doi:10.1152/jn.00478.2017 · Cited by 27
Xue, J., Li, H., Xu, Z., Ma, D., Guo, R., Yang, K., & Wang, Y. (2018) · Neurochemical Research · doi:10.1007/s11064-018-2660-2 · Cited by 27
Khasabov, S. G., Brink, T. S., Schupp, M., Noack, J., & Simone, D. A. (2012) · Neuroscience · doi:10.1016/j.neuroscience.2012.08.029 · Cited by 26
Medullary control of nociceptive transmission: Reciprocal dual communication with the spinal cord
Almeida, A., Leite‐Almeida, H., & Tavares, I. (2006) · Drug Discovery Today Disease Mechanisms · doi:10.1016/j.ddmec.2006.09.001 · Cited by 26
BDNF-TrkB Signaling Pathway in Spinal Cord Injury: Insights and Implications
Shamsnia, H. S., Peyrovinasab, A., Amirlou, D., Sirouskabiri, S., Rostamian, F., Basiri, N., Shalmani, L. M., Hashemi, M., Hushmandi, K., & Abdolghaffari, A. H. (2024) · Molecular Neurobiology · doi:10.1007/s12035-024-04381-4 · Cited by 29
Metadata
- Authors
- Guo, W., Robbins, M. T., Wei, F., Zou, S., Dubner, R., & Ren, K.
- Affiliations
- University of Maryland, Baltimore (US)
- Corresponding author
- Ren, Ke
- Venue
- The Journal of Neuroscience
- Publisher
- Society for Neuroscience
- Published
- 2006-01-04
- Volume
- 26
- Issue
- 1
- Pages
- 126-137
- ISSN
- 0270-6474 (ISSN-L)
- 1529-2401
- PMC
- PMC6674294
- OpenAlex
- W2131110619
- Cited by
- 192
- References
- 52
- Citations by year
- 2026: 5 · 2025: 4 · 2024: 9 · 2023: 6 · 2022: 6 · 2021: 5 · 2020: 7 · 2019: 11 · 2018: 5 · 2017: 7 · 2016: 11 · 2015: 7 · 2014: 17 · 2013: 20 · 2012: 11
- FWCI
- 9.08
- Type
- journal article
- Language
- en
- Open access
- hybrid
- doi.org
- Licence
- Locations
- Journal of Neuroscience (publishedVersion, cc-by-nc-sa)
- PubMed Central (publishedVersion)
- PubMed (publishedVersion)
- Funders
- National Institutes of Health
- National Institute on Drug Abuse (DA10275, R01DA010275)
- National Institute of Dental and Craniofacial Research (DE 11964, R01DE011964)
- Topics
- Health Sciences › Medicine › Physiology (medical) › Pain Mechanisms and Treatments
- Health Sciences › Medicine › Anesthesiology and Pain Medicine › Pain Management and Treatment
- Life Sciences › Neuroscience › Cellular and Molecular Neuroscience › Nerve injury and regeneration
- Keywords
- brain-derived neurotrophic factor, TrkB receptor, descending facilitation, periaqueductal gray, rostral ventromedial medulla, inflammatory pain, NMDA receptor, NR2A subunit, chronic pain, central sensitization, IP3 signaling, protein kinase C, Src kinase, nociception, central pain
- MeSH terms
- Animals, Male, Medulla Oblongata, Pain, Pain Measurement, Pyramidal Tracts, Signal Transduction, Rats, Sprague-Dawley, Brain-Derived Neurotrophic Factor, Receptor, trkB, Rats
About these checks
Registry, retraction, Cites and statistics results are computed, not judged, with one exception: a printed reference that no index lists is read once by a model before it counts as a citation error. Claims are extracted by a model and kept only when their quote appears verbatim in the text; each cited source is then checked, with a model’s help, for whether it says what the claim relies on. Those verdicts can be wrong — read the claim’s quote and the cited source before relying on one.
Statistics and arithmetic are recomputed, not judged.
Confidence bands are shown only for fields calibrated on our annotated test set. None is calibrated yet, so no band is shown.
What counts as a claim ›How we measure confidence ›How we check this ›
Are you an author, or do you see a problem with this page? Request a review
