

The DOI matches its Crossref record; 48 of the 48 references it cites were found in a registry or an index.
Melanin-Concentrating Hormone Neurons Release Glutamate for Feedforward Inhibition of the Lateral Septum
Open accessAbstract
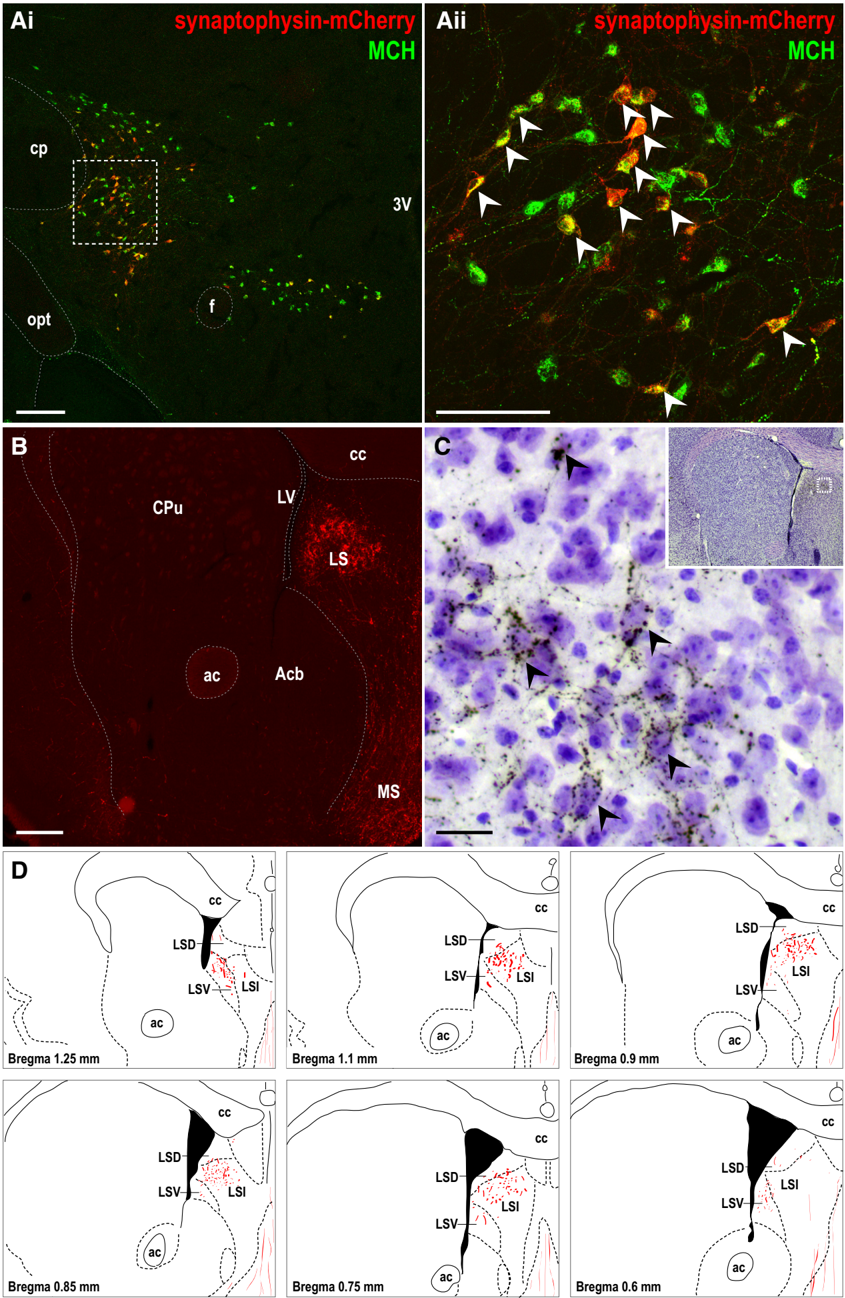
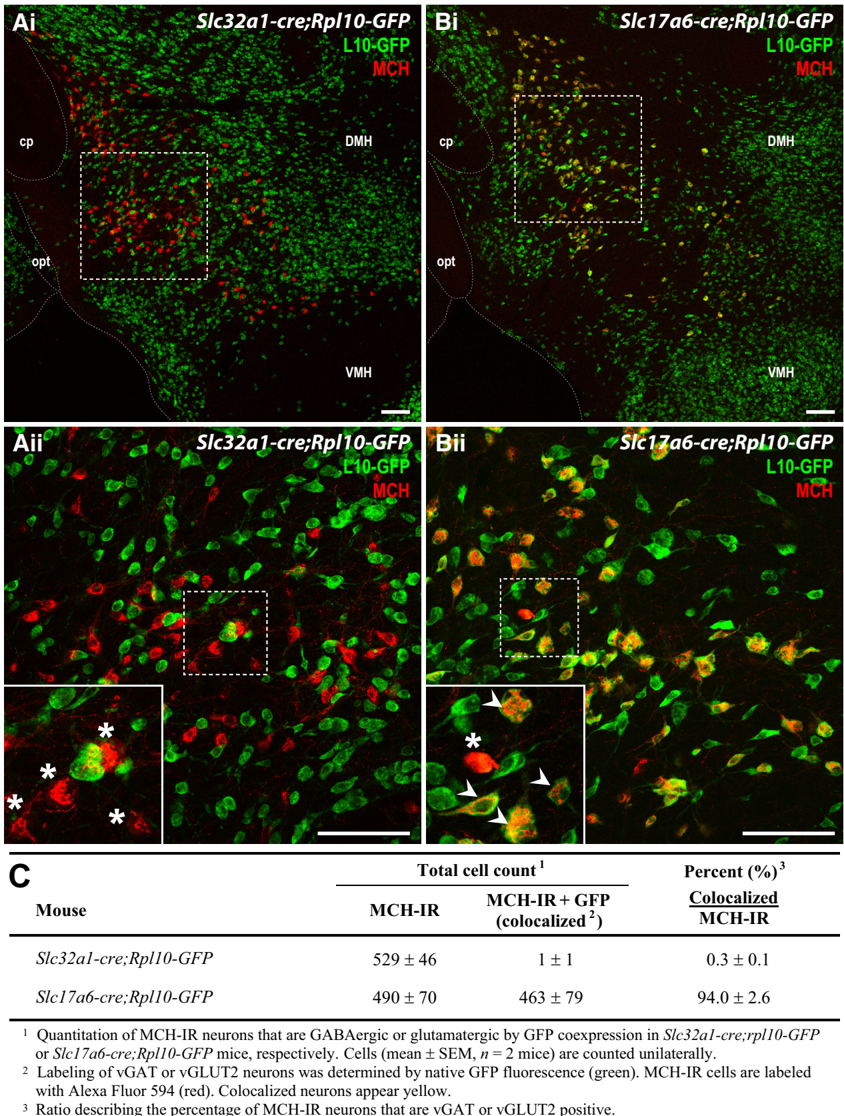
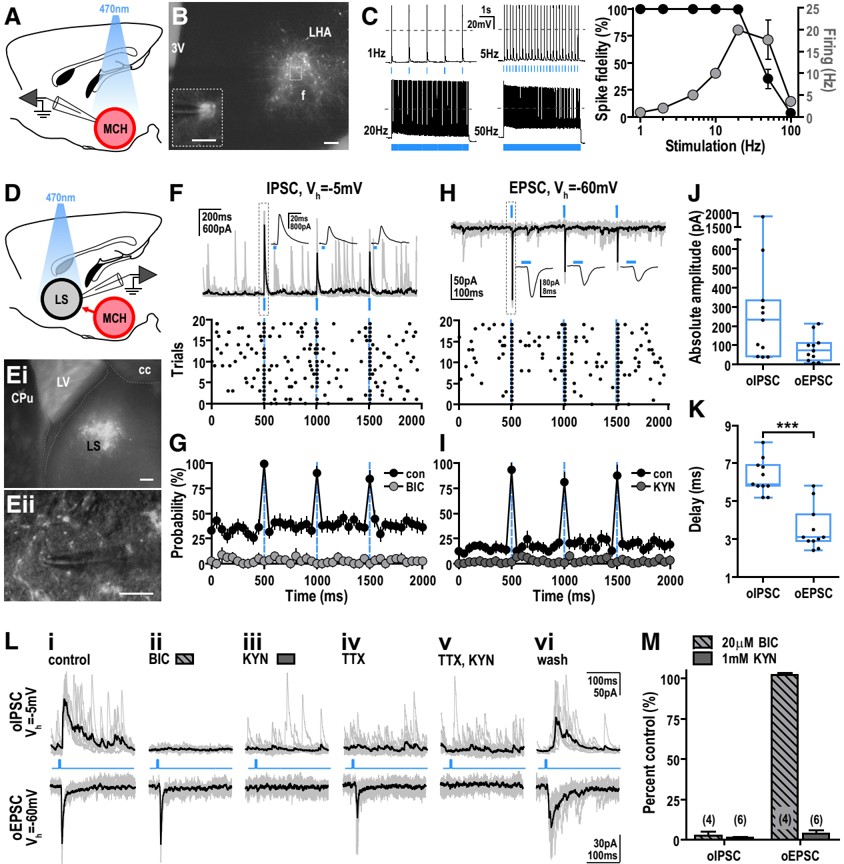
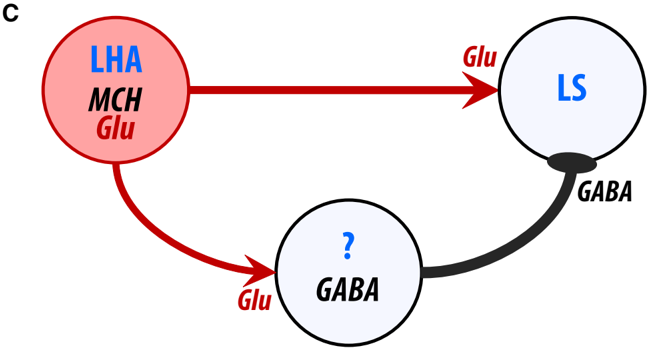
Melanin-concentrating hormone (MCH) regulates vital physiological functions, including energy balance and sleep. MCH cells are thought to be GABAergic, releasing GABA to inhibit downstream targets. However, there is little experimental support for this paradigm. To better understand the synaptic mechanisms of mouse MCH neurons, we performed neuroanatomical mapping and characterization followed by optogenetics to test their functional connectivity at downstream targets. Synaptophysin-mediated projection mapping showed that the lateral septal nucleus (LS) contained the densest accumulation of MCH nerve terminals. We then expressed channelrhodopsin-2 in MCH neurons and photostimulated MCH projections to determine their effect on LS activity. Photostimulation of MCH projections evoked a monosynaptic glutamate release in the LS. Interestingly, this led to a feedforward inhibition that depressed LS firing by a robust secondary GABA release. This study presents a circuit analysis between MCH and LS neurons and confirms their functional connection via monosynaptic and polysynaptic pathways. Our findings indicate that MCH neurons are not exclusively GABAergic and reveal a glutamate-mediated, feedforward mechanism that inhibits LS cells.
Overview
The claims and statistics of this paper haven’t been checked yet.
Run the check — free, no account needed. It reads the open-access text and checks the sources it cites.
Integrity signals
Registry
Cites
Statistics
Figures
Verification
Claims the paper makes
The claims and statistics of this paper haven’t been checked yet.
Run the check — free, no account needed. It reads the open-access text and checks the sources it cites.
Claims other papers make about this one
Each is checked against this paper’s own text: does it say what the citing paper says it does?
The cited source says what the claim attributes to it.
In the citing paper
“Extracellular glutamate released in the LS likely derives from glutamatergic neurons projecting to the LS, including those located in the hippocampus (Zaczek et al., 1979;Gallagher et al., 1995) and in the hypothalamus (Chee et al., 2015).”
From Vasopressin regulates social play behavior in sex-specific ways through glutamate modulation in the lateral septum (2025) · cites this paper as Chee et al., 2015
Self-check
Percentages, sums and reported differences re-computed from the paper’s own numbers.
The self-check needs the paper’s full text.
Citations
Cites
The Mouse Brain in Stereotaxic Coordinates
Paxinos, G. (2001) · Cited by 12,859
A toolbox of Cre-dependent optogenetic transgenic mice for light-induced activation and silencing
Madisen, L., Mao, T., Koch, H., Zhuo, J.-M., Berenyi, A., Fujisawa, S., Hsu, Y.-W. A., Garcia, A. J., Gu, X., Zanella, S., et al. (2012) · Nature Neuroscience · doi:10.1038/nn.3078 · Cited by 1,398
Leptin Action on GABAergic Neurons Prevents Obesity and Reduces Inhibitory Tone to POMC Neurons
Vong, L., Ye, C., Yang, Z., Choi, B. J., Chua, S. C., & Lowell, B. B. (2011) · Neuron · doi:10.1016/j.neuron.2011.05.028 · Cited by 1,237
Mice lacking melanin-concentrating hormone are hypophagic and lean
Shimada, M., Tritos, N. A., Lowell, B. B., Flier, J. S., & Maratos–Flier, E. (1998) · Nature · doi:10.1038/25341 · Cited by 1,152
Self-citationBittencourt, J. C., Presse, F., Arias, C. M., Peto, C. A., Vaughan, J. M., Nahon, J., Vale, W., & Sawchenko, P. E. (1992) · The Journal of Comparative Neurology · doi:10.1002/cne.903190204 · Cited by 1,075
The subcellular organization of neocortical excitatory connections
Petreanu, L., Mao, T., Sternson, S. M., & Svoboda, K. (2009) · Nature · doi:10.1038/nature07709 · Cited by 1,047
Neuropeptide Transmission in Brain Circuits
van den Pol, A. N. (2012) · Neuron · doi:10.1016/j.neuron.2012.09.014 · Cited by 810
An excitatory paraventricular nucleus to AgRP neuron circuit that drives hunger
Krashes, M. J., Shah, B. P., Madara, J. C., Olson, D. P., Strochlic, D. E., Garfield, A. S., Vong, L., Pei, H., Watabe-Uchida, M., Uchida, N., et al. (2014) · Nature · doi:10.1038/nature12956 · Cited by 603
Dopaminergic neurons inhibit striatal output through non-canonical release of GABA
Tritsch, N. X., Ding, J. B., & Sabatini, B. L. (2012) · Nature · doi:10.1038/nature11466 · Cited by 576
Molecular characterization of the melanin-concentrating-hormone receptor
Saito, Y., Nothacker, H., Wang, Z., Lin, S. H. S., Leslie, F. M., & Civelli, O. (1999) · Nature · doi:10.1038/22321 · Cited by 541
Cited by
Sorted by citations
Neural Circuitry of Wakefulness and Sleep
Scammell, T. E., Arrigoni, E., & Lipton, J. O. (2017) · Neuron · doi:10.1016/j.neuron.2017.01.014 · Cited by 966
Self-citationWake–sleep circuitry: an overview
Saper, C. B., & Fuller, P. M. (2017) · Current Opinion in Neurobiology · doi:10.1016/j.conb.2017.03.021 · Cited by 383
Peever, J., & Fuller, P. M. (2017) · Current Biology · doi:10.1016/j.cub.2017.10.026 · Cited by 360
Functional consequences of neuropeptide and small-molecule co-transmission
Nusbaum, M. P., Blitz, D. M., & Marder, E. E. (2017) · Nature reviews. Neuroscience · doi:10.1038/nrn.2017.56 · Cited by 289
Hubs and spokes of the lateral hypothalamus: cell types, circuits and behaviour
Bonnavion, P., Mickelsen, L. E., Fujita, A., de Lecea, L., & Jackson, A. C. (2016) · The Journal of Physiology · doi:10.1113/jp271946 · Cited by 271
Metadata
- Authors
- Chee, M. J. S., Arrigoni, E., & Maratos-Flier, E.
- Affiliations
- Beth Israel Deaconess Medical Center (US)
- Venue
- The Journal of Neuroscience
- Publisher
- Society for Neuroscience
- Published
- 2015-02-25
- Volume
- 35
- Issue
- 8
- Pages
- 3644-3651
- ISSN
- 0270-6474 (ISSN-L)
- 1529-2401
- PMC
- PMC6605558
- OpenAlex
- W1970610262
- Cited by
- 112
- References
- 48
- Citations by year
- 2026: 11 · 2025: 7 · 2024: 11 · 2023: 11 · 2022: 8 · 2021: 11 · 2020: 11 · 2019: 5 · 2018: 13 · 2017: 10 · 2016: 11 · 2015: 3
- FWCI
- 6.84
- Type
- journal article
- Language
- en
- Open access
- hybrid
- doi.org
- Licence
- Locations
- Journal of Neuroscience (publishedVersion, cc-by-nc-sa)
- PubMed Central (publishedVersion)
- PubMed (publishedVersion)
- Topics
- Life Sciences › Neuroscience › Endocrine and Autonomic Systems › Regulation of Appetite and Obesity
- Life Sciences › Neuroscience › Cellular and Molecular Neuroscience › Neuroscience and Neuropharmacology Research
- Life Sciences › Neuroscience › Cognitive Neuroscience › Sleep and Wakefulness Research
- Keywords
- melanin-concentrating hormone, lateral septal nucleus, glutamate release, feedforward inhibition, GABAergic neurons, MCH neurons, synaptic connectivity, monosynaptic pathway, polysynaptic pathways, optogenetic stimulation, channelrhodopsin-2, neural circuits
- MeSH terms
- Animals, Hypothalamic Hormones, Melanins, Pituitary Hormones, Septal Nuclei, Presynaptic Terminals, Glutamic Acid, Excitatory Postsynaptic Potentials, Feedback, Physiological, Mice, Inhibitory Postsynaptic Potentials, GABAergic Neurons, Optogenetics
About these checks
Registry, retraction, Cites and statistics results are computed, not judged, with one exception: a printed reference that no index lists is read once by a model before it counts as a citation error. Claims are extracted by a model and kept only when their quote appears verbatim in the text; each cited source is then checked, with a model’s help, for whether it says what the claim relies on. Those verdicts can be wrong — read the claim’s quote and the cited source before relying on one.
Statistics and arithmetic are recomputed, not judged.
Confidence bands are shown only for fields calibrated on our annotated test set. None is calibrated yet, so no band is shown.
What counts as a claim ›How we measure confidence ›How we check this ›
Are you an author, or do you see a problem with this page? Request a review
