

The DOI matches its Crossref record; 46 of the 46 references it cites were found in a registry or an index.
Parvalbumin Is a Mobile Presynaptic Ca2+Buffer in the Calyx of Held that Accelerates the Decay of Ca2+and Short-Term Facilitation
Open accessAbstract
Presynaptic Ca 2+signaling plays a crucial role in short-term plasticity of synaptic transmission. Here, we studied the role of mobile endogenous presynaptic Ca 2+buffer(s) in modulating paired-pulse facilitation at a large excitatory nerve terminal in the auditory brainstem, the calyx of Held. To do so, we assessed the effect of presynaptic whole-cell recording, which should lead to the diffusional loss of endogenous mobile Ca 2+buffers, on paired-pulse facilitation and on intracellular Ca 2+concentration ([Ca 2+]i) transients evoked by action potentials. In unperturbed calyces briefly preloaded with the Ca 2+indicator fura-6F, the [Ca 2+]i transient decayed surprisingly fast (τ fast, ∼30 ms). Presynaptic whole-cell recordings made without additional Ca 2+buffers slowed the decay kinetics of [Ca 2+]i and paired-pulse facilitation (twofold to threefold), but the amplitude of the [Ca 2+]i transient was changed only marginally. The fast [Ca 2+]i decay was restored by adding the slow Ca 2+buffer EGTA (50–100 μ m) or parvalbumin (100 μ m), a Ca 2+-binding protein with slow Ca 2+-binding kinetics, to the presynaptic pipette solution. In contrast, the fast Ca 2+buffer fura-2 strongly reduced the amplitude of the [Ca 2+]i transient and slowed its decay, suggesting that the mobile endogenous buffer in calyces of Held has slow, rather than fast, binding kinetics. In parvalbumin knock-out mice, the decay of [Ca 2+]i and facilitation was slowed approximately twofold compared with wild-type mice, similar to what is observed during whole-cell recordings in rat calyces of Held. Thus, in young calyces of Held, a mobile Ca 2+buffer with slow binding kinetics, primarily represented by parvalbumin, accelerates the decay of spatially averaged [Ca 2+]i and paired-pulse facilitation.
Overview
The claims and statistics of this paper haven’t been checked yet.
Run the check — free, no account needed. It reads the open-access text and checks the sources it cites.
Integrity signals
Registry
Cites
Statistics
Figures
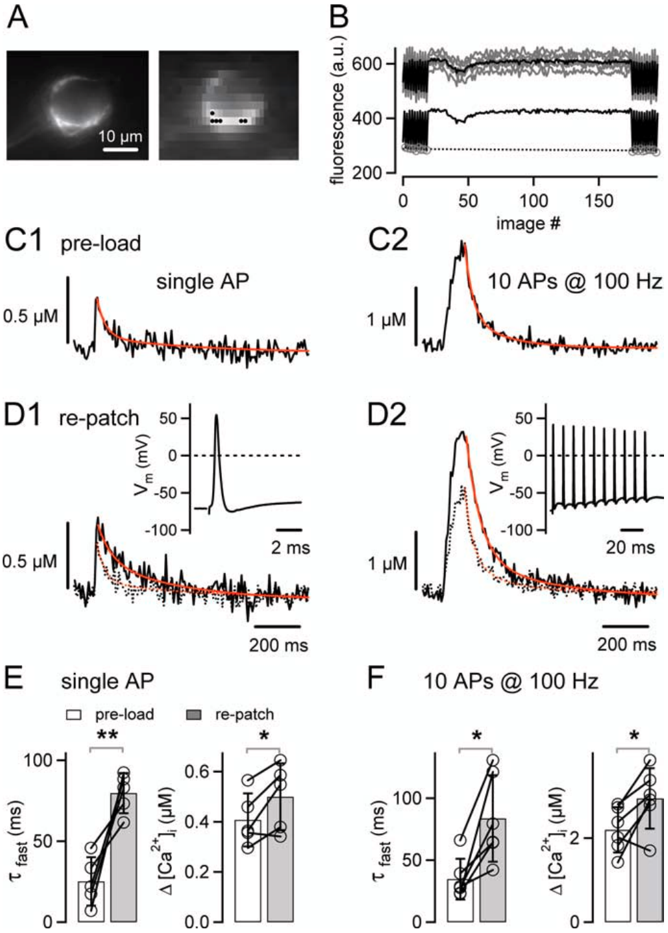
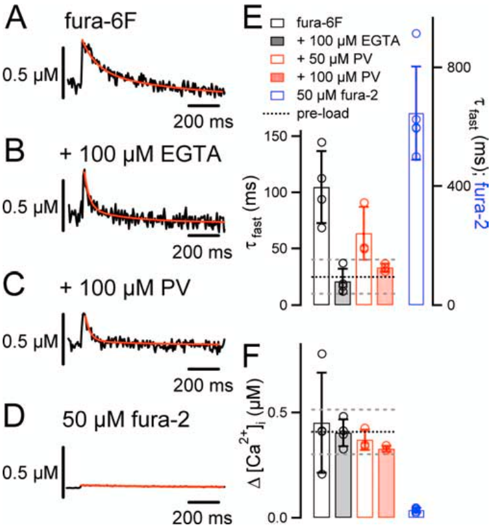
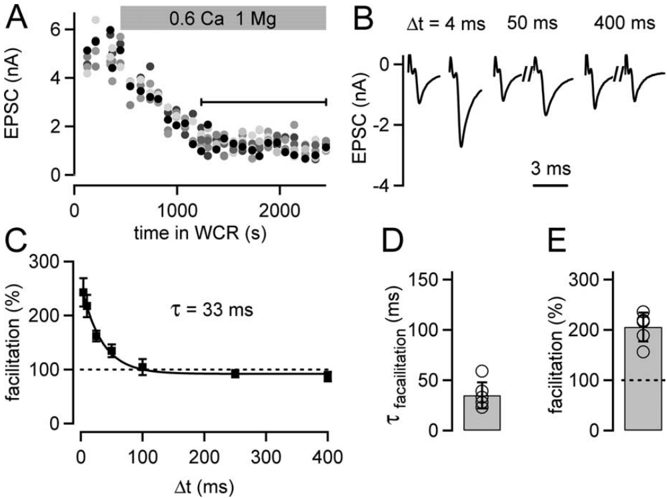
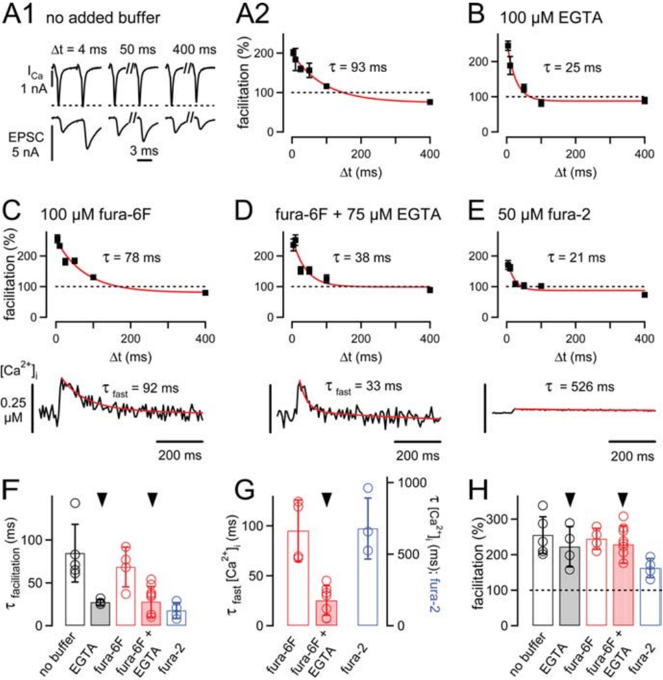
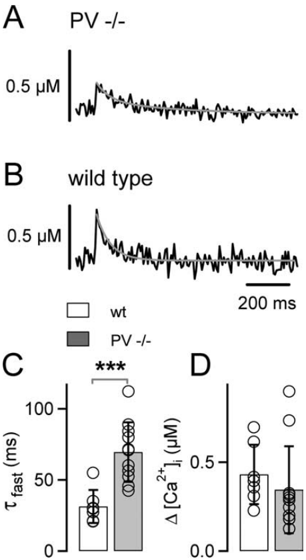
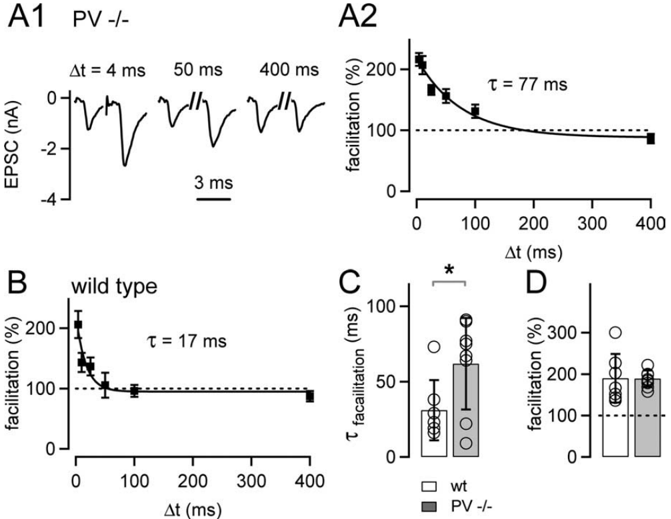
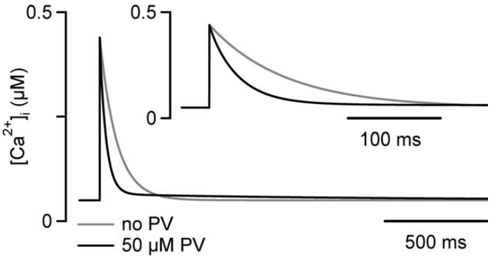
Verification
Claims the paper makes
The claims and statistics of this paper haven’t been checked yet.
Run the check — free, no account needed. It reads the open-access text and checks the sources it cites.
Claims other papers make about this one
Each is checked against this paper’s own text: does it say what the citing paper says it does?
In the citing paper
“The absence of PV in PV-/- Pvalb neurons does not affect basal synaptic transmission, but enhances facilitation [49, 50] and shortens delayed transmitter release [51].”
Self-check
Percentages, sums and reported differences re-computed from the paper’s own numbers.
The self-check needs the paper’s full text.
Citations
Cites
A new generation of Ca2+ indicators with greatly improved fluorescence properties.
Grynkiewicz, G., Poenie, M., & Tsien, R. Y. (1985) · Journal of Biological Chemistry · doi:10.1016/s0021-9258(19)83641-4 · Cited by 21,562
Polazzi, E., Mengoni, I., Caprini, M., Peña‐Altamira, E., Kurtys, E., & Monti, B. (2012) · Neurosignals · doi:10.1159/000337115 · Cited by 9,023
Short-Term Synaptic Plasticity
Zucker, R. S., & Regehr, W. G. (2002) · Annual Review of Physiology · doi:10.1146/annurev.physiol.64.092501.114547 · Cited by 5,068
Calbindin D-28k and parvalbumin in the rat nervous system
Celio, M. R. (1990) · Neuroscience · doi:10.1016/0306-4522(90)90091-h · Cited by 2,076
Kv3 channels: voltage-gated K+ channels designed for high-frequency repetitive firing
Rudy, B., & McBain, C. J. (2001) · Trends in Neurosciences · doi:10.1016/s0166-2236(00)01892-0 · Cited by 781
Calcium gradients and buffers in bovine chromaffin cells.
Neher, E., & Augustine, G. J. (1992) · The Journal of Physiology · doi:10.1113/jphysiol.1992.sp019127 · Cited by 753
Calcium influx and transmitter release in a fast CNS synapse
Borst, J. G. G., & Sakmann, B. J. (1996) · Nature · doi:10.1038/383431a0 · Cited by 632
Schneggenburger, R., Meyer, A. C., & Neher, E. (1999) · Neuron · doi:10.1016/s0896-6273(00)80789-8 · Cited by 625
Self-citationDeterminants of the Time Course of Facilitation at the Granule Cell to Purkinje Cell Synapse
Atluri, P. P., & Regehr, W. G. (1996) · Journal of Neuroscience · doi:10.1523/jneurosci.16-18-05661.1996 · Cited by 513
Pre‐ and postsynaptic whole‐cell recordings in the medial nucleus of the trapezoid body of the rat.
Borst, J. G. G., Helmchen, F., & Sakmann, B. J. (1995) · The Journal of Physiology · doi:10.1113/jphysiol.1995.sp021095 · Cited by 427
Cited by
Sorted by citations
Items 101–155 of 155
Visual thalamocortical circuits in parvalbumin-deficient mice
Lintas, A., Schwaller, B., & Villa, A. E. P. (2013) · Brain Research · doi:10.1016/j.brainres.2013.04.048 · Cited by 12
Self-citationHigh-temperature optoelectronic synaptic devices based on 4H-SiC
Bu, M., Wang, Y., Ni, Z., Li, D., Yang, D., & Pi, X. (2025) · Science China Information Sciences · doi:10.1007/s11432-024-4046-x · Cited by 11
Lin, K., Ranjan, M., Lipstein, N., Brose, N., Neher, E., & Taschenberger, H. (2025) · The Journal of Physiology · doi:10.1113/jp286282 · Cited by 11
Wang, W., Deng, D., Jenkins, K., Zinsmaier, A. K., Zhou, Q., & Bao, S. (2021) · Neuroscience · doi:10.1016/j.neuroscience.2021.12.006 · Cited by 10
Paizs, M., Engelhardt, J. I., Katarova, Z., & Siklós, L. (2009) · The Journal of Comparative Neurology · doi:10.1002/cne.22312 · Cited by 11
Linking Social Cognition, Parvalbumin Interneurons, and Oxytocin in Alzheimer’s Disease: An Update
Černotová, D., Hrůzová, K., Levčík, D., Svoboda, J., & Stuchlı́k, A. (2023) · Journal of Alzheimer s Disease · doi:10.3233/jad-230333 · Cited by 12
Shaping Neuronal Network Activity by Presynaptic Mechanisms
Lavi, A., Perez, O., & Ashery, U. (2015) · PLoS Computational Biology · doi:10.1371/journal.pcbi.1004438 · Cited by 10
Ca2+/Calmodulin and Presynaptic Short-Term Plasticity
Mochida, S. (2011) · ISRN Neurology · doi:10.5402/2011/919043 · Cited by 10
Changes of parvalbumin expression in the spinal cord after peripheral inflammation
Zachařová, G., Sojka, D., & Paleček, J. (2009) · Physiological Research · doi:10.33549/physiolres.931513 · Cited by 10
Short-term hypoxia induces a selective death of GABAergic neurons
Turovskaya, M. V., Turovsky, E. A., Kononov, A. V., & Зинченко, В. П. (2014) · Biochemistry (Moscow) Supplement Series A Membrane and Cell Biology · doi:10.1134/s199074781305019x · Cited by 9
Prolactin Reduces Hippocampal Parvalbumin and GABAA Receptor Expression in Female Mice
Mellado, S., Moreno-Ruiz, B., Expósito, S., Fernández, M., & Martín, E. D. (2021) · Neuroendocrinology · doi:10.1159/000520279 · Cited by 9
Jia, Y., & Pérez, J. C. (2009) · Comparative Biochemistry and Physiology Part A Molecular & Integrative Physiology · doi:10.1016/j.cbpa.2009.03.003 · Cited by 8
Yin, H., Tien, T.-W., Li, L., Yang, Y.-H., & Lai, C. (2011) · NeuroToxicology · doi:10.1016/j.neuro.2011.10.001 · Cited by 8
Church, E., Hamid, E., & Alford, S. T. (2019) · eNeuro · doi:10.1523/eneuro.0343-19.2019 · Cited by 8
Lin, K., Taschenberger, H., & Neher, E. (2022) · SSRN Electronic Journal · doi:10.2139/ssrn.4075232 · Cited by 8
Joucla, S., Pippow, A., Kloppenburg, P., & Pouzat, C. (2009) · Journal of Neurophysiology · doi:10.1152/jn.00414.2009 · Cited by 7
Sojka, D., Zachařová, G., Spicarova, D., & Paleček, J. (2010) · Physiological Research · doi:10.33549/physiolres.932063 · Cited by 7
Borst, J. G., & Rusu, S. (2012) · Springer handbook of auditory research · doi:10.1007/978-1-4419-9517-9_5 · Cited by 14
Kandler, K., Lee, J., & Pecka, M. (2020) · Elsevier eBooks · doi:10.1016/b978-0-12-805408-6.00021-x · Cited by 6
In situ Ca2+ titration in the fluorometric study of intracellular Ca2+ binding
McMahon, S. M., & Jackson, M. B. (2014) · Cell Calcium · doi:10.1016/j.ceca.2014.10.010 · Cited by 6
Keine, C., & Englitz, B. (2025) · Frontiers in Cellular Neuroscience · doi:10.3389/fncel.2025.1568506 · Cited by 6
Identification of mouse soleus muscle proteins altered in response to changes in gravity loading
Ino, Y., Ohira, T., Kumagai, K., Nakai, Y., Akiyama, T. H., Moriyama, K., Takeda, Y., Saito, T., Ryo, A., Inaba, Y., et al. (2023) · Scientific Reports · doi:10.1038/s41598-023-42875-8 · Cited by 5
Anatomy of superior olivary complex and lateral lemniscus in Etruscan shrew
Zacher, A., & Felmy, F. (2024) · Scientific Reports · doi:10.1038/s41598-024-65451-0 · Cited by 5
Self-citationParvalbumin expression affects synaptic development and physiology at the Drosophila larval NMJ
He, T., Nitabach, M. N., & Lnenicka, G. A. (2018) · Journal of Neurogenetics · doi:10.1080/01677063.2018.1498496 · Cited by 5
Long-Term Potentiation: A Candidate Cellular Mechanism for Information Storage in the CNS ☆
Hawkins, K. E., Gavin, C. F., & Sweatt, J. D. (2017) · Elsevier eBooks · doi:10.1016/b978-0-12-809324-5.21103-6 · Cited by 7
Dynamic synapses in the hypothalamic-neurohypophyseal system
Iremonger, K. J., & Bains, J. S. (2008) · Progress in brain research · doi:10.1016/s0079-6123(08)00411-1 · Cited by 4
Yin, H., Cheng, P.-R., & Chen, C.-S. (2008) · NeuroToxicology · doi:10.1016/j.neuro.2008.11.003 · Cited by 4
Kumar, P., Goettemoeller, A. M., Espinosa‐García, C., Tobin, B. R., Tfaily, A., Nelson, R. S., Natu, A., Dammer, E. B., Santiago, J. V., Malepati, S., et al. (2023) · bioRxiv (Cold Spring Harbor Laboratory) · doi:10.1101/2023.05.17.541038 · Cited by 4
Long-Term Potentiation: A Candidate Cellular Mechanism for Information Storage in the CNS
Sweatt, J. D. (2008) · Elsevier eBooks · doi:10.1016/b978-012370509-9.00016-4 · Cited by 4
Short-term synaptic plasticity across topographic maps in the electrosensory system
Mileva, G., Kozak, I. J., & Lewis, J. E. (2016) · Neuroscience · doi:10.1016/j.neuroscience.2016.01.014 · Cited by 2
Non-calyceal inputs gate the timing of calyx of Held evoked MNTB output
Console‐Meyer, L., Jenzen, F., Kladisios, N., & Felmy, F. (2026) · Communications Biology · doi:10.1038/s42003-026-10321-w · Cited by 1
Self-citationHu, W. (2011) · eDiss (Georg-August-Universität Göttingen) · doi:10.53846/goediss-3164 · Cited by 1
Dendritic spike induction of postsynaptic cerebellar LTPPreprint
Canepari, M., & Vogt, K. E. (2008) · Nature Precedings · doi:10.1038/npre.2008.2020.1 · Cited by 1
Influence of Ca2+ Homeostasis on Neurosecretion
Tse, A., Lee, A. K., Yeung-Yam-Wah, V., & Tse, F. W. (2008) · Springer eBooks · doi:10.1007/978-3-540-29678-2_2437 · Cited by 1
Sachs-Hombach, K., Mikami, A., Cao, L., DeLeo, J. A., Yoshihara, Y., Wrona, D., Milner, T. E., Kaba, H., Brennan, T. J., Oliver, D. L., et al. (2008) · Springer eBooks · doi:10.1007/978-3-540-29678-2_9
Presynaptic Ca2+ Influx and Its Modulation at Auditory Calyceal Terminals
Taschenberger, H., Lin, K., & Chang, S. (2013) · Springer eBooks · doi:10.1007/978-94-007-6334-0_9
Paizs, M. (2010) · SZTE Repository of Dissertations (University of Szeged)
Release Probability of the Readily Releasable Vesicles during Short Term Plasticity
Habets, R. L. P. (2009) · EUR Research Repository (Erasmus University Rotterdam)
Kononov, A. V., Ivanov, S. V., & Зинченко, В. П. (2014) · Neuroscience and Behavioral Physiology · doi:10.1007/s11055-014-0014-3
Gil, A., 1. Dept. Matemática Aplicada y Ciencias de la Computación, U. D. C., González‐Vélez, V., Segura, J., Gutiérrez, L. M., 2. Area de Química Aplicada, U. A. M.-A., 3. Departamento de Matemáticas, E. Y. C., & 4. Instituto de Neurociencias, C. M. U. M. H.-C. (2014) · Mathematical Biosciences & Engineering · doi:10.3934/mbe.2014.11.1027
Control of Neurotransmitter Release Properties by Presynaptic Calcium
Thanawala, M. S. (2014) · Digital Access to Scholarship at Harvard (DASH) (Harvard University)
DevelopmentalChangesinShort-TermPlasticityattheRat CalyxofHeldSynapse
Crins, H., & Rotterdam, T. (2011)
González‐Burgos, G., Fish, K. N., & Lewis, D. A. (2011)
Sehring, I. M., Klotz, C., Beisson, J., & Plattner, H. (2009)
Review Article Ca 2+ /Calmodulin and Presynaptic Short-Term Plasticity
Mochida, S. (2011)
Calcium Triggered Synaptic Vesicle Exocytosis
Pang, Z. P. (2007)
Díaz‐Rojas, F. (2016) · Institutional Repositories DataBase (IRDB) · doi:10.14988/di.2017.0000016319
McDargh, Z. A., & O’Shaughnessy, B. (2021) · bioRxiv (Cold Spring Harbor Laboratory) · doi:10.1101/2021.06.22.449527
Simacek, C. A., Kirischuk, S., & Mittmann, T. (2025) · Pflügers Archiv - European Journal of Physiology · doi:10.1007/s00424-025-03101-8
Ballestero, J. A. (2011) · Repositorio Digital Institucional de la Universidad de Buenos Aires (Universidad de Buenos Aires)
Brigande, A. M., Krueger, J., Park, C., & Disney, A. A. (2026) · bioRxiv (Cold Spring Harbor Laboratory) · doi:10.64898/2026.01.26.701495
Lai, Y., Lü, L., Sun, R., Lai, J., Wang, Y., Chen, S., Li, S., Qinglian, L., & Zhou, L. (2026) · Journal of Neuroscience · doi:10.1523/jneurosci.1202-25.2026
Computational approach to the study of neurotransmitter release
Reva, M. (2018) · theses.fr (ABES) · doi:10.70675/9383ab67z1502z4a48z881ez346ced03f490
Chang, S., Gurma, M., Yang, Y., & Wang, L. (2026) · bioRxiv (Cold Spring Harbor Laboratory) · doi:10.64898/2026.04.24.720678
Metadata
- Authors
- Müller, M., Felmy, F., Schwaller, B., & Schneggenburger, R.
- Affiliations
- École Polytechnique Fédérale de Lausanne (CH)
- Ludwig-Maximilians-Universität München (DE)
- University of Fribourg (CH)
- Venue
- The Journal of Neuroscience
- Publisher
- Society for Neuroscience
- Published
- 2007-02-28
- Volume
- 27
- Issue
- 9
- Pages
- 2261-2271
- ISSN
- 0270-6474 (ISSN-L)
- 1529-2401
- PMC
- PMC6673482
- OpenAlex
- W1975952480
- Cited by
- 155
- References
- 46
- Citations by year
- 2026: 4 · 2025: 4 · 2024: 3 · 2023: 7 · 2022: 4 · 2021: 7 · 2020: 4 · 2019: 5 · 2018: 7 · 2017: 1 · 2016: 8 · 2015: 9 · 2014: 11 · 2013: 10 · 2012: 8
- FWCI
- 5.97
- Type
- journal article
- Language
- en
- Open access
- hybrid
- doi.org
- Licence
- Locations
- Journal of Neuroscience (publishedVersion, cc-by-nc-sa)
- Europe PMC (PubMed Central) (publishedVersion)
- PubMed Central (publishedVersion)
- PubMed (publishedVersion)
- Zurich Open Repository and Archive (University of Zurich) (submittedVersion)
- Zurich Open Repository and Archive (University of Zurich)
- Funders
- National Science Foundation
- Deutsche Forschungsgemeinschaft (TP B1)
- Schweizerischer Nationalfonds zur Förderung der Wissenschaftlichen Forschung (100400, 3100A0)
- Topics
- Life Sciences › Neuroscience › Cellular and Molecular Neuroscience › Neuroscience and Neuropharmacology Research
- Life Sciences › Biochemistry, Genetics and Molecular Biology › Molecular Biology › Ion channel regulation and function
- Life Sciences › Neuroscience › Sensory Systems › Ion Channels and Receptors
- Keywords
- parvalbumin, calyx of Held, paired-pulse facilitation, short-term plasticity, calcium transients, fura-2, EGTA, auditory brainstem, excitatory synapses
- MeSH terms
- Animals, Brain Stem, Calcium, Calcium-Binding Proteins, Mice, Inbred C57BL, Synaptic Transmission, Neuronal Plasticity, Parvalbumins, Rats, Wistar, Receptors, Presynaptic, Mice, Knockout, Patch-Clamp Techniques, Mice, Rats, In Vitro Techniques
About these checks
Registry, retraction, Cites and statistics results are computed, not judged, with one exception: a printed reference that no index lists is read once by a model before it counts as a citation error. Claims are extracted by a model and kept only when their quote appears verbatim in the text; each cited source is then checked, with a model’s help, for whether it says what the claim relies on. Those verdicts can be wrong — read the claim’s quote and the cited source before relying on one.
Statistics and arithmetic are recomputed, not judged.
Confidence bands are shown only for fields calibrated on our annotated test set. None is calibrated yet, so no band is shown.
What counts as a claim ›How we measure confidence ›How we check this ›
Are you an author, or do you see a problem with this page? Request a review
