

The DOI matches its Crossref record; 53 of the 55 references it cites were found in a registry or an index.
Microglial PD-1 stimulation by astrocytic PD-L1 suppresses neuroinflammation and Alzheimer’s disease pathology
Open accessAbstract
Chronic neuroinflammation is a pathogenic component of Alzheimer’s disease (AD) that may limit the ability of the brain to clear amyloid deposits and cellular debris. Tight control of the immune system is therefore key to sustain the ability of the brain to repair itself during homeostasis and disease. The immune‐cell checkpoint receptor/ligand pair PD‐1/PD‐L1, known for their inhibitory immune function, is expressed also in the brain. Here, we report upregulated expression of PD‐L1 and PD‐1 in astrocytes and microglia, respectively, surrounding amyloid plaques in AD patients and in the APP/PS1 AD mouse model. We observed juxtamembrane shedding of PD‐L1 from astrocytes, which may mediate ectodomain signaling to PD‐1‐expressing microglia. Deletion of microglial PD‐1 evoked an inflammatory response and compromised amyloid‐β peptide (Aβ) uptake. APP/PS1 mice deficient for PD‐1 exhibited increased deposition of Aβ, reduced microglial Aβ uptake, and decreased expression of the Aβ receptor CD36 on microglia. Therefore, ineffective immune regulation by the PD‐1/PD‐L1 axis contributes to Aβ plaque deposition during chronic neuroinflammation in AD. Neuroinflammation, a hallmark of Alzheimer’s disease (AD), is involved in beta‐amyloid peptide (Aβ) plaque deposition and clearance. Here, the PD‐1/PD‐L1 axis is found as an important pathway for regulating the immune system in the brain, sustaining microglial Aβ uptake and reducing chronic neuroinflammation. The immune‐checkpoint receptor/ligand pair PD‐1/PD‐L1 sustains phagocytic function of microglia to prevent Aβ plaque deposition in APP/PS mouse models and patient tissues.
Overview
The claims and statistics of this paper haven’t been checked yet.
Run the check — free, no account needed. It reads the open-access text and checks the sources it cites.
Integrity signals
Registry
Cites
Statistics
Figures
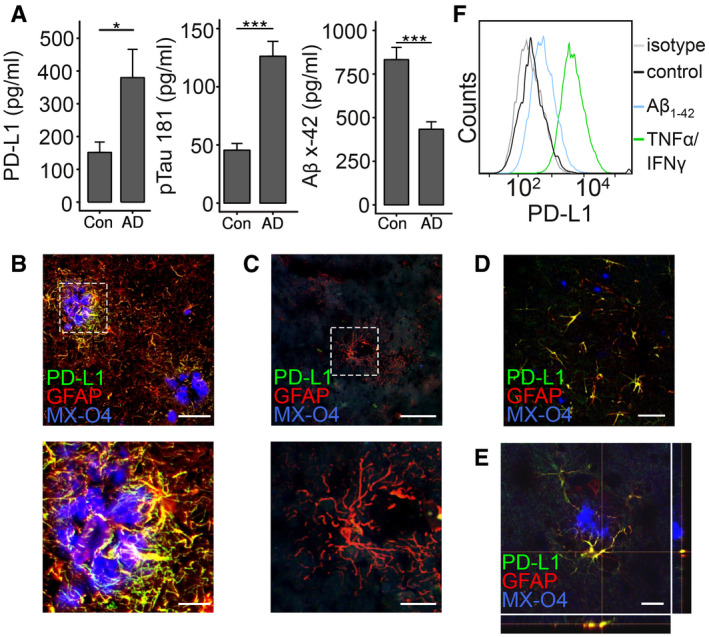
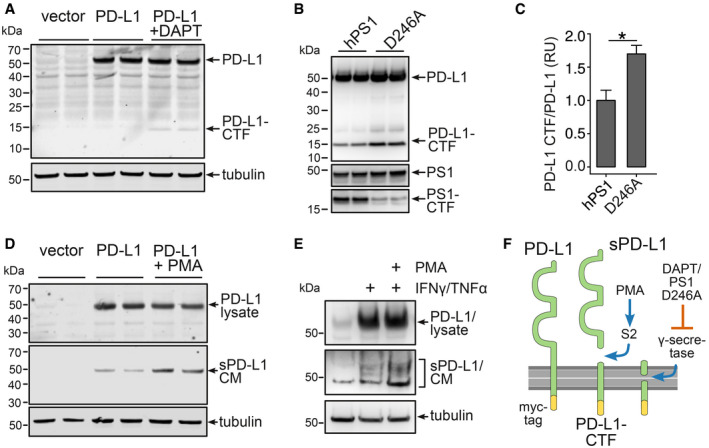
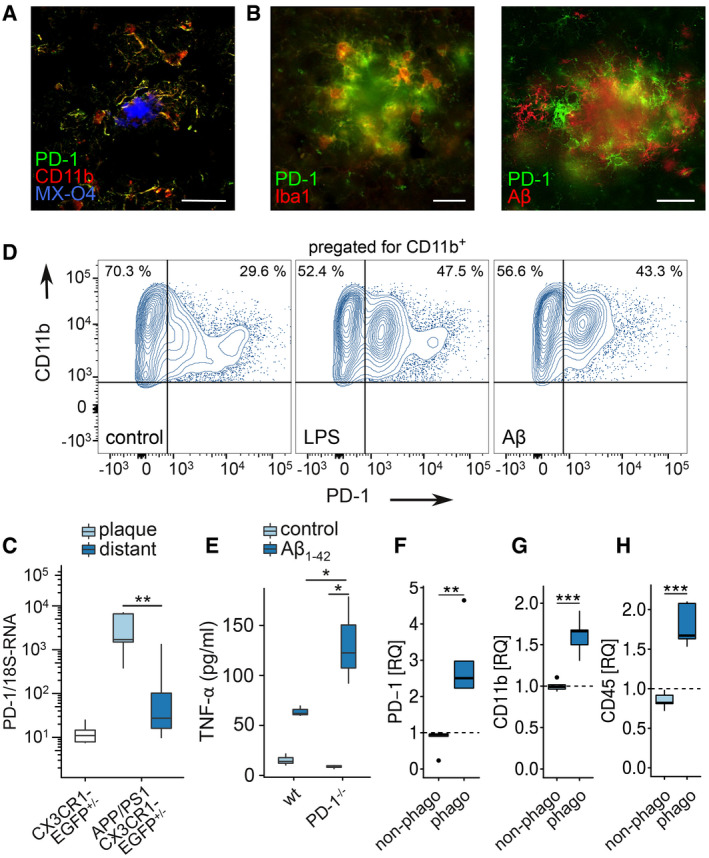
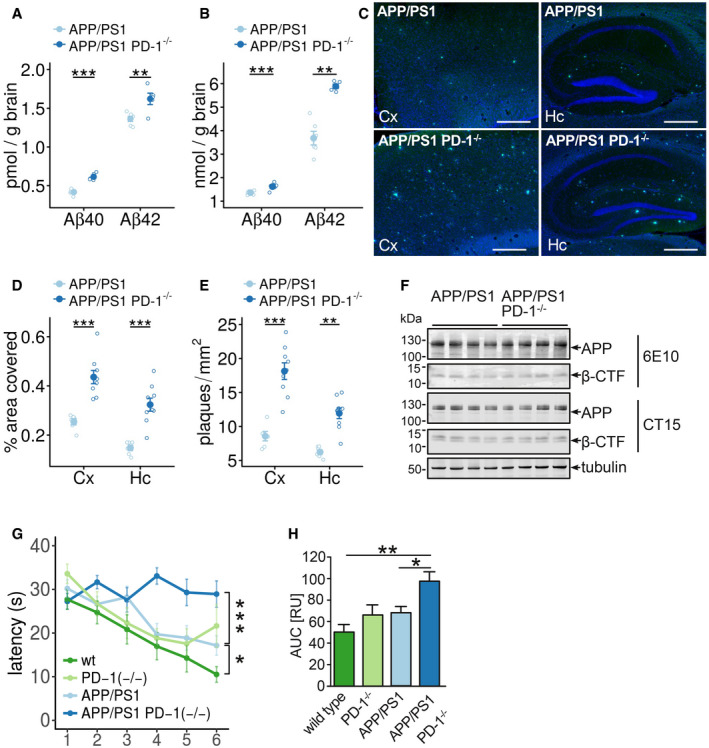
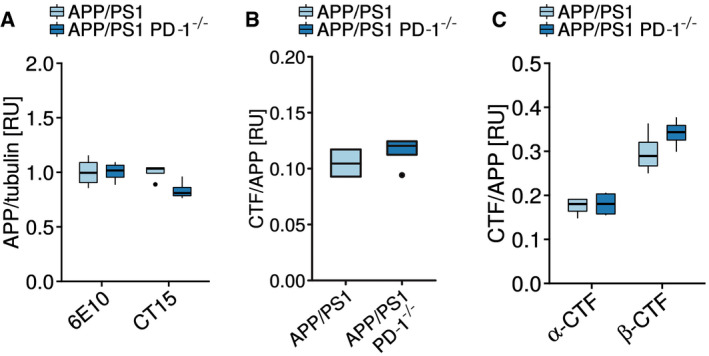
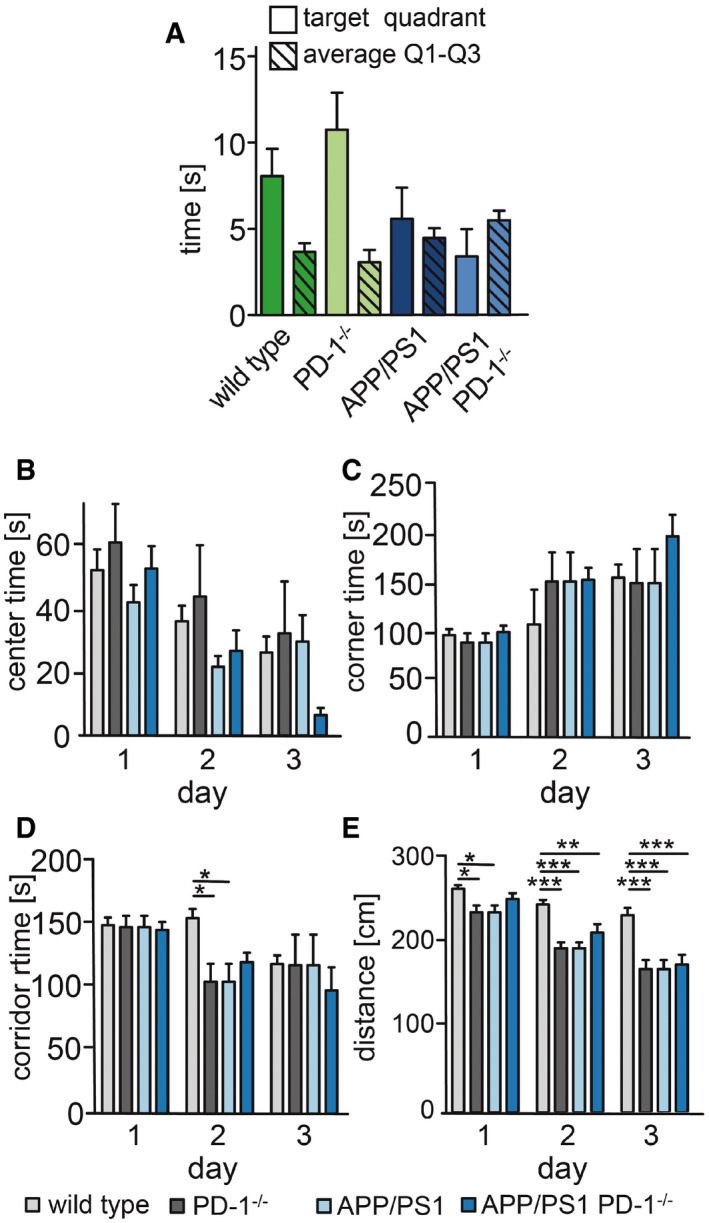
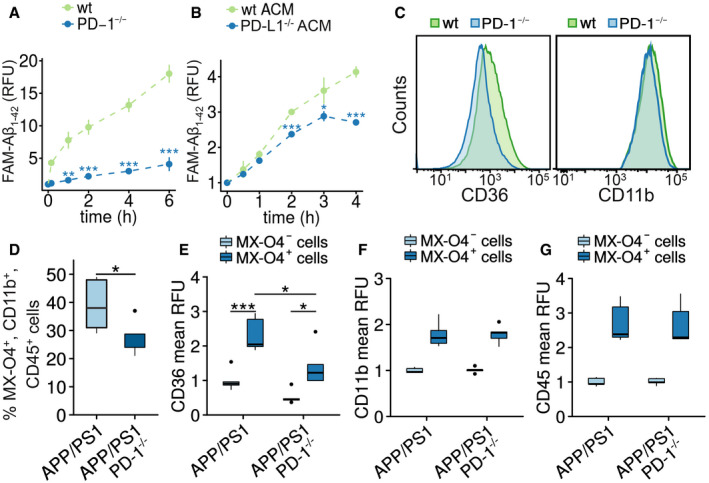
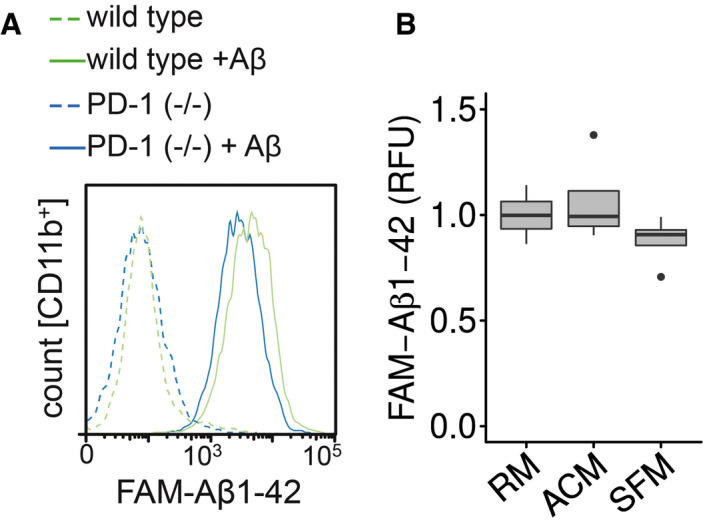
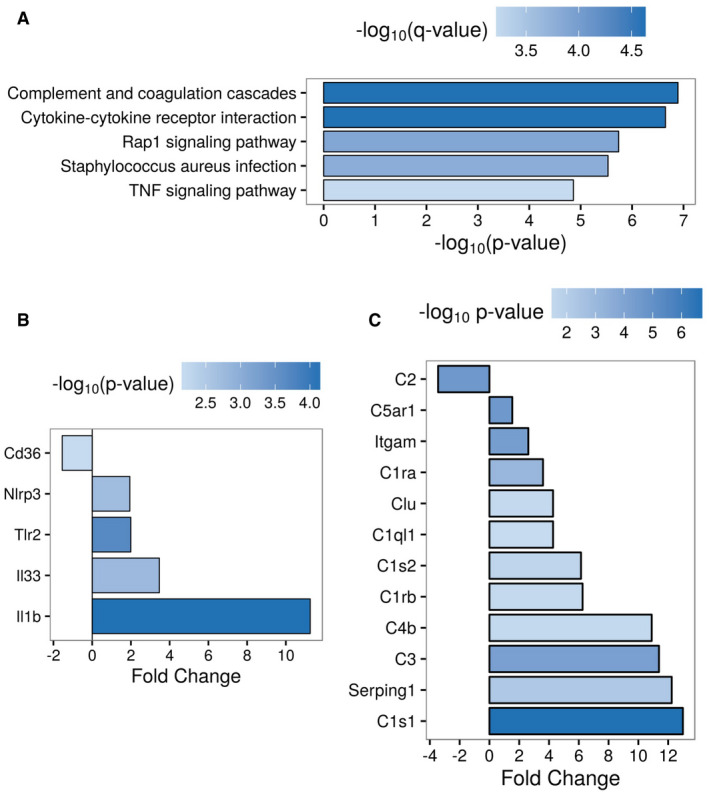
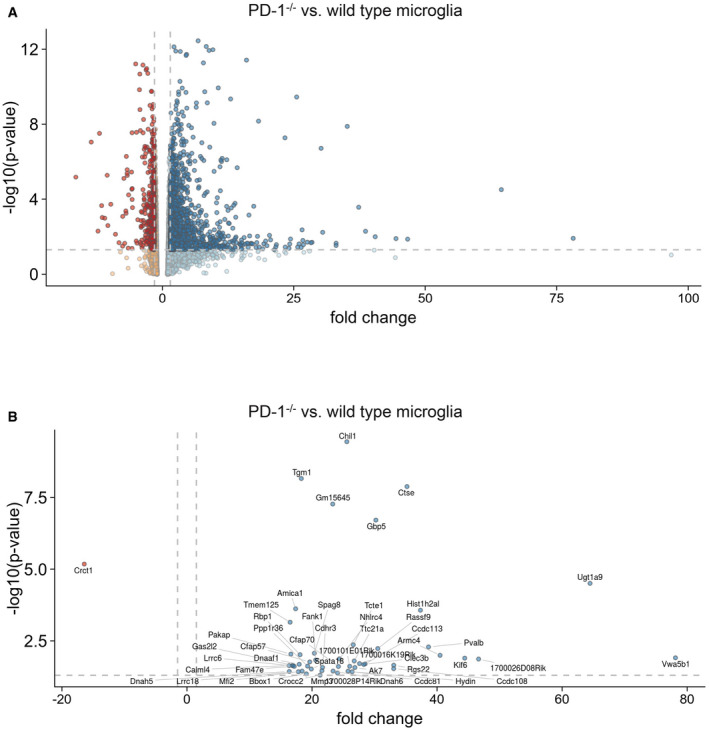
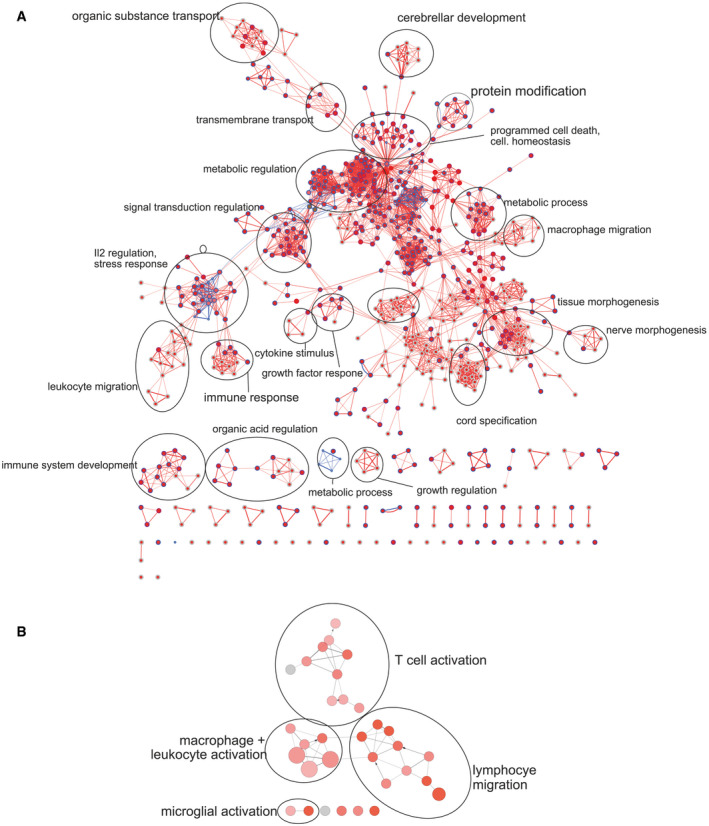
Verification
Claims the paper makes
The claims and statistics of this paper haven’t been checked yet.
Run the check — free, no account needed. It reads the open-access text and checks the sources it cites.
Claims other papers make about this one
Each is checked against this paper’s own text: does it say what the citing paper says it does?
The source backs part of the claim, not all of it — or backs it for a different population, condition or comparison.
In the citing paper
“A majority of AD risk genes identified through genome-wide association studies are highly expressed in microglia, the brain’s innate immune cells, suggesting a key role in microglial dysfunction (Kummer et al., 2021; Penney et al., 2020; Teipel et al., 2022).”
From A novel molecular class that recruits HDAC/MECP2 complexes to PU.1 motifs reduces neuroinflammation (2023) · cites this paper as Kummer et al., 2021
Experimental — accuracy not yet measured
Self-check
Percentages, sums and reported differences re-computed from the paper’s own numbers.
The self-check needs the paper’s full text.
Citations
Cites
clusterProfiler: an R Package for Comparing Biological Themes Among Gene Clusters
Yu, G., Wang, L.-G., Han, Y., & He, Q.-Y. (2012) · OMICS: A Journal of Integrative Biology · doi:10.1089/omi.2011.0118 · Cited by 36,259
PD-1 and PD-L1 Immune Checkpoint Blockade to Treat Breast Cancer
Hartkopf, A. D., Taran, F., Wallwiener, M., Walter, C. B., Krämer, B., Grischke, E., & Brucker, S. Y. (2016) · Breast Care · doi:10.1159/000453569 · Cited by 30,989
Differential expression analysis for sequence count data
Anders, S., & Huber, W. (2010) · Genome Biology · doi:10.1186/gb-2010-11-10-r106 · Cited by 15,581
Adverse Renal Effects of Immune Checkpoint Inhibitors: A Narrative Review
Wanchoo, R., Karam, S., Uppal, N. N., Barta, V. S., Deray, G., Devoe, C., Launay‐Vacher, V., Jhaveri, K. D., & on behalf of Cancer and Kidney International Network Workgroup on Immune Checkpoint Inhibitors (2017) · American Journal of Nephrology · doi:10.1159/000455014 · Cited by 15,320
Polazzi, E., Mengoni, I., Caprini, M., Peña‐Altamira, E., Kurtys, E., & Monti, B. (2012) · Neurosignals · doi:10.1159/000337115 · Cited by 9,023
Bindea, G., Mlecnik, B., Hackl, H., Charoentong, P., Tosolini, M., Kirilovsky, A., Fridman, W.-H., Pagès, F., Trajanoski, Z., & Galon, J. (2009) · Bioinformatics · doi:10.1093/bioinformatics/btp101 · Cited by 6,280
Neuroinflammation in Alzheimer's disease
Heneka, M. T., Carson, M. J., Khoury, J. E., Landreth, G. E., Brosseron, F., Feinstein, D. L., Jacobs, A. H., Wyss-Coray, T., Vitorica, J., Ransohoff, R. M., et al. (2015) · The Lancet Neurology · doi:10.1016/s1474-4422(15)70016-5 · Cited by 6,226
Self-citationMorris water maze: procedures for assessing spatial and related forms of learning and memory
Vorhees, C. V., & Williams, M. T. (2006) · Nature Protocols · doi:10.1038/nprot.2006.116 · Cited by 4,629
Maere, S., Heymans, K., & Kuiper, M. T. R. (2005) · Computer applications in the biosciences · doi:10.1093/bioinformatics/bti551 · Cited by 4,163
Wherry, E. J. (2011) · Nature Immunology · doi:10.1038/ni.2035 · Cited by 4,062 · cited 1×
“This anergy phenomenon has been observed in T cells and can be overcome by disrupting PD-L1/PD-1 interaction (Tsushima et al , 2007; Wherry, 2011).”
Cited by
Sorted by citations
Items 101–143 of 143
Zhang, H., Wáng, Y., Wen, S., & Li, J. (2025) · Scientific Reports · doi:10.1038/s41598-025-31618-6
van Olst, L., Kamermans, A., Halters, S., van der Pol, S. M. A., Rodríguez, E., Verberk, I. M. W., Verberk, S. G. S., Wessels, D. W. R., Rodriguez-Mogeda, C., Verhoeff, J., et al. (2024) · Figshare · doi:10.6084/m9.figshare.26711651
Schneider, Y., Gauer, C., Andert, M., Hoffmann, A., Riemenschneider, M. J., Krebs, W., Chalmers, N., Lötzsch, C., Naumann, U. J., Xiang, W., et al. (2024) · Figshare · doi:10.6084/m9.figshare.26658460
van Olst, L., Kamermans, A., Halters, S., van der Pol, S. M. A., Rodríguez, E., Verberk, I. M. W., Verberk, S. G. S., Wessels, D. W. R., Rodriguez-Mogeda, C., Verhoeff, J., et al. (2024) · Figshare · doi:10.6084/m9.figshare.26711621
Smith, B. C., Tinkey, R. A., Brock, O. D., Mariam, A., Habean, M. L., Dutta, R., & Williams, J. L. (2024) · Figshare · doi:10.6084/m9.figshare.26626225
van Olst, L., Kamermans, A., Halters, S., van der Pol, S. M. A., Rodríguez, E., Verberk, I. M. W., Verberk, S. G. S., Wessels, D. W. R., Rodriguez-Mogeda, C., Verhoeff, J., et al. (2024) · Figshare · doi:10.6084/m9.figshare.26711639
van Olst, L., Kamermans, A., Halters, S., van der Pol, S. M. A., Rodríguez, E., Verberk, I. M. W., Verberk, S. G. S., Wessels, D. W. R., Rodriguez-Mogeda, C., Verhoeff, J., et al. (2024) · Figshare · doi:10.6084/m9.figshare.26711654
van Olst, L., Kamermans, A., Halters, S., van der Pol, S. M. A., Rodríguez, E., Verberk, I. M. W., Verberk, S. G. S., Wessels, D. W. R., Rodriguez-Mogeda, C., Verhoeff, J., et al. (2024) · Figshare · doi:10.6084/m9.figshare.26711624
van Olst, L., Kamermans, A., Halters, S., van der Pol, S. M. A., Rodríguez, E., Verberk, I. M. W., Verberk, S. G. S., Wessels, D. W. R., Rodriguez-Mogeda, C., Verhoeff, J., et al. (2024) · Figshare · doi:10.6084/m9.figshare.26711672
van Olst, L., Kamermans, A., Halters, S., van der Pol, S. M. A., Rodríguez, E., Verberk, I. M. W., Verberk, S. G. S., Wessels, D. W. R., Rodriguez-Mogeda, C., Verhoeff, J., et al. (2024) · Figshare · doi:10.6084/m9.figshare.26711636
van Olst, L., Kamermans, A., Halters, S., van der Pol, S. M. A., Rodríguez, E., Verberk, I. M. W., Verberk, S. G. S., Wessels, D. W. R., Rodriguez-Mogeda, C., Verhoeff, J., et al. (2024) · Figshare · doi:10.6084/m9.figshare.26711642
Schneider, Y., Gauer, C., Andert, M., Hoffmann, A., Riemenschneider, M. J., Krebs, W., Chalmers, N., Lötzsch, C., Naumann, U. J., Xiang, W., et al. (2024) · Figshare · doi:10.6084/m9.figshare.26658454
van Olst, L., Kamermans, A., Halters, S., van der Pol, S. M. A., Rodríguez, E., Verberk, I. M. W., Verberk, S. G. S., Wessels, D. W. R., Rodriguez-Mogeda, C., Verhoeff, J., et al. (2024) · Figshare · doi:10.6084/m9.figshare.26711657
van Olst, L., Kamermans, A., Halters, S., van der Pol, S. M. A., Rodríguez, E., Verberk, I. M. W., Verberk, S. G. S., Wessels, D. W. R., Rodriguez-Mogeda, C., Verhoeff, J., et al. (2024) · Figshare · doi:10.6084/m9.figshare.26711663
Schneider, Y., Gauer, C., Andert, M., Hoffmann, A., Riemenschneider, M. J., Krebs, W., Chalmers, N., Lötzsch, C., Naumann, U. J., Xiang, W., et al. (2024) · Figshare · doi:10.6084/m9.figshare.26658463
van Olst, L., Kamermans, A., Halters, S., van der Pol, S. M. A., Rodríguez, E., Verberk, I. M. W., Verberk, S. G. S., Wessels, D. W. R., Rodriguez-Mogeda, C., Verhoeff, J., et al. (2024) · Figshare · doi:10.6084/m9.figshare.26711630
van Olst, L., Kamermans, A., Halters, S., van der Pol, S. M. A., Rodríguez, E., Verberk, I. M. W., Verberk, S. G. S., Wessels, D. W. R., Rodriguez-Mogeda, C., Verhoeff, J., et al. (2024) · Figshare · doi:10.6084/m9.figshare.26711648
Schneider, Y., Gauer, C., Andert, M., Hoffmann, A., Riemenschneider, M. J., Krebs, W., Chalmers, N., Lötzsch, C., Naumann, U. J., Xiang, W., et al. (2024) · Figshare · doi:10.6084/m9.figshare.24934474
van Olst, L., Kamermans, A., Halters, S., van der Pol, S. M. A., Rodríguez, E., Verberk, I. M. W., Verberk, S. G. S., Wessels, D. W. R., Rodriguez-Mogeda, C., Verhoeff, J., et al. (2024) · Figshare · doi:10.6084/m9.figshare.25687615
van Olst, L., Kamermans, A., Halters, S., van der Pol, S. M. A., Rodríguez, E., Verberk, I. M. W., Verberk, S. G. S., Wessels, D. W. R., Rodriguez-Mogeda, C., Verhoeff, J., et al. (2024) · Figshare · doi:10.6084/m9.figshare.26711633
Schneider, Y., Gauer, C., Andert, M., Hoffmann, A., Riemenschneider, M. J., Krebs, W., Chalmers, N., Lötzsch, C., Naumann, U. J., Xiang, W., et al. (2024) · Figshare · doi:10.6084/m9.figshare.26658457
van Olst, L., Kamermans, A., Halters, S., van der Pol, S. M. A., Rodríguez, E., Verberk, I. M. W., Verberk, S. G. S., Wessels, D. W. R., Rodriguez-Mogeda, C., Verhoeff, J., et al. (2024) · Figshare · doi:10.6084/m9.figshare.26711645
van Olst, L., Kamermans, A., Halters, S., van der Pol, S. M. A., Rodríguez, E., Verberk, I. M. W., Verberk, S. G. S., Wessels, D. W. R., Rodriguez-Mogeda, C., Verhoeff, J., et al. (2024) · Figshare · doi:10.6084/m9.figshare.25687445
Schneider, Y., Gauer, C., Andert, M., Hoffmann, A., Riemenschneider, M. J., Krebs, W., Chalmers, N., Lötzsch, C., Naumann, U. J., Xiang, W., et al. (2024) · Figshare · doi:10.6084/m9.figshare.24934579
van Olst, L., Kamermans, A., Halters, S., van der Pol, S. M. A., Rodríguez, E., Verberk, I. M. W., Verberk, S. G. S., Wessels, D. W. R., Rodriguez-Mogeda, C., Verhoeff, J., et al. (2024) · Figshare · doi:10.6084/m9.figshare.26711618
van Olst, L., Kamermans, A., Halters, S., van der Pol, S. M. A., Rodríguez, E., Verberk, I. M. W., Verberk, S. G. S., Wessels, D. W. R., Rodriguez-Mogeda, C., Verhoeff, J., et al. (2024) · Figshare · doi:10.6084/m9.figshare.26711669
van Olst, L., Kamermans, A., Halters, S., van der Pol, S. M. A., Rodríguez, E., Verberk, I. M. W., Verberk, S. G. S., Wessels, D. W. R., Rodriguez-Mogeda, C., Verhoeff, J., et al. (2024) · Figshare · doi:10.6084/m9.figshare.26711627
Schneider, Y., Gauer, C., Andert, M., Hoffmann, A., Riemenschneider, M. J., Krebs, W., Chalmers, N., Lötzsch, C., Naumann, U. J., Xiang, W., et al. (2024) · Figshare · doi:10.6084/m9.figshare.26658448
Schneider, Y., Gauer, C., Andert, M., Hoffmann, A., Riemenschneider, M. J., Krebs, W., Chalmers, N., Lötzsch, C., Naumann, U. J., Xiang, W., et al. (2024) · Figshare · doi:10.6084/m9.figshare.26658451
van Olst, L., Kamermans, A., Halters, S., van der Pol, S. M. A., Rodríguez, E., Verberk, I. M. W., Verberk, S. G. S., Wessels, D. W. R., Rodriguez-Mogeda, C., Verhoeff, J., et al. (2024) · Figshare · doi:10.6084/m9.figshare.26711666
van Olst, L., Kamermans, A., Halters, S., van der Pol, S. M. A., Rodríguez, E., Verberk, I. M. W., Verberk, S. G. S., Wessels, D. W. R., Rodriguez-Mogeda, C., Verhoeff, J., et al. (2024) · Figshare · doi:10.6084/m9.figshare.26711660
Peng, L., Chen, M., Zuo, X., Wu, X., Gong, M., Qin, Z., Sun, W., & Xu, E. (2026) · Journal of Neuroinflammation · doi:10.1186/s12974-026-03822-2
Papageorgopoulou, M., Adair, E., Fancy, N. N., Avot, B., Boulger, S. L., Wülfing, M. S., & Matthews, P. M. (2026) · bioRxiv (Cold Spring Harbor Laboratory) · doi:10.64898/2026.06.18.733103
Microglia prune developing cortical blood vessels through PD-1 signaling
Zhang, M., Wang, Y., Yang, R., Ji, F., Li, S., Li, C., Zhao, X., Li, H., & Jiao, J. (2026) · Nature Neuroscience · doi:10.1038/s41593-026-02378-x
Wu, J., Zhou, D., Jiang, K., Li, Z., Ouyang, J., Feng, L., Liu, Z., & Luo, D. (2026) · Biochemical Pharmacology · doi:10.1016/j.bcp.2026.118338
Resistance to PD-1/PD-L1 blockade: Mechanism and pharmacological strategies
Kim, A. M. J., Lee, N., Chen, H., & Lim, S. (2026) · Pharmacological Research · doi:10.1016/j.phrs.2026.108404
Chen, X., Wang, X., Li, C., Shan, K., Wang, L., Hashimoto, K., Shao, K., Wei, P., & Yang, J.-J. (2026) · Brain Behavior and Immunity · doi:10.1016/j.bbi.2026.106965 · Cited by 1
Anikeeva, O. S., Маркова, Е. В., Гольдина, И. А., Серенко, Е. В., Шушпанова, Т. В., & Владимирович, С. И. (2026) · Успехи геронтологии · doi:10.34922/ae.2026.39.4.013
Park, T., Chang, L., Chung, S. W., Lee, S., Bae, S., Condello, C., Kim, Y. H., Lee, J., Kim, H.-J., Kwon, H., et al. (2026) · Science Advances · doi:10.1126/sciadv.adx0731 · Cited by 4
Chen, J., Zhang, W., Song, L., Liao, Y., Zhang, H., Xia, Y., & Cui, D. (2026) · Clinical and Translational Medicine · doi:10.1002/ctm2.70839
CD8+ t cell-mediated regulation of synaptic integrity in Alzheimer’s disease
Fu, H., Yang, J., & Zhang, M. (2026) · Frontiers in Immunology · doi:10.3389/fimmu.2026.1903001
Targeting the peripheral immune system for treatment of Alzheimer’s disease
Almasarani, E., Fog, M. H., Vorup‐Jensen, T., & Juul‐Madsen, K. (2026) · Molecular Neurodegeneration Advances · doi:10.1186/s44477-026-00054-9
Metadata
- Authors
- Kummer, M. P., Ising, C., Kummer, C., Sarlus, H., Griep, A., Vieira‐Saecker, A., Schwartz, S., Halle, A., Brückner, M., Händler, K., Schultze, J. L., Beyer, M., Latz, E., & Heneka, M. T.
- Affiliations
- University of Bonn (DE)
- German Center for Neurodegenerative Diseases (DE)
- Center of Advanced European Studies and Research (DE)
- Corresponding author
- Kummer, Markus P
- Heneka, Michael T
- ORCID
- Venue
- The EMBO Journal
- Published
- 2021-11-26
- Volume
- 40
- Issue
- 24
- Pages
- e108662-e108662
- ISSN
- 0261-4189 (ISSN-L)
- 1460-2075
- PMC
- PMC8672180
- OpenAlex
- W3215791278
- Cited by
- 127
- References
- 55
- Citations by year
- 2026: 22 · 2025: 28 · 2024: 42 · 2023: 24 · 2022: 10 · 2021: 1
- FWCI
- 9.38
- Type
- journal article
- Language
- en
- Open access
- hybrid
- doi.org
- Licence
- Locations
- The EMBO Journal (publishedVersion, cc-by-nc-nd)
- PubMed Central (publishedVersion, cc-by-nc-nd)
- PubMed (publishedVersion)
- Open Repository and Bibliography (University of Luxembourg) (submittedVersion, other-oa)
- DZNE Pub (submittedVersion, other-oa)
- Funders
- European Union Seventh Framework Program (INMIND)
- Deutsche Forschungsgemeinschaft (KFO177, IS 299/3‐1, EXC2151‐390873048)
- Topics
- Life Sciences › Neuroscience › Neurology › Neuroinflammation and Neurodegeneration Mechanisms
- Life Sciences › Neuroscience › Cellular and Molecular Neuroscience › Alzheimer's disease research and treatments
- Life Sciences › Immunology and Microbiology › Immunology › Phagocytosis and Immune Regulation
- Keywords
- Alzheimer's disease, neuroinflammation, PD-1/PD-L1 axis, microglia, astrocytes, amyloid plaques, amyloid-beta uptake, CD36, APP/PS1 mice, immune checkpoint, phagocytosis, amyloid-beta clearance, ectodomain shedding
- MeSH terms
- Aged, Aged, 80 and over, Alzheimer Disease, Animals, Astrocytes, Disease Models, Animal, Female, HeLa Cells, Humans, Male, Mice, Transgenic, Middle Aged, Up-Regulation, Case-Control Studies, Amyloid beta-Protein Precursor, Gene Deletion, Microglia, CD36 Antigens, Mice, HEK293 Cells, B7-H1 Antigen, Programmed Cell Death 1 Receptor
About these checks
Registry, retraction, Cites and statistics results are computed, not judged, with one exception: a printed reference that no index lists is read once by a model before it counts as a citation error. Claims are extracted by a model and kept only when their quote appears verbatim in the text; each cited source is then checked, with a model’s help, for whether it says what the claim relies on. Those verdicts can be wrong — read the claim’s quote and the cited source before relying on one.
Statistics and arithmetic are recomputed, not judged.
Confidence bands are shown only for fields calibrated on our annotated test set. None is calibrated yet, so no band is shown.
What counts as a claim ›How we measure confidence ›How we check this ›
Are you an author, or do you see a problem with this page? Request a review
