

The DOI matches its Crossref record; 70 of the 70 references it cites were found in a registry or an index.
Gut microbiota influences pathological angiogenesis in obesity‐driven choroidal neovascularization
Open accessAbstract
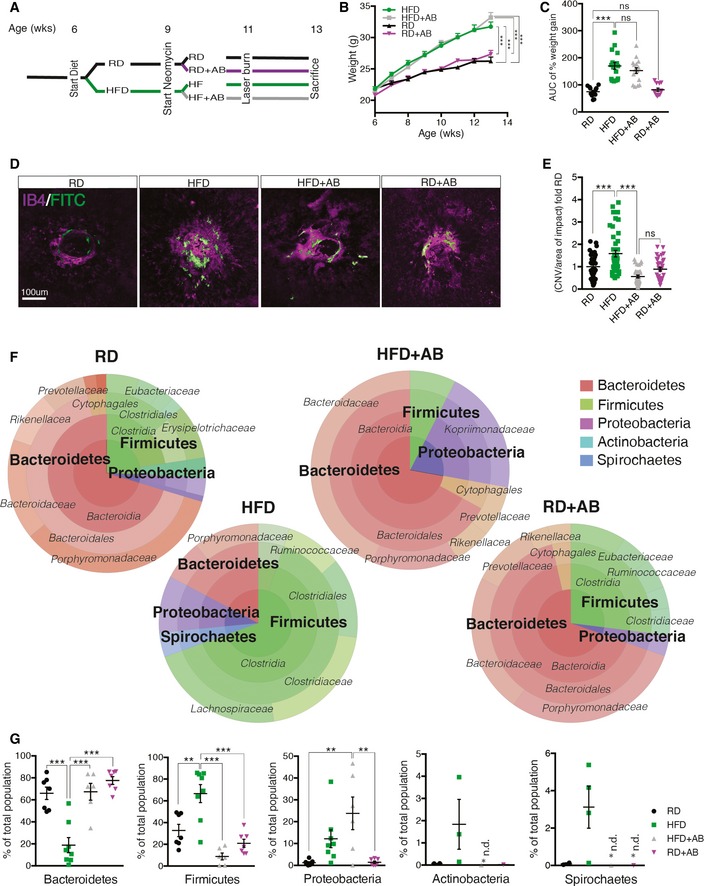
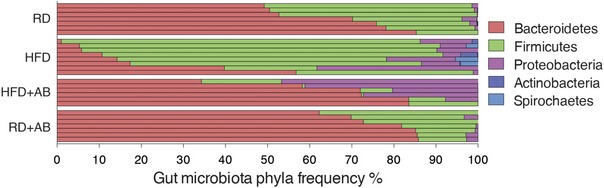
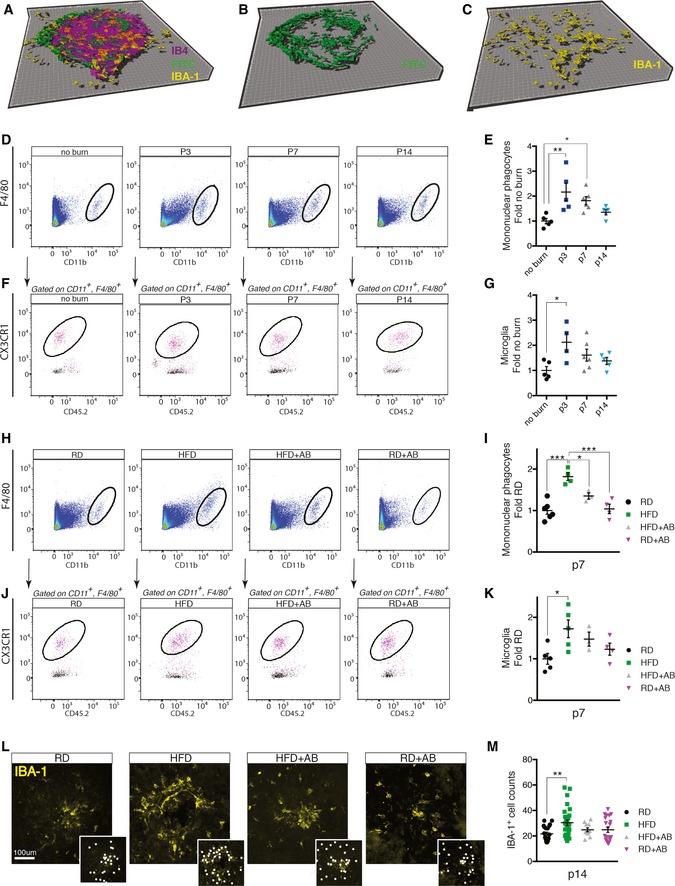
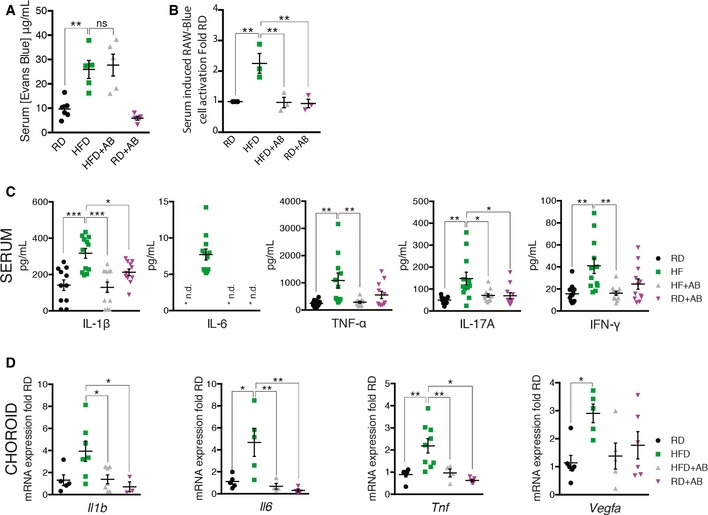
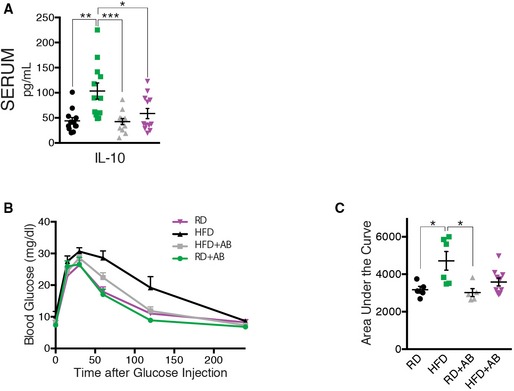
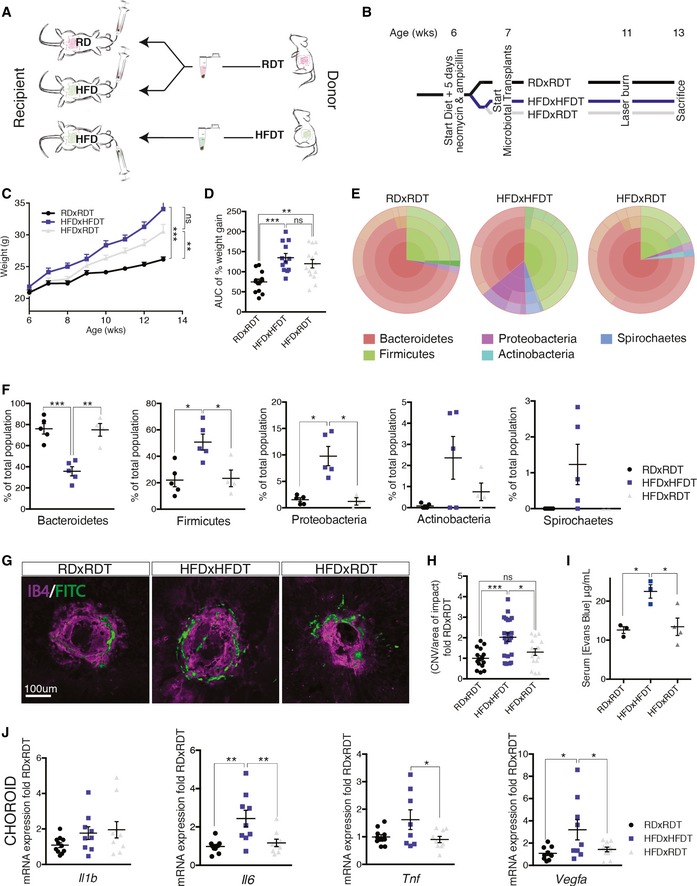
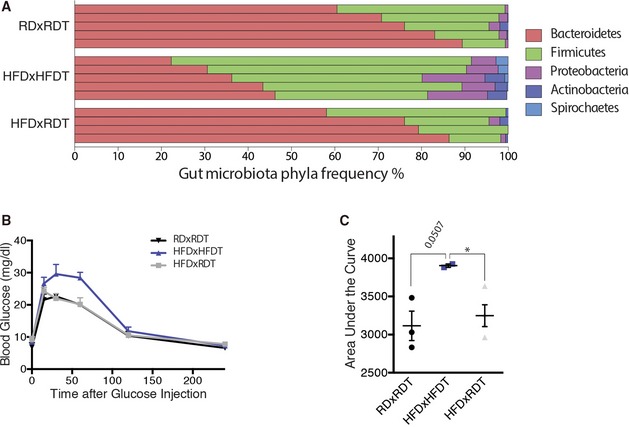
Age-related macular degeneration in its neovascular form (NV AMD) is the leading cause of vision loss among adults above the age of 60. Epidemiological data suggest that in men, overall abdominal obesity is the second most important environmental risk factor after smoking for progression to late-stage NV AMD To date, the mechanisms that underscore this observation remain ill-defined. Given the impact of high-fat diets on gut microbiota, we investigated whether commensal microbes influence the evolution of AMD Using mouse models of NV AMD, microbiotal transplants, and other paradigms that modify the gut microbiome, we uncoupled weight gain from confounding factors and demonstrate that high-fat diets exacerbate choroidal neovascularization (CNV) by altering gut microbiota. Gut dysbiosis leads to heightened intestinal permeability and chronic low-grade inflammation characteristic of inflammaging with elevated production of IL-6, IL-1β, TNF-α, and VEGF-A that ultimately aggravate pathological angiogenesis.
Overview
The claims and statistics of this paper haven’t been checked yet.
Run the check — free, no account needed. It reads the open-access text and checks the sources it cites.
Integrity signals
Registry
Cites
Statistics
Figures
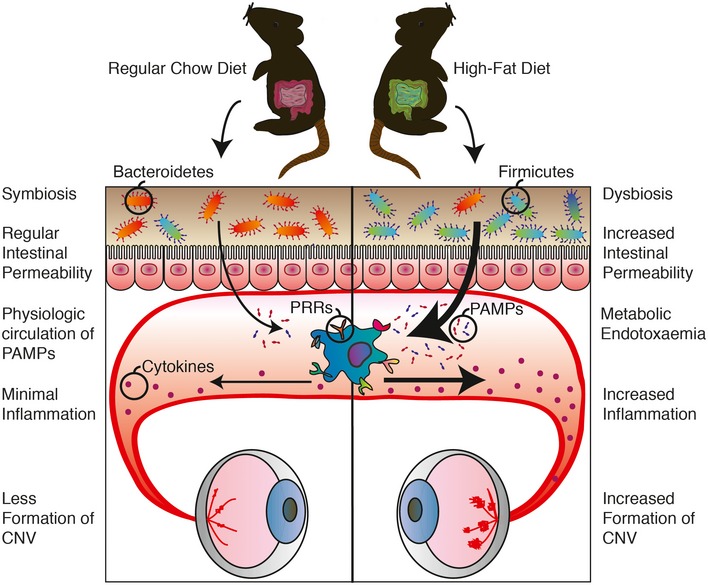
Verification
Claims the paper makes
The claims and statistics of this paper haven’t been checked yet.
Run the check — free, no account needed. It reads the open-access text and checks the sources it cites.
Claims other papers make about this one
Each is checked against this paper’s own text: does it say what the citing paper says it does?
In the citing paper
“The altered microbial composition has also been associated with neovascularization and immune cell activation in retinal disease models [4, 50, 99].”
From Fecal microbiota transfer between young and aged mice reverses hallmarks of the aging gut, eye, and brain (2022) · cites this paper as [4]
In the citing paper
“Association studies have linked intestinal microbial products with the development and progression of age-related choroidal neovascularization (CNV) and age-related macular degeneration (AMD) [4, 131, 133].”
From Fecal microbiota transfer between young and aged mice reverses hallmarks of the aging gut, eye, and brain (2022) · cites this paper as [4]
Self-check
Percentages, sums and reported differences re-computed from the paper’s own numbers.
The self-check needs the paper’s full text.
Citations
Cites
An obesity-associated gut microbiome with increased capacity for energy harvest
Turnbaugh, P. J., Ley, R. E., Mahowald, M. A., Magrini, V., Mardis, E. R., & Gordon, J. I. (2006) · Nature · doi:10.1038/nature05414 · Cited by 12,444
Diet rapidly and reproducibly alters the human gut microbiome
David, L. A., Maurice, C. F., Carmody, R. N., Gootenberg, D. B., Button, J. E., Wolfe, B. E., Ling, A. V., Devlin, A. S., Varma, Y., Fischbach, M. A., et al. (2014) · Nature · doi:10.1038/nature12820 · Cited by 10,100
Human gut microbes associated with obesity
Ley, R. E., Turnbaugh, P. J., Klein, S., & Gordon, J. I. (2006) · Nature · doi:10.1038/4441022a · Cited by 8,785
Metabolic Endotoxemia Initiates Obesity and Insulin Resistance
Cani, P. D., Amar, J., Iglesias, M. A., Poggi, M., Knauf, C., Bastelica, D., Neyrinck, A. M., Fava, F., Tuohy, K. M., Chabo, C., et al. (2007) · Diabetes · doi:10.2337/db06-1491 · Cited by 6,638
Wong, W. L., Su, X., Li, X., Cheung, C. M. G., Klein, R., Cheng, C., & Wong, T. Y. (2014) · The Lancet Global Health · doi:10.1016/s2214-109x(13)70145-1 · Cited by 5,545
Host-Bacterial Mutualism in the Human Intestine
Bäckhed, F., Ley, R. E., Sonnenburg, J. L., Peterson, D. A., & Gordon, J. I. (2005) · Science · doi:10.1126/science.1104816 · Cited by 5,277
Cani, P. D., Bibiloni, R., Knauf, C., Waget, A., Neyrinck, A. M., Delzenne, N. M., & Burcelin, R. (2008) · Diabetes · doi:10.2337/db07-1403 · Cited by 4,819
Complement factor H polymorphism in age-related macular degeneration
Klein, R. J., Zeiss, C., Chew, E. Y., Tsai, J.-Y., Sackler, R. S., Haynes, C., Henning, A. K., SanGiovanni, J. P., Mane, S. M., Mayne, S. T., et al. (2005) · Science · doi:10.1126/science.1109557 · Cited by 4,492
Functional interactions between the gut microbiota and host metabolism
Tremaroli, V., & Bäckhed, F. (2012) · Nature · doi:10.1038/nature11552 · Cited by 4,387
Chronic Inflammation (Inflammaging) and Its Potential Contribution to Age-Associated Diseases
Franceschi, C., & Campisi, J. (2014) · The Journals of Gerontology Series A: Biological Sciences and Medical Sciences · doi:10.1093/gerona/glu057 · Cited by 3,891
Research works printed but not linked: 1
- Combadière C, Feumi C, Raoul W, Keller N, Rodéro M, Pézard A, Lavalette S, Houssier M, Jonet L, Picard E et al (2007) CX3CR1‐dependent subretinal microglia cell accumulation is associated with cardinal features of age‐related macular degeneration. J Clin Invest 117: 2920–2928 · DOI · Paper page
Cited by
Sorted by citations
Parker, A., Romano, S., Ansorge, R., Aboelnour, A., Le Gall, G., Savva, G. M., Pontifex, M. G., Telatin, A., Baker, D., Jones, E., et al. (2022) · Microbiome · doi:10.1186/s40168-022-01243-w · Cited by 368
Rowan, S., Jiang, S., Korem, T., Szymanski, J., Chang, M.-L., Szelog, J., Cassalman, C., Dasuri, K., McGuire, C., Nagai, R., et al. (2017) · Proceedings of the National Academy of Sciences · doi:10.1073/pnas.1702302114 · Cited by 272
Zinkernagel, M. S., Zysset-Burri, D. C., Keller, I., Berger, L. E., Leichtle, A. B., Largiadèr, C. R., Fiedler, G. M., & Wolf, S. (2017) · Scientific Reports · doi:10.1038/srep40826 · Cited by 229
Organ-specific protection mediated by cooperation between vascular and epithelial barriers
Spadoni, I., Fornasa, G., & Rescigno, M. (2017) · Nature reviews. Immunology · doi:10.1038/nri.2017.100 · Cited by 206
Hata, M., Andriessen, E. M. M. A., Hata, M., Diaz-Marin, R., Fournier, F., Crespo‐Garcia, S., Blot, G., Juneau, R., Pilon, F., Dejda, A., et al. (2023) · Science · doi:10.1126/science.abj8894 · Cited by 195
Self-citationOn phagocytes and macular degeneration
Guillonneau, X., Eandi, C. M., Paques, M., Sahel, J.-A., Sapieha, P., & Sennlaub, F. (2017) · Progress in Retinal and Eye Research · doi:10.1016/j.preteyeres.2017.06.002 · Cited by 185
Self-citationRinninella, E., Mele, M. C., Merendino, N., Cintoni, M., Anselmi, G., Caporossi, A., Gasbarrini, A., & Minnella, A. M. (2018) · Nutrients · doi:10.3390/nu10111677 · Cited by 185
Effects of Fish n-3 PUFAs on Intestinal Microbiota and Immune System
Parolini, C. (2019) · Marine Drugs · doi:10.3390/md17060374 · Cited by 158
Gheorghe, C. E., Ritz, N. L., Martin, J. A., Wardill, H. R., Cryan, J. F., & Clarke, G. A. (2021) · Gut Microbes · doi:10.1080/19490976.2021.1941711 · Cited by 156
The pathophysiological mechanisms underlying diabetic retinopathy
Wei, L., Sun, X., Fan, C., Li, R., Zhou, S., & Yu, H. (2022) · Frontiers in Cell and Developmental Biology · doi:10.3389/fcell.2022.963615 · Cited by 130
Cao, X., Han, Y., Gu, M., Du, H., Song, M., Zhu, X., Ma, G., Pan, C., Wang, W., Zhao, E., et al. (2020) · Small · doi:10.1002/smll.202001858 · Cited by 115
The Gut–Eye Axis: Lessons Learned from Murine Models
Floyd, J. L., & Grant, M. B. (2020) · Ophthalmology and Therapy · doi:10.1007/s40123-020-00278-2 · Cited by 113
Can Gut Microbiota Affect Dry Eye Syndrome?
Moon, J., Yoon, C. H., Choi, S. H., & Kim, M. K. (2020) · International Journal of Molecular Sciences · doi:10.3390/ijms21228443 · Cited by 99
Keenan, T. D. L., Agrón, E., Mares, J. A., Clemons, T. E., van Asten, F., Swaroop, A., & Chew, E. Y. (2020) · Ophthalmology · doi:10.1016/j.ophtha.2020.04.030 · Cited by 102
The role of the gut microbiome in eye diseases
Zysset‐Burri, D. C., Morandi, S. C., Herzog, E. L., Berger, L., & Zinkernagel, M. S. (2022) · Progress in Retinal and Eye Research · doi:10.1016/j.preteyeres.2022.101117 · Cited by 103
Zysset-Burri, D. C., Keller, I., Berger, L. E., Largiadèr, C. R., Wittwer, M., Wolf, S., & Zinkernagel, M. S. (2020) · npj Genomic Medicine · doi:10.1038/s41525-020-00141-0 · Cited by 94
Li, B., Cheng, Z., Sun, X., Si, X., Gong, E. S., Wang, Y., Tian, J., Shu, C., Ma, F., Li, D., et al. (2020) · Molecular Nutrition & Food Research · doi:10.1002/mnfr.201901315 · Cited by 94
Alterations in the gut bacterial microbiome in fungal Keratitis patients
Chakravarthy, S. K., Jayasudha, R., Ranjith, K., Dutta, A., Pinna, N. K., Mande, S. S., Sharma, S., Garg, P., Murthy, S. I., & Shivaji, S. (2018) · PLoS ONE · doi:10.1371/journal.pone.0199640 · Cited by 88
The microbiome and ophthalmic disease
Baim, A. D., Movahedan, A., Farooq, A. V., & Skondra, D. (2018) · Experimental Biology and Medicine · doi:10.1177/1535370218813616 · Cited by 87
Ocular Microbiota and Intraocular Inflammation
Li, J. J., Yi, S., & Wei, L. (2020) · Frontiers in Immunology · doi:10.3389/fimmu.2020.609765 · Cited by 96
Gut Microbiota Influence in Hematological Malignancies: From Genesis to Cure
Uribe‐Herranz, M., Klein-González, N., Rodríguez‐Lobato, L. G., Juan, M., & de Larrea, C. F. (2021) · International Journal of Molecular Sciences · doi:10.3390/ijms22031026 · Cited by 84
Targeting the Gut–Eye Axis: An Emerging Strategy to Face Ocular Diseases
Campagnoli, L. I. M., Varesi, A., Barbieri, A., Marchesi, N., & Pascale, A. (2023) · International Journal of Molecular Sciences · doi:10.3390/ijms241713338 · Cited by 91
Microbiota and Ocular Diseases
Xue, W., Li, J. J., Zou, Y., Zou, B., & Wei, L. (2021) · Frontiers in Cellular and Infection Microbiology · doi:10.3389/fcimb.2021.759333 · Cited by 81
Zinc Nutrition and Inflammation in the Aging Retina
Gilbert, R. M., Pető, T., Lengyel, I., & Emri, E. (2019) · Molecular Nutrition & Food Research · doi:10.1002/mnfr.201801049 · Cited by 86
Vaginal microbiota transplantation for the treatment of bacterial vaginosis: a conceptual analysis
Ma, D., Chen, Y., & Chen, T. (2019) · FEMS Microbiology Letters · doi:10.1093/femsle/fnz025 · Cited by 72
Gut Microbiome in Retina Health: The Crucial Role of the Gut-Retina Axis
Scuderi, G., Troiani, E., & Minnella, A. M. (2022) · Frontiers in Microbiology · doi:10.3389/fmicb.2021.726792 · Cited by 70
Dietary Patterns, Carbohydrates, and Age-Related Eye Diseases
Francisco, S. G., Smith, K., Aragonès, G., Whitcomb, E. A., Weinberg, J., Wang, X., Bejarano, E., Taylor, A., & Rowan, S. (2020) · Nutrients · doi:10.3390/nu12092862 · Cited by 73
Epigenetics, microbiota, and intraocular inflammation: New paradigms of immune regulation in the eye
Wen, X., Hu, X., Li, M., Ge, X., Deng, Y., Bible, P. W., & Wei, L. (2018) · Progress in Retinal and Eye Research · doi:10.1016/j.preteyeres.2018.01.001 · Cited by 65
Jayasudha, R., Chakravarthy, S. K., Prashanthi, G. S., Sharma, S., Garg, P., Murthy, S. I., & Shivaji, S. (2018) · Journal of Biosciences · doi:10.1007/s12038-018-9798-6 · Cited by 57
The gut microbiota in retinal diseases
Bringer, M.-A., Gabrielle, P., Bron, A. M., Creuzot-Garcher, C. P., & Acar, N. (2021) · Experimental Eye Research · doi:10.1016/j.exer.2021.108867 · Cited by 52
Si, Z., Zheng, Y., & Zhao, J. (2023) · Biomolecules · doi:10.3390/biom13060901 · Cited by 61
Angiogenesis, a key point in the association of gut microbiota and its metabolites with disease
Wang, Y., Bai, M., Peng, Q., Li, L., Tian, F., Guo, Y., & Jing, C. (2024) · European journal of medical research · doi:10.1186/s40001-024-02224-5 · Cited by 51
Wang, X., Yu, C., Liu, X., Yang, J., Feng, Y., Wu, Y., Xu, Y., Zhu, Y., & Li, W. (2022) · Frontiers in Cellular and Infection Microbiology · doi:10.3389/fcimb.2022.839592 · Cited by 50
Gut microbiota contributes to the methionine metabolism in host
Wu, X., Han, Z., Liu, B., Yu, D., Sun, J., Ge, L., Tang, W., & Liu, S. (2022) · Frontiers in Microbiology · doi:10.3389/fmicb.2022.1065668 · Cited by 48
A Review of the Role of the Intestinal Microbiota in Age-Related Macular Degeneration
Lin, P., McClintic, S. M., Nadeem, U., & Skondra, D. (2021) · Journal of Clinical Medicine · doi:10.3390/jcm10102072 · Cited by 48
Li, H., Du, Y., Cheng, K., Chen, Y., Wei, L., Pei, Y., Wang, X., Wang, L., Zhang, Y., Hu, X., et al. (2024) · Cell Discovery · doi:10.1038/s41421-024-00709-5 · Cited by 48
Kutsyr, O., Noailles, A., Martínez‐Gil, N., Maestre‐Carballa, L., Martínez‐García, M., Maneu, V., Cuenca, N., & Lax, P. (2021) · Proceedings of the National Academy of Sciences · doi:10.1073/pnas.2100566118 · Cited by 46
Microbiota in cancer: molecular mechanisms and therapeutic interventions
Chen, Z., Guan, D., Wang, Z., Li, X., Dong, S., Huang, J., & Zhou, W. (2023) · MedComm · doi:10.1002/mco2.417 · Cited by 47
Gut microbiota modify risk for dietary glycemia-induced age-related macular degeneration
Rowan, S., & Taylor, A. (2018) · Gut Microbes · doi:10.1080/19490976.2018.1435247 · Cited by 46
Vujosevic, S., Alovisi, C., & Chakravarthy, U. (2023) · Acta Ophthalmologica · doi:10.1111/aos.15767 · Cited by 46
Systemic Cytokines in Retinopathy of Prematurity
Wu, P., Fu, Y.-K., Lien, R., Chiang, M., Lee, C., Chen, H., Hsueh, Y., Chen, K., Wang, N., Liu, L., et al. (2023) · Journal of Personalized Medicine · doi:10.3390/jpm13020291 · Cited by 44
The gut-retina axis: a new perspective in the prevention and treatment of diabetic retinopathy
Zhang, H., & Mo, Y. (2023) · Frontiers in Endocrinology · doi:10.3389/fendo.2023.1205846 · Cited by 42
Nayyar, A., Gindina, S., Barron, A., Hu, Y., & Danias, J. (2020) · Human Genomics · doi:10.1186/s40246-020-00257-5 · Cited by 42
Gut microbiota and derived metabolomic profiling in glaucoma with progressive neurodegeneration
Zhang, Y., Zhou, X., & Lu, Y. (2022) · Frontiers in Cellular and Infection Microbiology · doi:10.3389/fcimb.2022.968992 · Cited by 42
Microbiome Dysbiosis: A Pathological Mechanism at the Intersection of Obesity and Glaucoma
Pezzino, S., Sofia, M., Greco, L. P., Litrico, G., Filippello, G., Sarvà, I., Greca, G. L., & Latteri, S. (2023) · International Journal of Molecular Sciences · doi:10.3390/ijms24021166 · Cited by 39
Effect of Microgravity Environment on Gut Microbiome and Angiogenesis
Siddiqui, R., Qaisar, R., Goswami, N., Khan, N. A., & Elmoselhi, A. B. (2021) · Life · doi:10.3390/life11101008 · Cited by 41
Gut microbiota and eye diseases: a bibliometric study and visualization analysis
Fu, X., Tan, H., Huang, L., Chen, W., Ren, X. Z., & Chen, D. (2023) · Frontiers in Cellular and Infection Microbiology · doi:10.3389/fcimb.2023.1225859 · Cited by 38
Retinitis pigmentosa is associated with shifts in the gut microbiome
Kutsyr, O., Maestre‐Carballa, L., Gómez, M. L., Martínez‐García, M., Cuenca, N., & Lax, P. (2021) · Scientific Reports · doi:10.1038/s41598-021-86052-1 · Cited by 37
Yoon, C. H., Ryu, J. S., Moon, J., & Kim, M. K. (2021) · BMC Microbiology · doi:10.1186/s12866-021-02173-7 · Cited by 36
Grüner, N., Ortlepp, A. L., & Mattner, J. (2023) · International Journal of Molecular Sciences · doi:10.3390/ijms24065161 · Cited by 37
Alterations of the intestinal microbiota in age-related macular degeneration
Zhang, Y., Wang, T., Wan, Z., Bai, J., Xue, Y., Dai, R., Wang, M., & Peng, Q. (2023) · Frontiers in Microbiology · doi:10.3389/fmicb.2023.1069325 · Cited by 36
The Emerging Role of Gut Microbiota in Age-Related Macular Degeneration
Xiao, J. F., Zhang, J. Y., Luo, W., He, P. C., & Skondra, D. (2023) · American Journal Of Pathology · doi:10.1016/j.ajpath.2023.04.006 · Cited by 37
Connect between gut microbiome and diseases of the human eye
Shivaji, S. (2019) · Journal of Biosciences · doi:10.1007/s12038-019-9931-1 · Cited by 34
Hata, M., Hata, M., Andriessen, E. M. M. A., Juneau, R., Pilon, F., Crespo‐Garcia, S., Diaz-Marin, R., Guber, V., Binet, F., Fournier, F., et al. (2023) · Journal of Clinical Investigation · doi:10.1172/jci159757 · Cited by 35
Self-citationArterial Hypertension and the Hidden Disease of the Eye: Diagnostic Tools and Therapeutic Strategies
Pinto, R. D., Mulè, G., Vadalà, M., Carollo, C., Cottone, S., Rosei, C. A., Ciuceis, C. D., Rizzoni, D., Ferri, C., & Muiesan, M. L. (2022) · Nutrients · doi:10.3390/nu14112200 · Cited by 34
What is the impact of microbiota on dry eye: a literature review of the gut-eye axis
Song, J., Dong, H. Y., Wang, T., Yu, H., Yu, J., Ma, S., Song, X., Sun, Q., Xu, Y., & Liu, M. (2024) · BMC Ophthalmology · doi:10.1186/s12886-024-03526-2 · Cited by 42
Wu, J., Duan, C., Yang, Y., Wang, Z., Tan, C., Han, C., & Hou, X. (2023) · Journal of Translational Medicine · doi:10.1186/s12967-023-04543-3 · Cited by 32
Gut-spine axis: a possible correlation between gut microbiota and spinal degenerative diseases
Morimoto, T., Kobayashi, T., Kakiuchi, T., Esaki, M., Tsukamoto, M., Yoshihara, T., Hirata, H., Yabuki, S., & Mawatari, M. (2023) · Frontiers in Microbiology · doi:10.3389/fmicb.2023.1290858 · Cited by 32
Recent Insights into the Role of Gut Microbiota in Diabetic Retinopathy
Jiao, J., Yu, H., Yao, L., Li, L., Yang, X., & Liu, L. (2021) · Journal of Inflammation Research · doi:10.2147/jir.s336148 · Cited by 31
Immune response in retinal degenerative diseases – Time to rethink?
Xu, H., & Chen, M. (2022) · Progress in Neurobiology · doi:10.1016/j.pneurobio.2022.102350 · Cited by 33
A systematic review of gut microbiome and ocular inflammatory diseases
Shivaji, S. (2021) · Indian Journal of Ophthalmology · doi:10.4103/ijo.ijo_1362_20 · Cited by 32
Mao, D., Tao, B., Sheng, S., Jin, H. Z., Chen, W., Gao, H., Deng, J., Li, Z., Chen, F., Chan, S., et al. (2023) · Investigative Ophthalmology & Visual Science · doi:10.1167/iovs.64.12.32 · Cited by 32
Inflammatory adipose activates a nutritional immunity pathway leading to retinal dysfunction
Sterling, J. K., Baumann, B. H., Foshe, S., Voigt, A. P., Guttha, S., Alnemri, A. G., McCright, S. J., Li, M., Zauhar, R. J., Montezuma, S. R., et al. (2022) · Cell Reports · doi:10.1016/j.celrep.2022.110942 · Cited by 31
Local oral and nasal microbiome diversity in age-related macular degeneration
Rullo, J., Far, P. M., Quinn, M. P., Sharma, N. K., Bae, S. S., Irrcher, I., & Sharma, S. (2020) · Scientific Reports · doi:10.1038/s41598-020-60674-3 · Cited by 30
Inside out: Relations between the microbiome, nutrition, and eye health
Grant, M. B., Bernstein, P. S., Boesze‐Battaglia, K., Chew, E. Y., Curcio, C. A., Kenney, M. C., Klaver, C. C. W., Philp, N. J., Rowan, S., Sparrow, J. R., et al. (2022) · Experimental Eye Research · doi:10.1016/j.exer.2022.109216 · Cited by 32
From Gut to Eye: Exploring the Role of Microbiome Imbalance in Ocular Diseases
Tîrziu, A.-T., Șușan, M. M., Șușan, R. M., Sonia, T., Harich, O. O., Tudora, A. G., Varga, N.-I., Dragomir, T. L., Avram, C. R., Boru, C., et al. (2024) · Journal of Clinical Medicine · doi:10.3390/jcm13185611 · Cited by 33
The role of commensal microflora-induced T cell responses in glaucoma neurodegeneration
Tang, J., Tang, Y., Yi, I., & Chen, D. F. (2020) · Progress in brain research · doi:10.1016/bs.pbr.2020.06.002 · Cited by 28
Karczewski, J., Zielińska, A., Staszewski, R., Eder, P., Dobrowolska, A., & Souto, E. B. (2022) · International Journal of Molecular Sciences · doi:10.3390/ijms23116145 · Cited by 27
Exploring the Gut Microbiota–Retina Axis: Implications for Health and Disease
Schiavone, N., Isoldi, G., Calcagno, S., Rovida, E., Antiga, E., Almeida, C. V. D., & Lulli, M. (2025) · Microorganisms · doi:10.3390/microorganisms13051101 · Cited by 27
Gut Microbiota, Peroxisome Proliferator-Activated Receptors, and Hepatocellular Carcinoma
Yu, Q., Wu, L., Ji, J., Feng, J., Dai, W., Li, J., Wu, J., & Guo, C. (2020) · Journal of Hepatocellular Carcinoma · doi:10.2147/jhc.s277870 · Cited by 27
Biswas, L., Ibrahim, K. S., Li, X., Zhou, X., Zeng, Z., Craft, J. A., & Shu, X. (2021) · Experimental Eye Research · doi:10.1016/j.exer.2021.108625 · Cited by 26
Microbiome Crosstalk in Immunotherapy and Antiangiogenesis Therapy
Wan, X., Song, M., Wang, A., Zhao, Y., Wei, Z., & Lu, Y. (2021) · Frontiers in Immunology · doi:10.3389/fimmu.2021.747914 · Cited by 27
Wang, Z., Zhang, Y., Xu, C., Peng, A., Qin, H., & Yao, K. (2025) · Biochemical Pharmacology · doi:10.1016/j.bcp.2025.116902 · Cited by 25
A Review of the Impact of Alterations in Gut Microbiome on the Immunopathogenesis of Ocular Diseases
Bu, Y., Chan, Y. K., Wong, H. L., Poon, S. H. L., Lo, A., Shih, K. C., & Tong, L. H. T. (2021) · Journal of Clinical Medicine · doi:10.3390/jcm10204694 · Cited by 27
Gut microbiota and age-related macular degeneration: A growing partnership
Lima-Fontes, M., Meira, L. A. A., Barata, P., Falcão, M. S., & Carneiro, Â. M. (2021) · Survey of Ophthalmology · doi:10.1016/j.survophthal.2021.11.009 · Cited by 25
Gut Microbiome and Retinopathy of Prematurity
Zhang, J. Y., Greenwald, M. J., & Rodriguez, S. H. (2023) · American Journal Of Pathology · doi:10.1016/j.ajpath.2023.01.013 · Cited by 24
Xue, W., Peng, P., Wen, X., Meng, H., Qin, Y., Deng, T., Guo, S., Chen, T., Li, X., Liang, J., et al. (2023) · Investigative Ophthalmology & Visual Science · doi:10.1167/iovs.64.5.11 · Cited by 25
Yu, R., Zhou, Q., Liu, T., Liu, P., Li, H., Bian, Y., & Liu, Z. (2023) · Journal of Functional Foods · doi:10.1016/j.jff.2023.105646 · Cited by 25
Oral Metformin Inhibits Choroidal Neovascularization by Modulating the Gut-Retina Axis
Zhang, J. Y., Xiao, J. F., Xie, B., Barba, H., Boachie-Mensah, M., Shah, R. N., Nadeem, U., Spedale, M., Dylla, N. P., Lin, H., et al. (2023) · Investigative Ophthalmology & Visual Science · doi:10.1167/iovs.64.15.21 · Cited by 25
Vitamin A, systemic T-cells, and the eye: Focus on degenerative retinal disease
Thirunavukarasu, A. J., Ross, A. C., & Gilbert, R. M. (2022) · Frontiers in Nutrition · doi:10.3389/fnut.2022.914457 · Cited by 27
Zhang, J. Y., Xie, B., Barba, H., Nadeem, U., Movahedan, A., Deng, N., Spedale, M., D’Souza, M., Luo, W., Leone, V., et al. (2022) · International Journal of Molecular Sciences · doi:10.3390/ijms23179676 · Cited by 24
Innate immunity dysregulation in aging eye and therapeutic interventions
Das, S., Ahmad, Z., Suryawanshi, A. S., & Kumar, A. (2022) · Ageing Research Reviews · doi:10.1016/j.arr.2022.101768 · Cited by 24
Donabedian, P. L., Dawson, E. A., Li, Q., & Chen, J. (2021) · Ophthalmic Research · doi:10.1159/000519457 · Cited by 24
Do Oral Pathogens Inhabit the Eye and Play a Role in Ocular Diseases?
Arjunan, P., & Swaminathan, R. (2022) · Journal of Clinical Medicine · doi:10.3390/jcm11102938 · Cited by 24
Liu, K., Zou, J., Yuan, R., Fan, H., Hu, H., Cheng, Y., Liu, J., Zou, H., & You, Z. (2023) · Investigative Ophthalmology & Visual Science · doi:10.1167/iovs.64.7.22 · Cited by 21
Gut microbiota signatures and lipids metabolism profiles by exposure to polyene phosphatidylcholine
Yu, H., Yu, Z. J., Huang, H., Li, P., Tang, Q., Wang, X., & Shen, S. (2019) · BioFactors · doi:10.1002/biof.1495 · Cited by 22
Alzheimer’s disease and age-related macular degeneration: Shared and distinct immune mechanisms
Butovsky, O., & Rosenzweig, N. (2025) · Immunity · doi:10.1016/j.immuni.2025.04.013 · Cited by 22
Lee, H. J., Yoon, C. H., Kim, H. J., Ko, J. H., Ryu, J. S., Jo, D. H., Kim, J. H., Kim, D.-H., & Oh, J. Y. (2022) · Mucosal Immunology · doi:10.1038/s41385-022-00555-2 · Cited by 20
The Gut Microbiome: Human Health and Inflammatory Skin Diseases
Mann, E. A., Bae, E., Kostyuchek, D., Chung, H. J., & McGee, J. S. (2020) · Annals of Dermatology · doi:10.5021/ad.2020.32.4.265 · Cited by 22
Altered Fecal Microbiome and Metabolome in a Mouse Model of Choroidal Neovascularization
Li, Y., Cai, Y., Huang, Q., Tan, W., Li, B., Zhou, H., Wang, Z., Zou, J., Ding, C., Jiang, B., et al. (2021) · Frontiers in Microbiology · doi:10.3389/fmicb.2021.738796 · Cited by 20
PD-1+ melanocortin receptor dependent-Treg cells prevent autoimmune disease
Muhammad, F., Wang, D., Montieth, A., Lee, S., Preble, J. M., Foster, C. S., Larson, T. A., Ding, K., Dvorak, J., & Lee, D. J. (2019) · Scientific Reports · doi:10.1038/s41598-019-53297-w · Cited by 20
Lu, L., Zhuang, T., Shao, E., Liu, Y., He, H., Shu, Z., Huang, Y., Yao, Y., Lin, S., Lin, S., et al. (2019) · PLoS ONE · doi:10.1371/journal.pone.0221964 · Cited by 19
High-Fat Diet Alters the Retinal Transcriptome in the Absence of Gut Microbiota
Dao, D., Xie, B., Nadeem, U., Xiao, J. F., Movahedan, A., D’Souza, M., Leone, V., Hariprasad, S. M., Chang, E. B., Sulakhe, D., et al. (2021) · Cells · doi:10.3390/cells10082119 · Cited by 19
Zinflou, C., & Rochette, P. J. (2018) · Archives of Toxicology · doi:10.1007/s00204-018-2344-3 · Cited by 17
Molecular mechanisms of retinal ischemia
Fortmann, S. D., & Grant, M. B. (2018) · Current Opinion in Physiology · doi:10.1016/j.cophys.2018.12.008 · Cited by 20
Obesity Causes Abrupt Changes in the Testicular Microbiota and Sperm Motility of Zebrafish
Su, Y., He, L., Hu, Z., Li, Y., Zhang, Y., Fan, Z., Zhao, K., Zhang, H., & Liu, C. (2021) · Frontiers in Immunology · doi:10.3389/fimmu.2021.639239 · Cited by 17
A Tryptophan Metabolite of the Microbiota Improves Neovascularization in Diabetic Limb Ischemia
Ma, X., Yang, J., Yang, G., Li, L., Hao, X., Wang, G., An, J., & Wang, F. (2022) · Frontiers in Cardiovascular Medicine · doi:10.3389/fcvm.2022.910323 · Cited by 17
Liu, K., Wu, P., Zou, J., Fan, H., Hu, H., Cheng, Y., He, F., Liu, J., & You, Z. (2022) · Human Genetics · doi:10.1007/s00439-022-02514-0 · Cited by 17
Baldi, S., Pagliai, G., Gloria, L. D., Pallecchi, M., Barca, F., Pieri, B., Bartolucci, G., Ramazzotti, M., Amedei, A., Palendri, G., et al. (2024) · Nutrients · doi:10.3390/nu16223971 · Cited by 17
Cao, Y., Li, Y., Gkerdi, A., Reilly, J., Tan, Z., & Shu, X. (2022) · Current Medicinal Chemistry · doi:10.2174/0929867329666220511142817 · Cited by 18
Metadata
- Authors
- Andriessen, E. M., Wilson, A. M., Mawambo, G., Dejda, A., Miloudi, K., Sennlaub, F., & Sapieha, P.
- Affiliations
- Hôpital Maisonneuve-Rosemont (CA)
- Polytechnique Montréal (CA)
- McGill University (CA)
- Centre National de la Recherche Scientifique (FR)
- Corresponding author
- Sapieha, Przemyslaw
- Venue
- EMBO Molecular Medicine
- Published
- 2016-11-15
- Volume
- 8
- Issue
- 12
- Pages
- 1366-1379
- ISSN
- 1757-4676 (ISSN-L)
- 1757-4684
- PMC
- PMC5167134
- OpenAlex
- W2552235278
- Cited by
- 201
- References
- 70
- Citations by year
- 2026: 23 · 2025: 16 · 2024: 26 · 2023: 32 · 2022: 35 · 2021: 28 · 2020: 18 · 2019: 8 · 2018: 10 · 2017: 4 · 2016: 1
- FWCI
- 8.14
- Type
- journal article
- Language
- en
- Open access
- gold
- doi.org
- Locations
- EMBO Molecular Medicine (publishedVersion, other-oa)
- PubMed Central (publishedVersion, cc-by)
- PubMed (publishedVersion)
- PolyPublie (École Polytechnique de Montréal) (submittedVersion, cc-by)
- HAL (submittedVersion, cc-by)
- DOAJ (DOAJ: Directory of Open Access Journals) (submittedVersion)
- Funders
- Foundation Fighting Blindness Canada
- Canadian Institutes of Health Research (324573)
- Canadian Diabetes Association (OG‐3‐11‐3329‐PS)
- Natural Sciences and Engineering Research Council of Canada (418637)
- Fondation de l'Avenir pour la Recherche Médicale Appliquée (RMA‐2015‐010)
- Topics
- Health Sciences › Medicine › Ophthalmology › Retinal Diseases and Treatments
- Life Sciences › Biochemistry, Genetics and Molecular Biology › Molecular Biology › Gut microbiota and health
- Health Sciences › Medicine › Ophthalmology › Ocular Diseases and Behçet’s Syndrome
- Keywords
- gut microbiota, choroidal neovascularization, age-related macular degeneration, obesity, abdominal obesity, high-fat diet, gut dysbiosis, intestinal permeability, inflammaging, pathological angiogenesis, VEGF-A, low-grade inflammation, microbiota transplantation
- MeSH terms
- Gastrointestinal Microbiome, Fecal Microbiota Transplantation, Animals, Disease Models, Animal, Inflammation, Macular Degeneration, Neovascularization, Pathologic, Obesity, Cytokines, Choroidal Neovascularization, Gastrointestinal Tract, Mice, Diet, High-Fat, Dysbiosis
About these checks
Registry, retraction, Cites and statistics results are computed, not judged, with one exception: a printed reference that no index lists is read once by a model before it counts as a citation error. Claims are extracted by a model and kept only when their quote appears verbatim in the text; each cited source is then checked, with a model’s help, for whether it says what the claim relies on. Those verdicts can be wrong — read the claim’s quote and the cited source before relying on one.
Statistics and arithmetic are recomputed, not judged.
Confidence bands are shown only for fields calibrated on our annotated test set. None is calibrated yet, so no band is shown.
What counts as a claim ›How we measure confidence ›How we check this ›
Are you an author, or do you see a problem with this page? Request a review
