Cited by 28

The DOI matches its Crossref record; 2 of the 2 references it cites were found in a registry or an index.

p63 drives invasion in keratinocytes expressing HPV16 E6/E7 genes through regulation of Src-FAK signalling

Srivastava, Kirtiman, Pickard, Adam, McDade, Simon, McCance, Dennis J.·2017·Oncotarget

Overview

The claims and statistics of this paper haven’t been checked yet.

Run the check — free, no account needed. It reads the open-access text and checks the sources it cites.

A few free checks a day · papers already verified open instantly · results are public

Integrity signals

Registry

Crossref · 10.18632/oncotarget.3892

Cites

2 of 2 references verified0 citation errors · 0 not checkable

Statistics

Figures

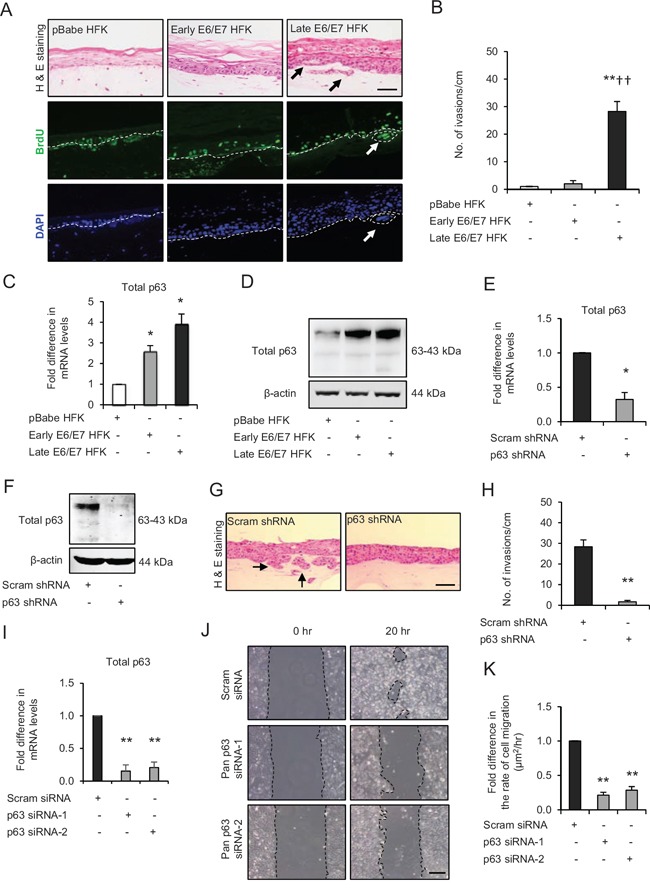
Figure 1 p63 transcription factors drive cell migration and invasion in late passage human foreskin keratinocytes (HFK) expressing human papilloma virus (HPV)16 E6/E7 genes A. H&E staining and immunofluorescence detection of BrdU uptake and nuclei (DAPI) on 3D-organotypic rafts established from normal HFK expressing pBabe (control), early passage and late passage HFK expressing E6/E7 genes cells seeded on retinoblastoma-depleted human foreskin fibroblast embedded collagen-I plugs. Invasive incidents are indicated by arrows. B. Quantification of number of invasive incidents across the rafts per cm. C. The relative mRNA and D. protein expression of total p63 and loading control β-actin in aforementioned cells. E. Relative mRNA and F. protein levels of total p63 in late passage E6/E7-HFK after stable p63 (p63 shRNA) knockdown compared to its controls (scram shRNA). G. H&E staining of rafts established from late passage HFK expressing control and stable p63 knockdown. H. Quantification of number of invasive incidents per cm across the rafts. I. Relative mRNA levels of total p63 after transient knockdown by control and two different p63 siRNA molecules in late passage E6/E7-HFK. J. Representative phase contrast images of scratch wound assay, showing cell migration after 20 hr in these cells seeded on collagen-I coated plates. K. Quantification of migration represented as μm2/hr. Scale bars represent 100 μm. N = 3 independent experiments, mean ± SEM, **p < 0.01 compared to the respective controls, *p < 0.05 compared to the control, ††p < 0.01 compared to early passage E6/E7-HFK.
Figure 1 p63 transcription factors drive cell migration and invasion in late passage human foreskin keratinocytes (HFK) expressing human papilloma virus (HPV)16 E6/E7 genes A. H&E staining and immunofluorescence detection of BrdU uptake and nuclei (DAPI) on 3D-organotypic rafts established from normal HFK expressing pBabe (control), early passage and late passage HFK expressing E6/E7 genes cells seeded on retinoblastoma-depleted human foreskin fibroblast embedded collagen-I plugs. Invasive incidents are indicated by arrows. B. Quantification of number of invasive incidents across the rafts per cm. C. The relative mRNA and D. protein expression of total p63 and loading control β-actin in aforementioned cells. E. Relative mRNA and F. protein levels of total p63 in late passage E6/E7-HFK after stable p63 (p63 shRNA) knockdown compared to its controls (scram shRNA). G. H&E staining of rafts established from late passage HFK expressing control and stable p63 knockdown. H. Quantification of number of invasive incidents per cm across the rafts. I. Relative mRNA levels of total p63 after transient knockdown by control and two different p63 siRNA molecules in late passage E6/E7-HFK. J. Representative phase contrast images of scratch wound assay, showing cell migration after 20 hr in these cells seeded on collagen-I coated plates. K. Quantification of migration represented as μm2/hr. Scale bars represent 100 μm. N = 3 independent experiments, mean ± SEM, **p < 0.01 compared to the respective controls, *p < 0.05 compared to the control, ††p < 0.01 compared to early passage E6/E7-HFK.CC BY · PubMed Central
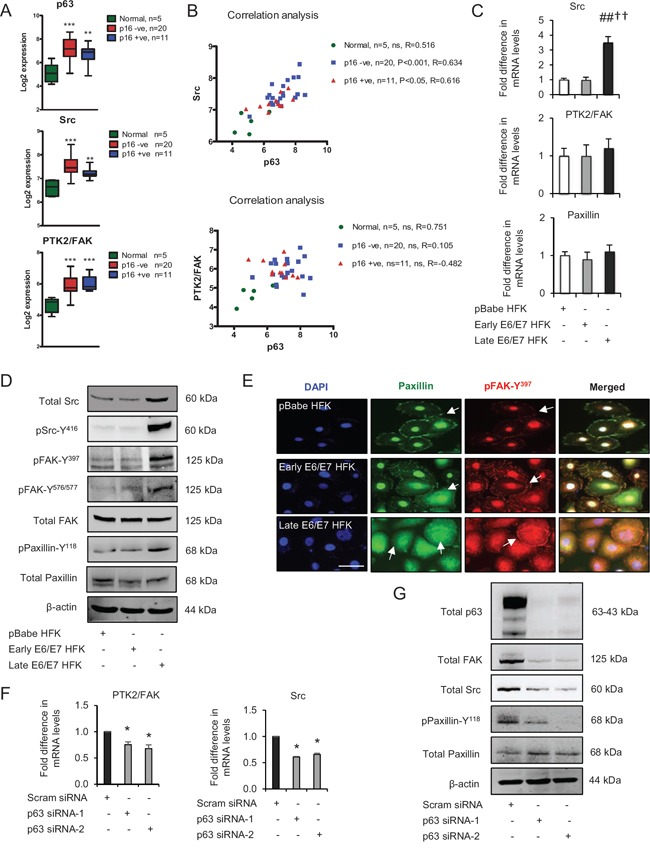
Figure 2 p63 transcription factors modulate Src-focal adhesion kinase (FAK) signalling A. Microarray data of total p63, Src and PTK2/FAK mRNA levels in normal tissue and HPV-negative (p16-) and HPV-positive (p16+) oro-pharyngeal tumours. B. Correlation analysis of Src and PTK2/FAK against p63 in samples from (A). C. Relative mRNA levels of Src, PTK2/FAK and paxillin in human foreskin keratinocytes (HFK) expressing pBabe (control), early and late passage HFK expressing E6/E7 genes. D. Protein levels of total Src, FAK, paxillin, pSrc-Y416, pFAK-Y397, pFAK-Y576/577 and pPaxillin-Y118; E. cellular localisation (arrows) of total paxillin and pFAK-Y397 in aforementioned cells. F. Relative mRNA levels of PTK2/FAK and Src in p63 depleted cells and G. protein levels of total p63, Src, FAK, paxillin and pPaxillin-Y118 after transient knockdown by Scram (control) and two different p63 siRNA molecules in late passage E6/E7-HFK. β-actin served as loading control. Scale bars represent 50 μm. N = 3 independent experiments, mean ± SEM, ***p < 0.0001 compared to normal, ##p < 0.01 compared to the control, *p < 0.01 compared to the control, ††p < 0.01 compared to early passage E6/E7 HFK, ns: not significant.
Figure 2 p63 transcription factors modulate Src-focal adhesion kinase (FAK) signalling A. Microarray data of total p63, Src and PTK2/FAK mRNA levels in normal tissue and HPV-negative (p16-) and HPV-positive (p16+) oro-pharyngeal tumours. B. Correlation analysis of Src and PTK2/FAK against p63 in samples from (A). C. Relative mRNA levels of Src, PTK2/FAK and paxillin in human foreskin keratinocytes (HFK) expressing pBabe (control), early and late passage HFK expressing E6/E7 genes. D. Protein levels of total Src, FAK, paxillin, pSrc-Y416, pFAK-Y397, pFAK-Y576/577 and pPaxillin-Y118; E. cellular localisation (arrows) of total paxillin and pFAK-Y397 in aforementioned cells. F. Relative mRNA levels of PTK2/FAK and Src in p63 depleted cells and G. protein levels of total p63, Src, FAK, paxillin and pPaxillin-Y118 after transient knockdown by Scram (control) and two different p63 siRNA molecules in late passage E6/E7-HFK. β-actin served as loading control. Scale bars represent 50 μm. N = 3 independent experiments, mean ± SEM, ***p < 0.0001 compared to normal, ##p < 0.01 compared to the control, *p < 0.01 compared to the control, ††p < 0.01 compared to early passage E6/E7 HFK, ns: not significant.CC BY · PubMed Central
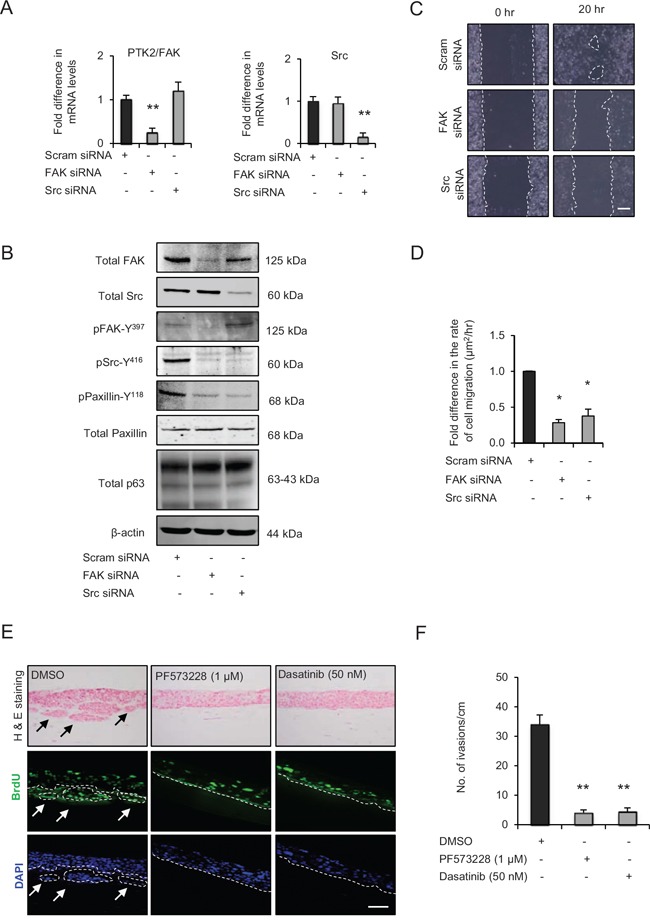
Figure 3 Src-focal adhesion kinase (FAK) signalling regulates cell migration and invasion A. Relative mRNA levels of PTK2/FAK and Src and, B. protein levels of total FAK, Src, paxillin, pSrc-Y416, pFAK-Y397, pPaxillin-Y118 and β-actin after transient knockdown by Scram (control), FAK and Src siRNA molecules in late passage human foreskin keratinocytes (HFK) expressing HPV16 E6/E7 genes. C. Representative phase contrast images of scratch wound assay on collagen-I coated plates showing cell migration after transient knockdown with scram, FAK and Src siRNA in the late passage E6/E7-HFK, which was D. quantified and represented as μm2/hr. E. H&E staining and immunofluorescence detection of BrdU uptake and nuclei (DAPI) on 3D-organotypic rafts established from late passage E6/E7-HFK seeded on retinoblastoma-depleted HFF embedded collagen-I plugs and treated with specific inhibitors of FAK (PF573228) and Src (dasatinib) activities. Rafts treated with DMSO served as control. Invasive incidents are indicated by arrows. F. Quantification of number of invasive incidents across the rafts per cm. Scale bars represents 100 μm. N = 3 independent experiments, mean ± SEM, **p < 0.01 compared to the respective controls, *p < 0.05 compared to the control.
Figure 3 Src-focal adhesion kinase (FAK) signalling regulates cell migration and invasion A. Relative mRNA levels of PTK2/FAK and Src and, B. protein levels of total FAK, Src, paxillin, pSrc-Y416, pFAK-Y397, pPaxillin-Y118 and β-actin after transient knockdown by Scram (control), FAK and Src siRNA molecules in late passage human foreskin keratinocytes (HFK) expressing HPV16 E6/E7 genes. C. Representative phase contrast images of scratch wound assay on collagen-I coated plates showing cell migration after transient knockdown with scram, FAK and Src siRNA in the late passage E6/E7-HFK, which was D. quantified and represented as μm2/hr. E. H&E staining and immunofluorescence detection of BrdU uptake and nuclei (DAPI) on 3D-organotypic rafts established from late passage E6/E7-HFK seeded on retinoblastoma-depleted HFF embedded collagen-I plugs and treated with specific inhibitors of FAK (PF573228) and Src (dasatinib) activities. Rafts treated with DMSO served as control. Invasive incidents are indicated by arrows. F. Quantification of number of invasive incidents across the rafts per cm. Scale bars represents 100 μm. N = 3 independent experiments, mean ± SEM, **p < 0.01 compared to the respective controls, *p < 0.05 compared to the control.CC BY · PubMed Central
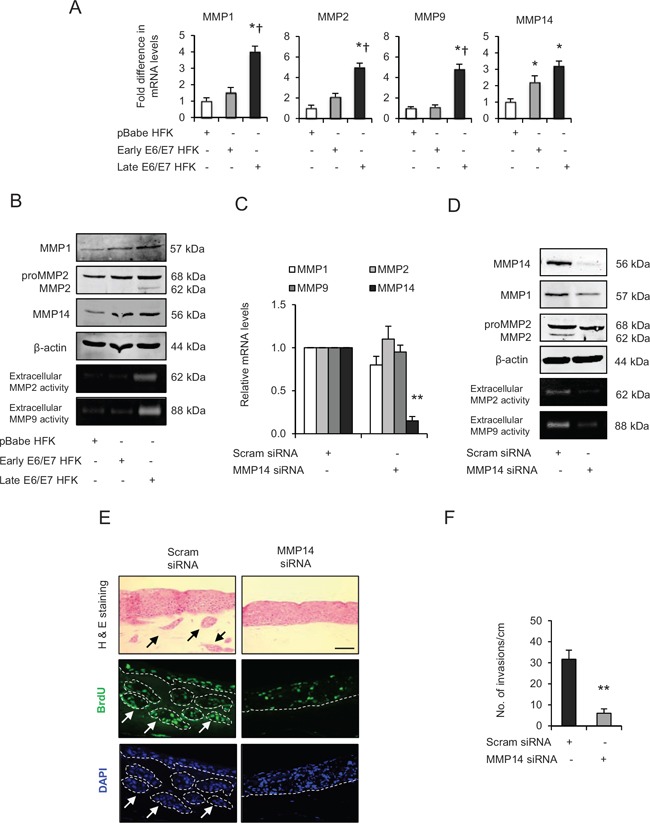
Figure 4 Matrix metalloproteinases (MMP)-mediated extra cellular matrix (ECM) remodelling is important during invasion A. The relative mRNA levels of MMP1, 2, 9 and 14, B. protein expression and activities on gelatin zymographs of MMPs in human foreskin keratinocytes (HFK) expressing pBabe (control), early and late passage HFK expressing HPV16 E6/E7 genes. C. Relative mRNA levels of MMP1, 2, 9 and 14; and D. protein levels of MMP1, 2, 14 and extracellular activities of MMP2 and MMP9 after transient knockdown by Scram (control) or MMP14 siRNA molecules in the late passage E6/E7-HFK. E. H&E staining and immunofluorescence detection of BrdU uptake and nuclei (DAPI) on 3D-organotypic rafts established from aforementioned MMP14 knockdown cells. Invasive incidents are indicated by arrows. F. Quantification of number of invasive incidents across the rafts per cm. β-actin served as loading control. Scale bar represent 100 μm. N = 3 independent experiments, mean ± SEM, **p < 0.01 compared to the control, *p < 0.05 compared to the controls, †p < 0.05 compared to the early passage population.
Figure 4 Matrix metalloproteinases (MMP)-mediated extra cellular matrix (ECM) remodelling is important during invasion A. The relative mRNA levels of MMP1, 2, 9 and 14, B. protein expression and activities on gelatin zymographs of MMPs in human foreskin keratinocytes (HFK) expressing pBabe (control), early and late passage HFK expressing HPV16 E6/E7 genes. C. Relative mRNA levels of MMP1, 2, 9 and 14; and D. protein levels of MMP1, 2, 14 and extracellular activities of MMP2 and MMP9 after transient knockdown by Scram (control) or MMP14 siRNA molecules in the late passage E6/E7-HFK. E. H&E staining and immunofluorescence detection of BrdU uptake and nuclei (DAPI) on 3D-organotypic rafts established from aforementioned MMP14 knockdown cells. Invasive incidents are indicated by arrows. F. Quantification of number of invasive incidents across the rafts per cm. β-actin served as loading control. Scale bar represent 100 μm. N = 3 independent experiments, mean ± SEM, **p < 0.01 compared to the control, *p < 0.05 compared to the controls, †p < 0.05 compared to the early passage population.CC BY · PubMed Central
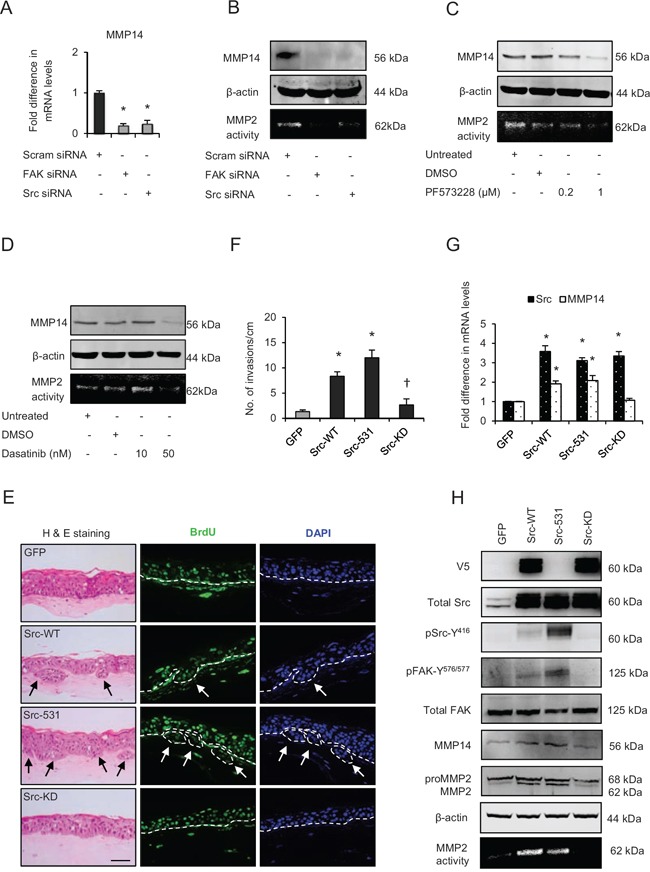
Figure 5 Src-focal adhesion kinase (FAK) signalling regulates expression and activity of matrix metalloproteinases-14 (MMP14) A. Relative mRNA levels of MMP14, B. protein levels and activity (observed by extracellular MMP2-mediated digestion of gelatin) of MMP14 after transient knockdown by Scram (control), FAK and Src siRNA molecules in late passage human foreskin keratinocytes (HFK) expressing HPV16 E6/E7 genes. C and D. Protein expression of total MMP14 and MMP14 activity in the late passage populations after dose-dependent inhibition of FAK (PF573228) and Src (dasatinib) activities. E. H&E staining and immunofluorescence detection of BrdU uptake and nuclei (DAPI) on 3D-organotypic rafts established from early passage HFK expressing E6/E7 genes alongside GFP (control), wild type-Src (Src-WT), constitutively active (Src-531) and kinase dead (Src-KD) constructs. The invasive incidents are indicated by arrows. F. Quantification of the number of invasive incidents across the rafts per cm. G. The relative mRNA levels of Src and MMP14 and H. protein levels of V5-tagged Src (Src-531 was not tagged with V5), total Src, pSrc-Y416, total FAK, pFAK-Y576/577, MMP2 and MMP14, and the activity of MMP14 in early passage HFK expressing E6/E7 genes and Src constructs. β-actin served as loading control. Scale bar represent 100 μm. N = 3 independent experiments, mean ± SEM, *p < 0.05 compared to the respective controls, †p < 0.05 compared to the early passage population expressing Src-531.
Figure 5 Src-focal adhesion kinase (FAK) signalling regulates expression and activity of matrix metalloproteinases-14 (MMP14) A. Relative mRNA levels of MMP14, B. protein levels and activity (observed by extracellular MMP2-mediated digestion of gelatin) of MMP14 after transient knockdown by Scram (control), FAK and Src siRNA molecules in late passage human foreskin keratinocytes (HFK) expressing HPV16 E6/E7 genes. C and D. Protein expression of total MMP14 and MMP14 activity in the late passage populations after dose-dependent inhibition of FAK (PF573228) and Src (dasatinib) activities. E. H&E staining and immunofluorescence detection of BrdU uptake and nuclei (DAPI) on 3D-organotypic rafts established from early passage HFK expressing E6/E7 genes alongside GFP (control), wild type-Src (Src-WT), constitutively active (Src-531) and kinase dead (Src-KD) constructs. The invasive incidents are indicated by arrows. F. Quantification of the number of invasive incidents across the rafts per cm. G. The relative mRNA levels of Src and MMP14 and H. protein levels of V5-tagged Src (Src-531 was not tagged with V5), total Src, pSrc-Y416, total FAK, pFAK-Y576/577, MMP2 and MMP14, and the activity of MMP14 in early passage HFK expressing E6/E7 genes and Src constructs. β-actin served as loading control. Scale bar represent 100 μm. N = 3 independent experiments, mean ± SEM, *p < 0.05 compared to the respective controls, †p < 0.05 compared to the early passage population expressing Src-531.CC BY · PubMed Central
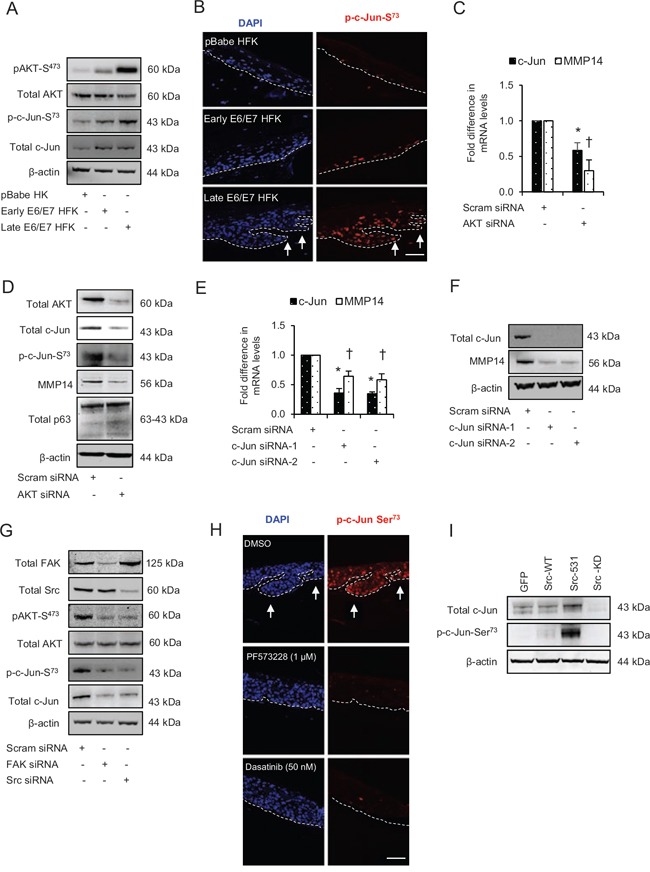
Figure 6 Src-focal adhesion kinase (FAK) signalling regulates the expression and activation of c-Jun via AKT activation A. The protein levels of pAKT-S473, total AKT, p-c-Jun-S73 and total c-Jun in the normal human foreskin keratinocytes (HFK) expressing pBabe (control), early passage and late passage HFK expressing HPV16 E6/E7 genes. B. Immunofluorescence detection of p-c-Jun-S73 on the rafts. C. The relative mRNA levels of c-Jun and MMP14, and D. protein levels of total AKT, total c-Jun, p-c-Jun-S73, MMP14 and total p63 after transient knockdown with scram (control) and total AKT siRNA in late passage E6/E7-HFK. E. The relative mRNA levels of c-Jun and MMP14, and F. protein levels of total c-Jun, MMP14 and β-actin after transient knockdown with scram (control) and two different c-Jun siRNA molecules in the late passage E6/E7-HFK. G. Protein levels of total FAK, total Src, pAKT-S473, total AKT, p-c-Jun-S73 and total c-Jun after transient knockdown by Scram (control), FAK or Src siRNA molecules in the late passage E6/E7-HFK. H. Immunofluorescence detections of p-c-Jun-S73 and BrdU uptake on 3D-organotypic rafts established from the late passage population and treated with specific inhibitors of FAK (PF573228) and Src (dasatinib) activities. Rafts treated with DMSO served as control. The invasive incidents are indicated by arrows. I. Protein levels of total c-Jun, p-c-Jun-S73 in early passage E6/E7-HFK expressing GFP, wild type-Src (Src-WT), constitutively active (Src-531) and kinase dead (Src-KD) constructs. β-actin served as loading control. Scale bars represent 100 μm. N = 3 independent experiments, mean ± SEM, *p < 0.05 compared to the respective controls, †p < 0.05 compared to the respective controls.
Figure 6 Src-focal adhesion kinase (FAK) signalling regulates the expression and activation of c-Jun via AKT activation A. The protein levels of pAKT-S473, total AKT, p-c-Jun-S73 and total c-Jun in the normal human foreskin keratinocytes (HFK) expressing pBabe (control), early passage and late passage HFK expressing HPV16 E6/E7 genes. B. Immunofluorescence detection of p-c-Jun-S73 on the rafts. C. The relative mRNA levels of c-Jun and MMP14, and D. protein levels of total AKT, total c-Jun, p-c-Jun-S73, MMP14 and total p63 after transient knockdown with scram (control) and total AKT siRNA in late passage E6/E7-HFK. E. The relative mRNA levels of c-Jun and MMP14, and F. protein levels of total c-Jun, MMP14 and β-actin after transient knockdown with scram (control) and two different c-Jun siRNA molecules in the late passage E6/E7-HFK. G. Protein levels of total FAK, total Src, pAKT-S473, total AKT, p-c-Jun-S73 and total c-Jun after transient knockdown by Scram (control), FAK or Src siRNA molecules in the late passage E6/E7-HFK. H. Immunofluorescence detections of p-c-Jun-S73 and BrdU uptake on 3D-organotypic rafts established from the late passage population and treated with specific inhibitors of FAK (PF573228) and Src (dasatinib) activities. Rafts treated with DMSO served as control. The invasive incidents are indicated by arrows. I. Protein levels of total c-Jun, p-c-Jun-S73 in early passage E6/E7-HFK expressing GFP, wild type-Src (Src-WT), constitutively active (Src-531) and kinase dead (Src-KD) constructs. β-actin served as loading control. Scale bars represent 100 μm. N = 3 independent experiments, mean ± SEM, *p < 0.05 compared to the respective controls, †p < 0.05 compared to the respective controls.CC BY · PubMed Central
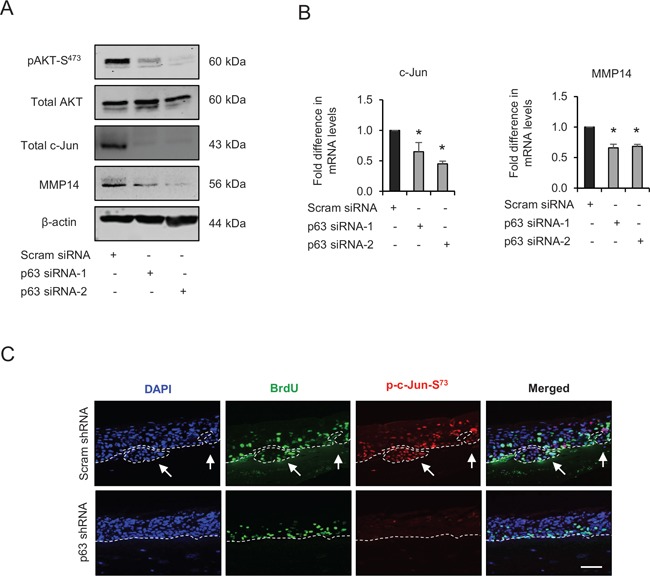
Figure 7 p63 regulates the expression and/or activation of AKT, c-Jun and matrix metalloproteinase-14 (MMP14) A. Protein levels of pAKT-S473, total AKT, total c-Jun, MMP14 and β-actin; and B. the relative mRNA levels of c-Jun and MMP14 after transient knockdown by Scram (control) and two different p63 siRNA molecules in late passage human foreskin keratinocytes (HFK) expressing human papilloma virus (HPV)16 E6/E7 genes. C. Immunofluorescence detections of p-c-Jun-S73 and BrdU uptake on 3D-organotypic rafts established from late passage HFK after stable p63 (p63 shRNA) knockdown compared to its control (scram shRNA). The invasive incidents are indicated by arrows. Scale bar represent 100 μm. N = 3 independent experiments, mean ± SEM, *p < 0.05 compared to the controls.
Figure 7 p63 regulates the expression and/or activation of AKT, c-Jun and matrix metalloproteinase-14 (MMP14) A. Protein levels of pAKT-S473, total AKT, total c-Jun, MMP14 and β-actin; and B. the relative mRNA levels of c-Jun and MMP14 after transient knockdown by Scram (control) and two different p63 siRNA molecules in late passage human foreskin keratinocytes (HFK) expressing human papilloma virus (HPV)16 E6/E7 genes. C. Immunofluorescence detections of p-c-Jun-S73 and BrdU uptake on 3D-organotypic rafts established from late passage HFK after stable p63 (p63 shRNA) knockdown compared to its control (scram shRNA). The invasive incidents are indicated by arrows. Scale bar represent 100 μm. N = 3 independent experiments, mean ± SEM, *p < 0.05 compared to the controls.CC BY · PubMed Central
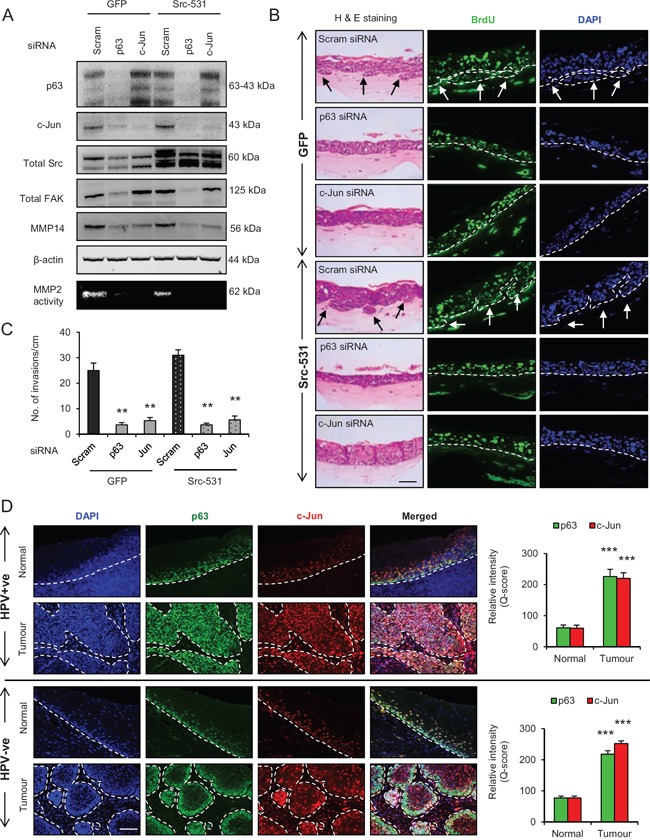
Figure 8 p63 regulates the Src/c-Jun/matrix metalloproteinases-14 (MMP14)-mediated extra cellular matrix (ECM) remodelling and invasion A. Protein levels of total p63, c-Jun, Src, focal adhesion kinase (FAK), MMP14 and β-actin; and activity of MMP2 as read out of the MMP14 activity after knockdown with Scram (control), total p63 or c-Jun siRNA in late passage human foreskin keratinocytes (HFK) expressing HPV16 E6/E7 gene alongside GFP or constitutively active Src (Src-531) constructs. B. H&E staining showing invasions (arrows) and immunofluorescence detection of BrdU uptake and nuclei (DAPI) on 3D-organotypic rafts established with cells from (A). C. Quantification of number of invasive incidents across the rafts per cm. D. Immunofluorescence detection and quantification (Q-score) of p63 and c-Jun in normal epithelium and tumour areas from HPV positive (+ve) and HPV negative (−ve) oro-pharyngeal squamous cell carcinomas. Scale bar represent 100 μm. N = 3 independent experiments, 5 (HPV+ve) and 5 (HPV−ve) tumour sections, mean ± SEM, ***p < 0.001 compared to the normal areas, **p < 0.01 compared to the controls.
Figure 8 p63 regulates the Src/c-Jun/matrix metalloproteinases-14 (MMP14)-mediated extra cellular matrix (ECM) remodelling and invasion A. Protein levels of total p63, c-Jun, Src, focal adhesion kinase (FAK), MMP14 and β-actin; and activity of MMP2 as read out of the MMP14 activity after knockdown with Scram (control), total p63 or c-Jun siRNA in late passage human foreskin keratinocytes (HFK) expressing HPV16 E6/E7 gene alongside GFP or constitutively active Src (Src-531) constructs. B. H&E staining showing invasions (arrows) and immunofluorescence detection of BrdU uptake and nuclei (DAPI) on 3D-organotypic rafts established with cells from (A). C. Quantification of number of invasive incidents across the rafts per cm. D. Immunofluorescence detection and quantification (Q-score) of p63 and c-Jun in normal epithelium and tumour areas from HPV positive (+ve) and HPV negative (−ve) oro-pharyngeal squamous cell carcinomas. Scale bar represent 100 μm. N = 3 independent experiments, 5 (HPV+ve) and 5 (HPV−ve) tumour sections, mean ± SEM, ***p < 0.001 compared to the normal areas, **p < 0.01 compared to the controls.CC BY · PubMed Central
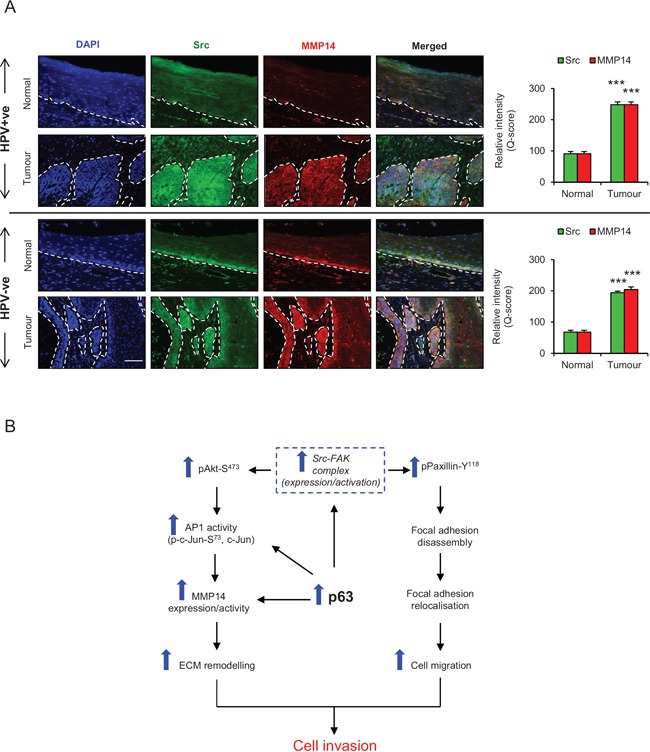
Figure 9 A. Immunofluorescence detection and quantification (Q-score) of Src and MMP14 in normal epithelium and tumour areas from HPV positive (+ve) and HPV negative (−ve) oro-pharyngeal squamous cell carcinomas The nuclei are stained with DAPI. B. Schematic representation of the role of p63 proteins in regulating ECM remodelling, cell migration and invasion via Src/FAK/AKT/AP-1 signalling pathway. Scale bar represent 100 μm. N = 5 (HPV+ve) and 5 (HPV−ve) tumour sections, mean ± SEM, ***p < 0.001 compared to the normal areas.
Figure 9 A. Immunofluorescence detection and quantification (Q-score) of Src and MMP14 in normal epithelium and tumour areas from HPV positive (+ve) and HPV negative (−ve) oro-pharyngeal squamous cell carcinomas The nuclei are stained with DAPI. B. Schematic representation of the role of p63 proteins in regulating ECM remodelling, cell migration and invasion via Src/FAK/AKT/AP-1 signalling pathway. Scale bar represent 100 μm. N = 5 (HPV+ve) and 5 (HPV−ve) tumour sections, mean ± SEM, ***p < 0.001 compared to the normal areas.CC BY · PubMed Central

Verification

Claims the paper makes

The claims and statistics of this paper haven’t been checked yet.

Run the check — free, no account needed. It reads the open-access text and checks the sources it cites.

A few free checks a day · papers already verified open instantly · results are public

Claims other papers make about this one

Each is checked against this paper’s own text: does it say what the citing paper says it does?

Self-check

Percentages, sums and reported differences re-computed from the paper’s own numbers.

The self-check needs the paper’s full text.

Citations

Cites

Research works printed but not linked: 49

  1. Parkin, 2008, Estimates of worldwide burden of cancer in 2008 GLOBOCAN, Int J Cancer, 127, 2893
  2. Sidransky, 2000, Evidence for a causal association between human papillomavirus and a subset of head and neck cancers, J Natl Cancer Inst, 92, 709, 10.1093/jnci/92.9.709 · DOI
  3. McCance, 2010, MicroRNA 203 Expression in Keratinocytes Is Dependent on Regulation of p53 Levels by E6, J Virol, 84, 10644, 10.1128/JVI.00703-10 · DOI
  4. Laimins, 2010, Human Papillomaviruses Modulate Expression of MicroRNA 203 upon Epithelial Differentiation to Control Levels of p63 Proteins, J Virol, 84, 5212, 10.1128/JVI.00078-10 · DOI · Paper page
  5. van Bokhoven, 2002, P63 gene mutations and human developmental syndromes, Am J Med Genet, 112, 284, 10.1002/ajmg.10778 · DOI · Paper page
  6. Brunner, 2002, Splitting p63, Am J Hum Genet, 71, 1, 10.1086/341450 · DOI
  7. McCance, 2011, Role of Delta Np63 gamma in Epithelial to Mesenchymal Transition, J Biol Chem, 286, 3915, 10.1074/jbc.M110.162511 · DOI
  8. Nylander, 2008, p63 contributes to cell invasion and migration in squamous cell carcinoma of the head and neck, Cancer Lett, 263, 26, 10.1016/j.canlet.2007.12.011 · DOI
  9. Ashworth, 2012, Genome-wide analysis of p63 binding sites identifies AP-2 factors as co-regulators of epidermal differentiation, Nucleic Acids Res, 40, 7190, 10.1093/nar/gks389 · DOI
  10. Frame, 1998, The catalytic activity of Src is dispensable for translocation to focal adhesions but controls the turnover of these structures during cell motility, Embo J, 17, 81, 10.1093/emboj/17.1.81 · DOI
  11. Bakin, 2013, Integrin beta 5 contributes to the tumorigenic potential of breast cancer cells through the Src-FAK and MEK-ERK signaling pathways, Oncogene, 32, 3049, 10.1038/onc.2012.320 · DOI
  12. Henis, 2007, Src kinase activity and SH2 domain regulate the dynamics of Src association with lipid and protein targets, J Cell Biol, 178, 675, 10.1083/jcb.200701133 · DOI
  13. Guan, 2009, Signal transduction by focal adhesion kinase in cancer, Cancer and Metastasis Rev, 28, 35, 10.1007/s10555-008-9165-4 · DOI
  14. Johnson, 2011, Regulation of SRC family kinases in human cancers, J signal transduct, 2011, 865819
  15. Horwitz, 2004, FAK-Src signalling through paxillin, ERK and MLCK regulates adhesion disassembly, Nat Cell Biol, 6, 154, 10.1038/ncb1094 · DOI
  16. Karamanos, 2011, Roles of matrix metalloproteinases in cancer progression and their pharmacological targeting, FEBS J, 278, 16, 10.1111/j.1742-4658.2010.07919.x · DOI
  17. Werb, 2010, Matrix Metalloproteinases: Regulators of the Tumor Microenvironment, Cell, 141, 52, 10.1016/j.cell.2010.03.015 · DOI · Paper page
  18. McCance, 2013, AKT in stromal fibroblasts controls invasion of epithelial cells, Oncotarget, 4, 1103, 10.18632/oncotarget.1078 · DOI
  19. McCance, 2007, The E7 protein from human papillomavirus type 16 enhances keratinocyte migration in an AKT-dependent manner, Oncogene, 26, 7386, 10.1038/sj.onc.1210541 · DOI
  20. McCance, 2012, Inactivation of Rb in stromal fibroblasts promotes epithelial cell invasion, EMBO J, 31, 3092, 10.1038/emboj.2012.153 · DOI
  21. McCance, 2014, Genome-wide characterization reveals complex interplay between TP53 and TP63 in response to genotoxic stress, Nucleic Acids Res, 42, 6270, 10.1093/nar/gku299 · DOI
  22. Kalna, 2010, Spectral clustering of microarray data elucidates the roles of microenvironment remodeling and immune responses in survival of head and neck squamous cell carcinoma, J Clin Oncol, 28, 2881, 10.1200/JCO.2009.24.8724 · DOI
  23. Werb, 2007, Matrix metalloproteinases and the regulation of tissue remodelling, Nat Rev Mol Cell Biol, 8, 221, 10.1038/nrm2125 · DOI · Paper page
  24. Hsiao, 2012, Japanese encephalitis virus induces matrix metalloproteinase-9 expression via a ROS/c-Src/PDGFR/PI3K/AKT/MAPKs-dependent AP-1 pathway in rat brain astrocytes, J Neuroinflammation, 9, 12, 10.1186/1742-2094-9-12 · DOI
  25. Haas, 2006, c-Jun regulates MMP-2 and MTI-MMP mRNA expression in endothelium, FASEB J, 20, A710
  26. Canc Genome Atlas Res N, 2012, Comprehensive genomic characterization of squamous cell lung cancers, Nature, 491, 519
  27. Seth, 2014, Characterization of HPV and host genome interactions in primary head and neck cancers, Proc Natl Acad Sci USA, 111, 15544, 10.1073/pnas.1416074111 · DOI
  28. Frame, 2005, The role of focal-adhesion kinase in cancer. A new therapeutic opportunity, Nat Rev Cancer, 5, 505, 10.1038/nrc1647 · DOI
  29. Okada, 1997, Membrane type 1 matrix metalloproteinase digests interstitial collagens and other extracellular matrix macromolecules, J Biol Chem, 272, 2446, 10.1074/jbc.272.4.2446 · DOI · Paper page
  30. Boucher, 2011, Cancer cell-associated MT1-MMP promotes blood vessel invasion and distant metastasis in triple-negative mammary tumors, Cancer Res, 71, 4527, 10.1158/0008-5472.CAN-10-4376 · DOI
  31. Cao, 2011, Inhibition of Matrix Metalloproteinase 14 (MMP-14)-mediated cancer cell migration, J Biol Chem, 286, 33167, 10.1074/jbc.M111.256644 · DOI · Paper page
  32. Kuang, 2009, Selective inhibition of matrix metalloproteinase-14 blocks tumor growth, invasion, and angiogenesis, Cancer Res, 69, 1517, 10.1158/0008-5472.CAN-08-3255 · DOI
  33. Ideker, 2014, Matrix-metalloproteinases in head and neck carcinoma-cancer genome atlas analysis and fluorescence imaging in mice, Otolaryngol Head Neck Surg, 151, 612, 10.1177/0194599814545083 · DOI
  34. Lee, 2006, Homophilic interactions of tetraspanin CD151 up-regulate motility and matrix metalloproteinase-9 expression of human melanoma cells through adhesion-dependent c-Jun activation signaling pathways, J Biol Chem, 281, 24279, 10.1074/jbc.M601209200 · DOI
  35. Tang, 2009, Cyr61 increases migration and MMP-13 expression via alpha v beta 3 integrin, FAK, ERK, and AP-1-dependent pathway in human chondrosarcoma cells, Carcinogenesis, 30, 258, 10.1093/carcin/bgn284 · DOI
  36. Roghi, 2012, Membrane type I-matrix metalloproteinase (MT1-MMP) ubiquitination at Lys(581) increases cellular invasion through type I collagen, J Biol Chem, 287, 11533, 10.1074/jbc.M111.306340 · DOI
  37. Beliveau, 2007, Src-dependent phosphorylation of membrane type I-matrix metalloproteinase on cytoplasmic tyrosine 573 - Role in endothelial and tumor cell migration, J Biol Chem, 282, 15690, 10.1074/jbc.M608045200 · DOI
  38. Zhao, 2014, KLF8 and FAK cooperatively enrich the active MMP14 on the cell surface required for the metastatic progression of breast cancer, Oncogene, 33, 2909, 10.1038/onc.2013.247 · DOI
  39. Coppolino, 2011, Phosphorylation of Membrane type I-matrix metalloproteinase (MT1-MMP) and its Vesicle-associated membrane protein 7 (VAMP7)-dependent trafficking facilitate cell invasion and migration, J Biol Chem, 286, 43405, 10.1074/jbc.M111.297069 · DOI
  40. Kuphal, 2012, ETS-1/RhoC signaling regulates the transcription factor c-Jun in melanoma, Int J Cancer, 130, 2801, 10.1002/ijc.26277 · DOI
  41. Fu, 2013, Tumor suppressor PDCD4 modulates miR-184-mediated direct suppression of C-MYC and BCL2 blocking cell growth and survival in nasopharyngeal carcinoma, Cell Death Dis, 4, e872, 10.1038/cddis.2013.376 · DOI
  42. Aiba, 2008, p63/p51-induced onset of keratinocyte differentiation via the c-Jun N-terminal kinase pathway is counteracted by keratinocyte growth factor, J Biol Chem, 283, 34241, 10.1074/jbc.M804101200 · DOI
  43. McCance, 2006, Induction of tetraploidy through loss of p53 and upregulation of Plk1 by human papillomavirus type-16 E6, Oncogene, 25, 2444, 10.1038/sj.onc.1209276 · DOI
  44. Laimins, 1988, Human Papilloma Virus type-16 alters human epithelial-cell differentiation in vitro, Proc Natl Acad Sci USA, 85, 7169, 10.1073/pnas.85.19.7169 · DOI · Paper page
  45. Lefkowitz, 2000, Beta-arrestin1 interacts with the catalytic domain of the tyrosine kinase c-SRC - Role of beta-arrestin1-dependent targeting of c-SRC in receptor endocytosis, J B Chem, 275, 11312, 10.1074/jbc.275.15.11312 · DOI
  46. Enquist, 1996, Protocols for Gene Transfer in Neuroscience: Towards Gene Therapy of Neurological Disorders
  47. McCance, 2010, Acetylation of Rb by PCAF is required for nuclear localization and keratinocyte differentiation, J Cell Sci, 123, 3718, 10.1242/jcs.068924 · DOI
  48. Bayraktutan, 2013, PKC-beta exacerbates in vitro brain barrier damage in hyperglycemic settings via regulation of RhoA/Rho-kinase/MLC2 pathway, J Cereb Blood Flow Metab, 33, 1928, 10.1038/jcbfm.2013.151 · DOI
  49. Bayraktutan, 2014, Attenuation of urokinase activity during experimental ischaemia protects the cerebral barrier from damage through regulation of matrix metalloproteinase-2 and NAD(P)H oxidase, Eur J Neurosci, 39, 2119, 10.1111/ejn.12552 · DOI

Metadata

Authors
Srivastava, K., Pickard, A., McDade, S., & McCance, D. J.
Affiliations
Centre for Cancer Research and Cell Biology, Queen's University Belfast, Belfast BT9 7BL, UK
Venue
Oncotarget
Published
2015-05-07
Volume
8
Issue
10
Pages
16202-16219
ISSN
1949-2553
Cited by
28
References
2
Language
en

About these checks

Registry, retraction, Cites and statistics results are computed, not judged, with one exception: a printed reference that no index lists is read once by a model before it counts as a citation error. Claims are extracted by a model and kept only when their quote appears verbatim in the text; each cited source is then checked, with a model’s help, for whether it says what the claim relies on. Those verdicts can be wrong — read the claim’s quote and the cited source before relying on one.

Statistics and arithmetic are recomputed, not judged.

Confidence bands are shown only for fields calibrated on our annotated test set. None is calibrated yet, so no band is shown.

What counts as a claim ›How we measure confidence ›How we check this ›

Are you an author, or do you see a problem with this page? Request a review