

Post-fire vegetation and fuel development influences fire severity patterns in reburns
Open accessThe DOI matches its Crossref record; 88 of the 88 references it cites were found in a registry or an index.
Abstract
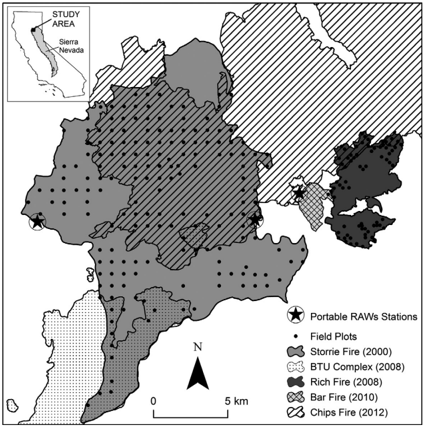
In areas where fire regimes and forest structure have been dramatically altered, there is increasing concern that contemporary fires have the potential to set forests on a positive feedback trajectory with successive reburns, one in which extensive stand‐replacing fire could promote more stand‐replacing fire. Our study utilized an extensive set of field plots established following four fires that occurred between 2000 and 2010 in the northern Sierra Nevada, California, USA that were subsequently reburned in 2012. The information obtained from these field plots allowed for a unique set of analyses investigating the effect of vegetation, fuels, topography, fire weather, and forest management on reburn severity. We also examined the influence of initial fire severity and time since initial fire on influential predictors of reburn severity. Our results suggest that high‐ to moderate‐severity fire in the initial fires led to an increase in standing snags and shrub vegetation, which in combination with severe fire weather promoted high‐severity fire effects in the subsequent reburn. Although fire behavior is largely driven by weather, our study demonstrates that post‐fire vegetation composition and structure are also important drivers of reburn severity. In the face of changing climatic regimes and increases in extreme fire weather, these results may provide managers with options to create more fire‐ resilient ecosystems. In areas where frequent high‐severity fire is undesirable, management activities such as thinning, prescribed fire, or managed wildland fire can be used to moderate fire behavior not only prior to initial fires, but also before subsequent reburns.
Overview
The claims and statistics of this paper haven’t been checked yet.
Free: it reads the open-access text and checks the first 5 claims that cite a source we can check. Create a free account to check every claim.
Integrity signals
Registry
Cites
Statistics
Figures



Verification
Claims the paper makes
The claims and statistics of this paper haven’t been checked yet.
Free: it reads the open-access text and checks the first 5 claims that cite a source we can check. Create a free account to check every claim.
Claims other papers make about this one
Each is checked against this paper’s own text: does it say what the citing paper says it does?
The source backs part of the claim, not all of it — or backs it for a different population, condition or comparison.
In the citing paper
“Areas that do burn under wildfire conditions (as opposed to prescribed fire) within 15-25 years after extensive mortality are prone to long-term conversion to shrub fields because of the potential loss of both established tree regeneration and seed source for postfire conifer regeneration (Coppoletta et al. 2016).”
From Drought, Tree Mortality, and Wildfire in Forests Adapted to Frequent Fire (2018) · cites this paper as Coppoletta et al. 2016
Experimental — accuracy not yet measured
Self-check
Percentages, sums and reported differences re-computed from the paper’s own numbers.
The self-check needs the paper’s full text.
Citations
Cites
R: A Language and Environment for Statistical Computing
R Core Team (2025) · doi:10.32614/r.manuals · Cited by 352,181
Resilience and Stability of Ecological Systems
Holling, C. S. (1973) · Annual Review of Ecology and Systematics · doi:10.1146/annurev.es.04.110173.000245 · Cited by 18,995 · cited 1×
“Altering conditions so that disturbance processes can act to increase, rather than reduce, forest heterogeneity may provide ecosystems with the ecological fexibility (Holling 1973) to withstand and persist through future changes in climate and climaterelated processes (Safford et al. 2012a).”
BackgroundGeneralized Additive Models: An Introduction with R
Wood, S. N. (2017) · doi:10.1201/9781315370279 · Cited by 13,852
Koyak, R. A., Hastie, T. J., & Tibshirani, R. J. (1991) · Journal of the American Statistical Association · doi:10.2307/2290538 · Cited by 7,596
Wood, S. N. (2006) · doi:10.1201/9781420010404 · Cited by 4,953
Bias in random forest variable importance measures: Illustrations, sources and a solution
Strobl, C., Boulesteix, A.-L., Zeileis, A., & Hothorn, T. (2007) · BMC Bioinformatics · doi:10.1186/1471-2105-8-25 · Cited by 3,688
Hastie, T., & Tibshirani, R. (1986) · Statistical Science · doi:10.1214/ss/1177013604 · Cited by 3,409
Conditional variable importance for random forests
Strobl, C., Boulesteix, A.-L., Kneib, T., Augustin, T., & Zeileis, A. (2008) · BMC Bioinformatics · doi:10.1186/1471-2105-9-307 · Cited by 3,254
Strobl, C., Malley, J., & Tutz, G. (2009) · Psychological Methods · doi:10.1037/a0016973 · Cited by 2,583 · cited 2×
“Predictor variables with importance values greater than the absolute value of the lowest negative score were considered infuential or of potential interest (Strobl et al. 2009).”
BackgroundMiller, J. D., & Thode, A. E. (2007) · Remote Sensing of Environment · doi:10.1016/j.rse.2006.12.006 · Cited by 1,431 · cited 2×
“Fire severity was estimated using the Relative differenced Normalized Burn Ratio (RdNBR), derived from Landsat Thematic Mapper data acquired during the frst growing season after the fre was controlled (Miller and Thode 2007).”
BackgroundMethod
Research works printed but not linked: 2
- Collins B. M., 2014, Science synthesis to support socioecological resilience in the Sierra Nevada and southern Cascade Range. General Technical Report PSW‐GTR‐247, 143
- Safford H., 2012, Managing Sierra Nevada forests. Gen. Tech. Rep. PSW‐GTR‐237, 184
Cited by
Wildfire-Driven Forest Conversion in Western North American Landscapes
Coop, J. D., Parks, S. A., Stevens-Rumann, C. S., Crausbay, S. D., Higuera, P. E., Hurteau, M. D., Tepley, A., Whitman, E., Assal, T., Collins, B. M., et al. (2020) · BioScience · doi:10.1093/biosci/biaa061 · Cited by 642
“In low-elevation forests in California, large forested areas were converted to shrubland when they burned in high-severity fires between 2000 and 2010 (Coppoletta et al. 2016).”
Self-citationClimate change impact on future wildfire danger and activity in southern Europe: a review
Dupuy, J.-L., Fargeon, H., Martin-StPaul, N., Pimont, F., Ruffault, J., Guijarro, M., Hernando, C., Madrigal, J., & Fernandes, P. (2020) · Annals of Forest Science · doi:10.1007/s13595-020-00933-5 · Cited by 433
Drought, Tree Mortality, and Wildfire in Forests Adapted to Frequent Fire
Stephens, S. L., Collins, B. M., Fettig, C. J., Finney, M. A., Hoffman, C. M., Knapp, E. E., North, M. P., Safford, H., & Wayman, R. B. (2018) · BioScience · doi:10.1093/biosci/bix146 · Cited by 407
Self-citationHagmann, R. K., Hessburg, P. F., Prichard, S. J., Povak, N. A., Brown, P. M., Fulé, P. Z., Keane, R. E., Knapp, E. E., Lydersen, J. M., Metlen, K. L., et al. (2021) · Ecological Applications · doi:10.1002/eap.2431 · Cited by 400
“However, overlapping disturbances occurring in rapid succession, e.g., frequent fire, can override site potential, leading to relatively stationary patches of nonforest on forest-capable sites (Coppoletta et al. 2016, Prichard et al. 2017, Coop et al. 2020, McCord et al. 2020).”
BackgroundGibson, R., Danaher, T., Hehir, W., & Collins, L. (2020) · Remote Sensing of Environment · doi:10.1016/j.rse.2020.111702 · Cited by 383
Metadata
- Authors
- Coppoletta, M., Merriam, K. E., & Collins, B. M.
- Affiliations
- US Forest Service (US)
- Corresponding author
- Coppoletta, Michelle
- Venue
- Ecological Applications
- Publisher
- Wiley
- Published
- 2016-04
- Volume
- 26
- Issue
- 3
- Pages
- 686-699
- ISSN
- 1051-0761 (ISSN-L)
- 1939-5582
- OpenAlex
- W1943565020
- Cited by
- 295
- References
- 87
- Citations by year
- 2026: 19 · 2025: 27 · 2024: 28 · 2023: 24 · 2022: 26 · 2021: 37 · 2020: 57 · 2019: 18 · 2018: 26 · 2017: 20 · 2016: 12
- FWCI
- 18.79
- Type
- journal article
- Language
- en
- Open access
- hybrid
- doi.org
- Licence
- Locations
- Ecological Applications (publishedVersion, cc-by-nc-nd)
- PubMed (publishedVersion)
- Funders
- United States Department of Agriculture Forest Service
- Plumas National Forest
- Topics
- Physical Sciences › Environmental Science › Global and Planetary Change › Fire effects on ecosystems
- Physical Sciences › Environmental Science › Ecology › Rangeland and Wildlife Management
- Life Sciences › Agricultural and Biological Sciences › Forestry › Forest Management and Policy
- Keywords
- reburn, fire severity, post-fire vegetation, stand-replacing fire, fire weather, fire behavior, forest management, prescribed burning, thinning, fire regime change, Sierra Nevada, snags, shrubland vegetation, topography
- MeSH terms
- California, Conservation of Natural Resources, Environmental Monitoring, Fires, Plants, Ecosystem, Plant Development, Forests
About these checks
Registry, retraction, Cites and statistics results are computed, not judged, with one exception: a printed reference that no index lists is read once by a model before it counts as a citation error. Claims are extracted by a model and kept only when their quote appears verbatim in the text; each cited source is then checked, with a model’s help, for whether it says what the claim relies on. Those verdicts can be wrong — read the claim’s quote and the cited source before relying on one.
Statistics and arithmetic are recomputed, not judged.
Confidence bands are shown only for fields calibrated on our annotated test set. None is calibrated yet, so no band is shown.
What counts as a claim ›How we measure confidence ›How we check this ›
Are you an author, or do you see a problem with this page? Request a review
How to cite
Cite CoChat for the checks on this page, and the paper for its own findings.
- This page
- CoChat. (2026). Citation check: Post-fire vegetation and fuel development influences fire severity patterns in reburns. https://app.cochat.ai/papers/10.1890/15-0225
- The paper
- Coppoletta, M., Merriam, K. E., & Collins, B. M. (2016). Post-fire vegetation and fuel development influences fire severity patterns in reburns. Ecological Applications. https://doi.org/10.1890/15-0225
Data sources
Bibliographic data: Semantic Scholar, OpenAlex, Crossref.
Contains information from the Semantic Scholar Academic Graph Datasets, made available under the ODC Attribution License (ODC-BY 1.0).
Semantic Scholar’s data is described in: Kinney, R., et al. (2023). The Semantic Scholar Open Data Platform. arXiv:2301.10140.
