PreprintCited by 10Cell death mechanisms and regulationAntimicrobial Peptides and ActivitiesChemical Synthesis and Analysis

The DOI matches its Crossref record; 1 of the 1 references it cites were found in a registry or an index.

Chemokine-derived oncolytic peptide induces immunogenic cancer cell death and significantly suppresses tumor growth

Open access

Preprint — published as 10.1038/s41420-024-01932-5 · Paper page

Abstract

Chemokinostatin-1 (CKS1) is a 24-mer peptide originally discovered as an anti-angiogenic peptide derived from the CXCL1 chemokine. Here, we demonstrate that CKS1 acts not only as an anti-angiogenic peptide but also as an oncolytic peptide due to its structural and physical properties. CKS1 induced both necrotic and apoptotic cell death specifically in cancer cells while showing minimal toxicity in non-cancerous cells. Mechanistically, CKS1 disrupted the cell membrane of cancer cells quickly after treatment and activated the apoptotic pathway at later time points. Furthermore, immunogenic molecules were released from CKS1 treated cells, indicating that CKS1 induces immunogenic cell death. CKS1 effectively suppressed tumor growth in vivo. Collectively, these data demonstrate that CKS1 is a unique peptide that functions both as an anti-angiogenic peptide and as an oncolytic peptide and has a therapeutic potential to treat cancer.

Overview

The claims and statistics of this paper haven’t been checked yet.

Run the check — free, no account needed. It reads the open-access text and checks the sources it cites.

A few free checks a day · papers already verified open instantly · results are public

Integrity signals

Registry

Crossref · 10.21203/rs.3.rs-3335225/v1

Cites

1 of 1 references verified0 citation errors · 0 not checkable

Statistics

Figures

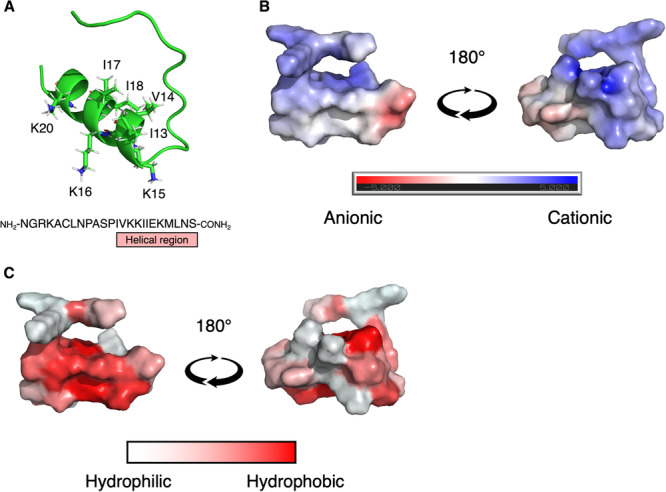
Fig. 1 The structure and physical properties of CKS1. A The structure of CKS1 predicted by AlphaFold 2. B The electrostatic potential of the surface of CKS1 was predicted by the APBS electrostatics plugin in Pymol. Blue regions are the positively charged regions and red regions are the negatively charged regions. C The hydrophobic regions of CKS1 are visualized as red and the hydrophilic regions are visualized as white.
Fig. 1 The structure and physical properties of CKS1. A The structure of CKS1 predicted by AlphaFold 2. B The electrostatic potential of the surface of CKS1 was predicted by the APBS electrostatics plugin in Pymol. Blue regions are the positively charged regions and red regions are the negatively charged regions. C The hydrophobic regions of CKS1 are visualized as red and the hydrophilic regions are visualized as white.CC BY · PubMed Central
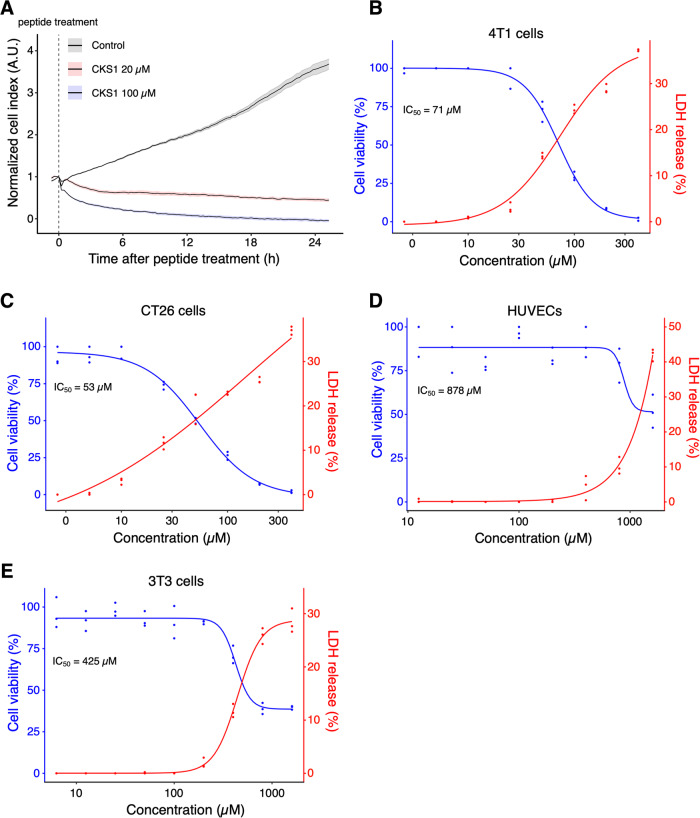
Fig. 2 CKS1 induces rapid cell death in multiple cancer cell lines but not in non-cancerous cell lines. A Cell viability of 4T1 cells after CKS1 treatment was measured by a real-time cell analyzer (RTCA). The vertical, dotted line indicates the time of peptide addition, and solid lines and the shaded areas show the mean and the standard error of the technical replicates, respectively. Representative of N = 3. B–E The cell viability and the release of LDH were measured after the cells were treated with the indicated concentration of CKS1 for 6 h. The blue data points and the red data points show the cell viability and the release of LDH, respectively. The release of LDH in the supernatant was measured by the CyQUANT LDH cytotoxicity assay and was normalized to the amount of LDH released from cells treated with lysis buffer. The curves show the dose-response curves fitted to the observed data. Each data point shows the technical replicate of each experiment. Representative of N = 3 independent experiments.
Fig. 2 CKS1 induces rapid cell death in multiple cancer cell lines but not in non-cancerous cell lines. A Cell viability of 4T1 cells after CKS1 treatment was measured by a real-time cell analyzer (RTCA). The vertical, dotted line indicates the time of peptide addition, and solid lines and the shaded areas show the mean and the standard error of the technical replicates, respectively. Representative of N = 3. B–E The cell viability and the release of LDH were measured after the cells were treated with the indicated concentration of CKS1 for 6 h. The blue data points and the red data points show the cell viability and the release of LDH, respectively. The release of LDH in the supernatant was measured by the CyQUANT LDH cytotoxicity assay and was normalized to the amount of LDH released from cells treated with lysis buffer. The curves show the dose-response curves fitted to the observed data. Each data point shows the technical replicate of each experiment. Representative of N = 3 independent experiments.CC BY · PubMed Central
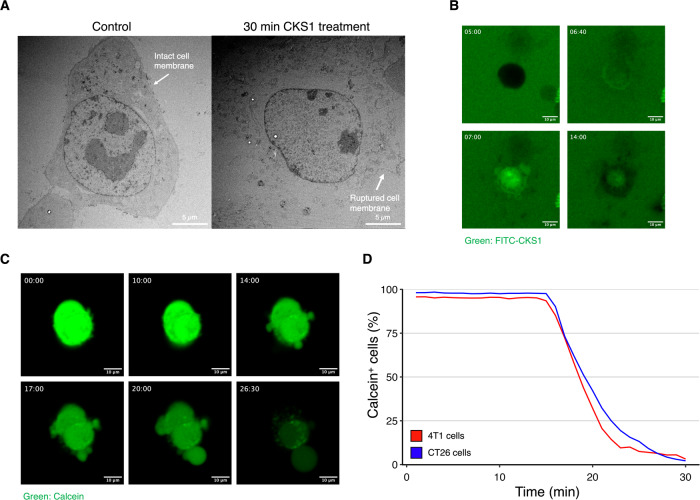
Fig. 3 CKS1 rapidly disrupts the cell membrane of cancer cells. A 4T1 cells were treated with water or 100 µM CKS1 for 30 min and the detailed structure of the cell was observed using transmission electron microscopy. The cell membrane of 4T1 cells was disrupted after 30 min of CKS1-treatment. B 4T1 cells were treated with 100 µM FITC-CKS1 (green) and monitored by fluorescence live cell imaging. The timestamp indicates the minutes after cells were treated with the peptide. Representative of N = 3. C 4T1 cells were stained with calcein-AM (green) and were treated with 100 µM CKS1. The timestamp indicates the minutes after cells were treated with the peptides. D The ratio of cells maintaining calcein in the cytosol at each time point was calculated based on the live cell imaging. Representative of N = 3.
Fig. 3 CKS1 rapidly disrupts the cell membrane of cancer cells. A 4T1 cells were treated with water or 100 µM CKS1 for 30 min and the detailed structure of the cell was observed using transmission electron microscopy. The cell membrane of 4T1 cells was disrupted after 30 min of CKS1-treatment. B 4T1 cells were treated with 100 µM FITC-CKS1 (green) and monitored by fluorescence live cell imaging. The timestamp indicates the minutes after cells were treated with the peptide. Representative of N = 3. C 4T1 cells were stained with calcein-AM (green) and were treated with 100 µM CKS1. The timestamp indicates the minutes after cells were treated with the peptides. D The ratio of cells maintaining calcein in the cytosol at each time point was calculated based on the live cell imaging. Representative of N = 3.CC BY · PubMed Central
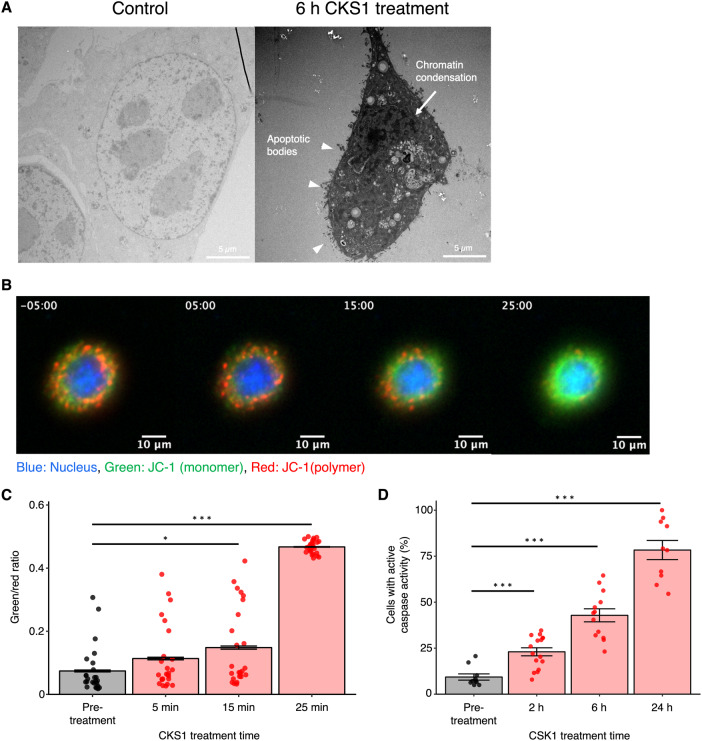
Fig. 4 CKS1 diminishes mitochondrial membrane potential and activates the apoptotic pathway. A 4T1 cells were treated with water or 100 µM CKS1 for 6 h and the detailed structure of the cell was observed using transmission electron microscopy. Overall shrinkage of the cell, collapse of the nucleus, chromatin condensation (arrow), and apoptotic blebbing (triangle) indicate that the cells underwent apoptosis. B Fluorescence live cell imaging of 4T1 cells stained with JC-1 and treated with 100 µM CKS1. The timestamp indicates the minutes after CKS1 treatment (negative value indicates pre-treatment). Green indicates the monomer form of JC-1, and red indicates the polymer form of JC-1. C Twenty-five cells were randomly selected from the video of figure A (supplemental video 5) and the ratio between the green intensity and the red intensity was calculated. Means ± SEM, representative of N = 3 independent experiments, Dunnett’s test (*p < 0.05, ***p < 0.005). D At least ten fields of view were acquired for each time point and the fraction of cells with red intensity in the nucleus (cells with active caspase activity) was calculated. Means ± SEM, representative of N = 3 independent experiments, Dunnett’s test (*p < 0.05, ***p < 0.005).
Fig. 4 CKS1 diminishes mitochondrial membrane potential and activates the apoptotic pathway. A 4T1 cells were treated with water or 100 µM CKS1 for 6 h and the detailed structure of the cell was observed using transmission electron microscopy. Overall shrinkage of the cell, collapse of the nucleus, chromatin condensation (arrow), and apoptotic blebbing (triangle) indicate that the cells underwent apoptosis. B Fluorescence live cell imaging of 4T1 cells stained with JC-1 and treated with 100 µM CKS1. The timestamp indicates the minutes after CKS1 treatment (negative value indicates pre-treatment). Green indicates the monomer form of JC-1, and red indicates the polymer form of JC-1. C Twenty-five cells were randomly selected from the video of figure A (supplemental video 5) and the ratio between the green intensity and the red intensity was calculated. Means ± SEM, representative of N = 3 independent experiments, Dunnett’s test (*p < 0.05, ***p < 0.005). D At least ten fields of view were acquired for each time point and the fraction of cells with red intensity in the nucleus (cells with active caspase activity) was calculated. Means ± SEM, representative of N = 3 independent experiments, Dunnett’s test (*p < 0.05, ***p < 0.005).CC BY · PubMed Central
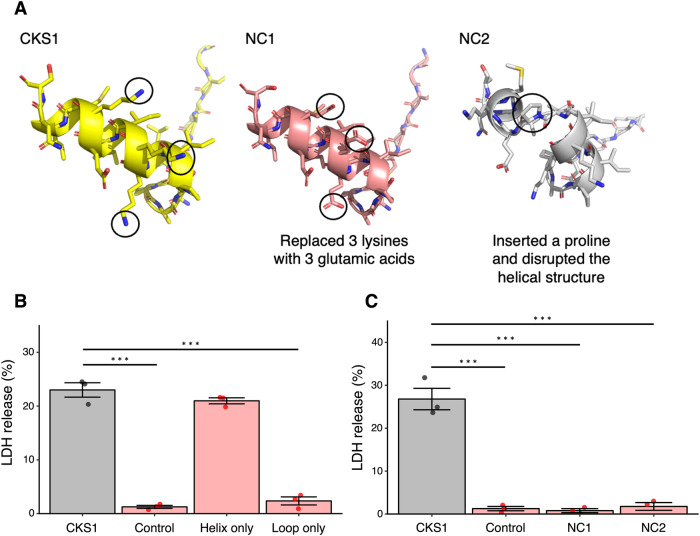
Fig. 5 The cationic helical structure of CKS1 is important for its activity. A The structure of CKS1, NC1, and NC2. B, C The release of LDH in the supernatant was measured after treating 4T1 cells with 100 µM of the indicated peptides for 6 h. Data were normalized to cells treated with lysis buffer. Means ± SEM, N = 3, Dunnett’s test (***p < 0.005).
Fig. 5 The cationic helical structure of CKS1 is important for its activity. A The structure of CKS1, NC1, and NC2. B, C The release of LDH in the supernatant was measured after treating 4T1 cells with 100 µM of the indicated peptides for 6 h. Data were normalized to cells treated with lysis buffer. Means ± SEM, N = 3, Dunnett’s test (***p < 0.005).CC BY · PubMed Central
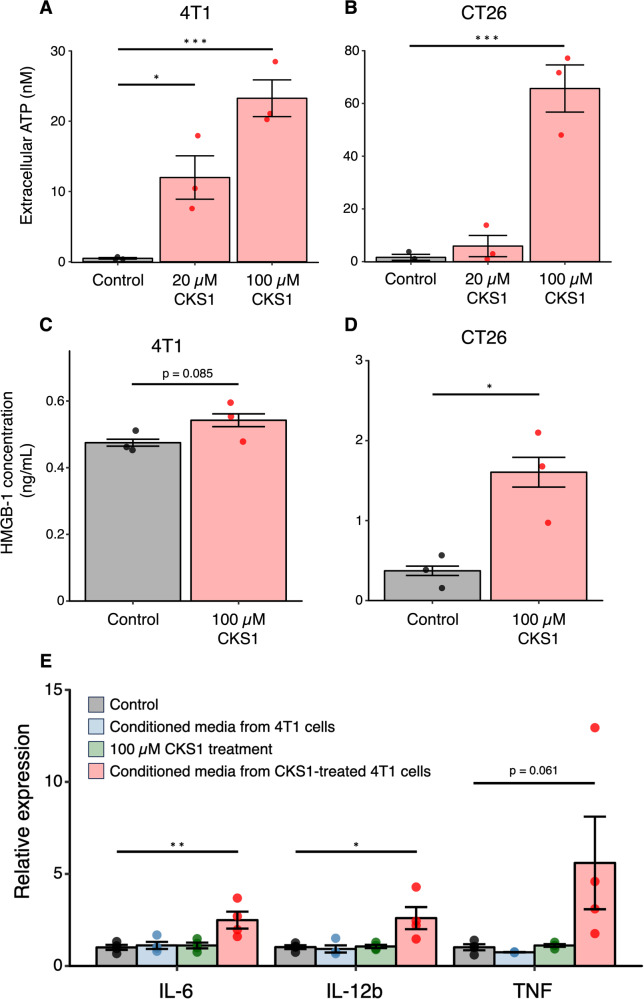
Fig. 6 CKS1 induces the release of immunogenic molecules. A, B Cells were treated with 20 µM or 100 µM CKS1 for 30 min and the amount of ATP released in the culture media was quantified. Means ± SEM, N = 3, Dunnet’s test (*p < 0.05, ***p < 0.005). C, D Cells were treated with 100 µM CKS1 for 6 h and the amount of HMGB-1 released in the culture media was quantified. Means ± SEM, N = 3, Welch’s t-test (*p < 0.05). E DC2.4 cells were treated with either complete media (control), conditioned media from 4T1 cells, 100 µM CKS1, or conditioned media from 4T1 cells treated with 100 µM CKS1. The relative expression level normalized to the expression level in the control condition is shown. Means ± SEM, N = 4, Dunnet’s test (*p < 0.05, **p < 0.01).
Fig. 6 CKS1 induces the release of immunogenic molecules. A, B Cells were treated with 20 µM or 100 µM CKS1 for 30 min and the amount of ATP released in the culture media was quantified. Means ± SEM, N = 3, Dunnet’s test (*p < 0.05, ***p < 0.005). C, D Cells were treated with 100 µM CKS1 for 6 h and the amount of HMGB-1 released in the culture media was quantified. Means ± SEM, N = 3, Welch’s t-test (*p < 0.05). E DC2.4 cells were treated with either complete media (control), conditioned media from 4T1 cells, 100 µM CKS1, or conditioned media from 4T1 cells treated with 100 µM CKS1. The relative expression level normalized to the expression level in the control condition is shown. Means ± SEM, N = 4, Dunnet’s test (*p < 0.05, **p < 0.01).CC BY · PubMed Central
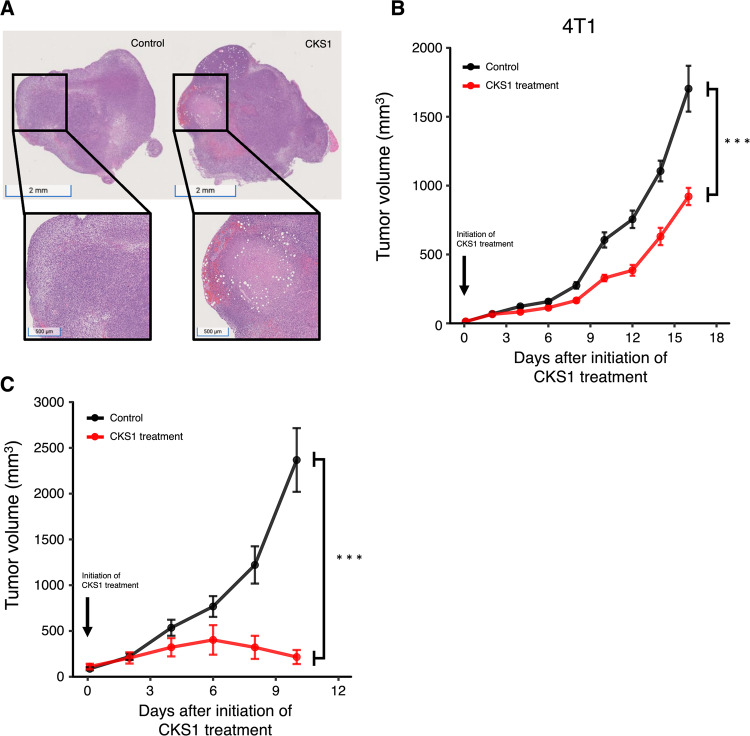
Fig. 7 CKS1 induces necrosis and suppresses tumor growth in vivo. A CKS1 was injected intratumorally in established 4T1 tumors. After 24 h, tumors were excised and were stained with H&E stain. The white area indicates necrosis caused by CKS1. Representative of N = 3. B, C The tumor volume of 4T1 tumors and CT26 tumors were recorded. Fourty milligram/kg CKS1 was applied daily starting on day 7. Means ± SEM, 4T1 control N = 15, 4T1 CKS1 treatment N = 15, CT26 control N = 10, CT26 CKS1 treatment N = 10. Two-way repeated-measures ANOVA was performed to determine the significance of CKS1 treatment (***p < 0.005).
Fig. 7 CKS1 induces necrosis and suppresses tumor growth in vivo. A CKS1 was injected intratumorally in established 4T1 tumors. After 24 h, tumors were excised and were stained with H&E stain. The white area indicates necrosis caused by CKS1. Representative of N = 3. B, C The tumor volume of 4T1 tumors and CT26 tumors were recorded. Fourty milligram/kg CKS1 was applied daily starting on day 7. Means ± SEM, 4T1 control N = 15, 4T1 CKS1 treatment N = 15, CT26 control N = 10, CT26 CKS1 treatment N = 10. Two-way repeated-measures ANOVA was performed to determine the significance of CKS1 treatment (***p < 0.005).CC BY · PubMed Central

Verification

Claims the paper makes

The claims and statistics of this paper haven’t been checked yet.

Run the check — free, no account needed. It reads the open-access text and checks the sources it cites.

A few free checks a day · papers already verified open instantly · results are public

Self-check

Percentages, sums and reported differences re-computed from the paper’s own numbers.

The self-check needs the paper’s full text.

Citations

Cites

Research works printed but not linked: 30

  1. Wu Q, Qian W, Sun X, Jiang S. Small-molecule inhibitors, immune checkpoint inhibitors, and more: FDA-approved novel therapeutic drugs for solid tumors from 1991 to 2021. J Hematol Oncol. 2022;15:143 · DOI
  2. Chames P, Van Regenmortel M, Weiss E, Baty D. Therapeutic antibodies: Successes, limitations and hopes for the future. Br J Pharmacol. 2009;157:220–33 · DOI · Paper page
  3. Furukawa N, Popel AS. Peptides that immunoactivate the tumor microenvironment. Biochimica et Biophysica Acta (BBA) - Reviews on Cancer. 2021;1875:188486
  4. Rosca E v., Koskimaki JE, Rivera CG, Pandey NB, Tamiz AP, Popel AS. Anti-Angiogenic Peptides for Cancer Therapeutics. Curr Pharm Biotechnol. 2011;12:1101–16 · DOI
  5. Karagiannis ED, Popel AS. A systematic methodology for proteome-wide identification of peptides inhibiting the proliferation and migration of endothelial cells. Proc Natl Acad Sci U S A. 2008;105:13775–80 · DOI
  6. Karagiannis ED, Popel AS. Novel anti-angiogenic peptides derived from ELR-containing CXC chemokines. J Cell Biochem. 2008;104:1356–63 · DOI
  7. Koskimaki JE, Karagiannis ED, Rosca E V., Vesuna F, Winnard PT, Raman V, et al. Peptides derived from type IV collagen, CXC chemokines, and thrombospondin-1 domain-containing proteins inhibit neovascularization and suppress tumor growth in MDA-MB-231 breast cancer xenografts. Neoplasia. 2009;11:1285–91 · DOI
  8. Rosca EV, Lal B, Koskimaki JE, Popel AS, Laterra J. Collagen IV and CXC chemokine-derived antiangiogenic peptides suppress glioma xenograft growth. Anticancer Drugs. 2012;23:706–12 · DOI
  9. Yang QZ, Wang C, Lang L, Zhou Y, Wang H, Shang DJ. Design of potent, non-toxic anticancer peptides based on the structure of the antimicrobial peptide, temporin-1CEa. Arch Pharm Res. 2013;36:1302–10 · DOI
  10. Lin L, Chi J, Yan Y, Luo R, Feng X, Zheng Y, et al. Membrane-disruptive peptides/peptidomimetics-based therapeutics: Promising systems to combat bacteria and cancer in the drug-resistant era. Acta Pharm Sin B. 2021;11:2609–44 · DOI
  11. Marquardt D, Geier B, Pabst G. Asymmetric lipid membranes: Towards more realistic model systems. Membranes (Basel). 2015;5:180–96 · DOI
  12. Alves AC, Ribeiro D, Nunes C, Reis S. Biophysics in cancer: The relevance of drug-membrane interaction studies. Biochim Biophys Acta Biomembr. 2016;1858:2231–44 · DOI
  13. Chen B, Le W, Wang Y, Li Z, Wang D, Lin L, et al. Targeting Negative Surface Charges of Cancer Cells by Multifunctional Nanoprobes. Theranostics. 2016;6:1887–98 · DOI
  14. Chiangjong W, Chutipongtanate S, Hongeng S. Anticancer peptide: Physicochemical property, functional aspect and trend in clinical application (Review). Int J Oncol. 2020;57:678–96 · DOI
  15. Iwasaki T, Ishibashi J, Tanaka H, Sato M, Asaoka A, Taylor DM, et al. Selective cancer cell cytotoxicity of enantiomeric 9-mer peptides derived from beetle defensins depends on negatively charged phosphatidylserine on the cell surface. Peptides (NY). 2009;30:660–8 · DOI
  16. Zhou H, Forveille S, Sauvat A, Sica V, Izzo V, Durand S, et al. The oncolytic peptide LTX-315 kills cancer cells through Bax/Bak-regulated mitochondrial membrane permeabilization. Oncotarget. 2015;6:26599–614 · DOI
  17. Eike LM, Yang N, Rekdal O, Sveinbjornsson B. The oncolytic peptide LTX-315 induces cell death and DAMP release by mitochondria distortion in human melanoma cells. Oncotarget. 2015;6:34910–23 · DOI
  18. Zhou H, Sauvat A, Gomes-Da-Silva LC, Durand S, Forveille S, Iribarren K, et al. The oncolytic compound LTX-401 targets the Golgi apparatus. Cell Death Differ. 2016;23:2031–41 · DOI
  19. Wodlej C, Riedl S, Rinner B, Leber R, Drechsler C, Voelker DR, et al. Interaction of two antitumor peptides with membrane lipids - Influence of phosphatidylserine and cholesterol on specificity for melanoma cells. Vol. 14, PLoS ONE. 2019. 1–37 p. · DOI
  20. Zhou H, Forveille S, Sauvat A, Yamazaki T, Senovilla L, Ma Y, et al. The oncolytic peptide LTX-315 triggers immunogenic cell death. Cell Death Dis. 2016;7:1–11 · DOI
  21. Xie W, Mondragón L, Mauseth B, Wang Y, Pol J, Lévesque S, et al. Tumor lysis with LTX-401 creates anticancer immunity. Oncoimmunology. 2019;8:1–8
  22. Pasquereau-Kotula E, Habault J, Kroemer G, Poyet JL. The anticancer peptide RT53 induces immunogenic cell death. PLoS One. 2018;13:1–17 · DOI
  23. Yamazaki T, Pitt JM, Vétizou M, Marabelle A, Flores C, Rekdal, et al. The oncolytic peptide LTX-315 overcomes resistance of cancers to immunotherapy with CTLA4 checkpoint blockade. Cell Death Differ. 2016;23:1004–15 · DOI
  24. Spicer J, Marabelle A, Baurain JF, Jebsen NL, Jøssang DE, Awada A, et al. Safety, antitumor activity, and T-cell responses in a dose-ranging phase I trial of the oncolytic peptide LTX-315 in patients with solid tumors. Clinical Cancer Research. 2021;27:2755–63 · DOI
  25. Galluzzi L, Buqué A, Kepp O, Zitvogel L, Kroemer G. Immunogenic cell death in cancer and infectious disease. Nat Rev Immunol. 2017;17:97–111 · DOI · Paper page
  26. Martins I, Wang Y, Michaud M, Ma Y, Sukkurwala AQ, Shen S, et al. Molecular mechanisms of ATP secretion during immunogenic cell death. Cell Death Differ. 2014;21:79–91 · DOI · Paper page
  27. Zhou H, Forveille S, Sauvat A, Yamazaki T, Senovilla L, Ma Y, et al. The oncolytic peptide LTX-315 triggers immunogenic cell death. Cell Death Dis. 2016;7:1–11 · DOI
  28. Huang Y, Goel S, Duda DG, Fukumura D, Jain RK. Vascular normalization as an emerging strategy to enhance cancer immunotherapy. Cancer Res. 2013;73:2943–8 · DOI · Paper page
  29. Spicer JF, Marabelle A, Baurain JF, Awada A, Kristeleit RS, Jossang DE, et al. A phase I/II study of the oncolytic peptide LTX-315 combined with checkpoint inhibition generates de novo T-cell responses and clinical benefit in patients with advanced solid tumors. Journal of Clinical Oncology. 2018;36:3094–3094 · DOI
  30. Yuan J, Khilnani A, Brody J, Andtbacka RHI, Hu-Lieskovan S, Luke JJ, et al. Current strategies for intratumoural immunotherapy – Beyond immune checkpoint inhibition. Eur J Cancer. 2021;157:493–510 · DOI

Metadata

Authors
Furukawa, N., Yang, W., Chao, A., Patil, A., Mirando, A., Pandey, N., & Popel, A.
Affiliations
Johns Hopkins University (US)
Corresponding author
Furukawa, Natsuki
Venue
Cell Death Discovery
Published
2023-10-03
Volume
10
Issue
1
Pages
161-161
ISSN
2058-7716 (ISSN-L)
OpenAlex
W4393396983
Cited by
10
References
1
Citations by year
2026: 4 · 2025: 4 · 2024: 2
FWCI
1.36
Type
journal article
Language
en
Open access
Locations
  • Cell Death Discovery (publishedVersion, cc-by)
  • Research Square (acceptedVersion, cc-by)
  • PubMed Central (publishedVersion, cc-by)
  • PubMed (publishedVersion)
  • PubMed Central (submittedVersion, cc-by)
  • DOAJ (DOAJ: Directory of Open Access Journals) (submittedVersion, cc-by-sa)
Funders
  • U.S. Department of Health and Human Services (P30CA006973, R01 CA138264, S10OD016374)
  • Johns Hopkins University (P30CA006973)
  • National Institutes of Health (1s10od016374-01, CA006973)
  • National Cancer Institute (R01CA138264, P30CA006973)
Topics
  • Life Sciences › Biochemistry, Genetics and Molecular Biology › Molecular Biology › Cell death mechanisms and regulation
  • Life Sciences › Immunology and Microbiology › Microbiology › Antimicrobial Peptides and Activities
  • Physical Sciences › Chemistry › Organic Chemistry › Chemical Synthesis and Analysis
Keywords
oncolytic peptide, immunogenic cell death, anti-angiogenic peptides, apoptosis, necrosis, cell membrane damage, tumor growth inhibition, cancer therapy

About these checks

Registry, retraction, Cites and statistics results are computed, not judged, with one exception: a printed reference that no index lists is read once by a model before it counts as a citation error. Claims are extracted by a model and kept only when their quote appears verbatim in the text; each cited source is then checked, with a model’s help, for whether it says what the claim relies on. Those verdicts can be wrong — read the claim’s quote and the cited source before relying on one.

Statistics and arithmetic are recomputed, not judged.

Confidence bands are shown only for fields calibrated on our annotated test set. None is calibrated yet, so no band is shown.

What counts as a claim ›How we measure confidence ›How we check this ›

Are you an author, or do you see a problem with this page? Request a review