PreprintCited by 5Neurogenesis and neuroplasticity mechanismsLaser Applications in Dentistry and MedicineOptical Imaging and Spectroscopy Techniques

The DOI matches its Crossref record; 1 of the 1 references it cites were found in a registry or an index.

Near-Infrared Light Induces Neurogenesis and Modulates Anxiety-like Behavior

Open access

Preprint — published as 10.1186/s13287-024-04114-3 · Paper page

Abstract

Background The hippocampus is associated with mood disorders, and the activation of quiescent neurogenesis has been linked to anxiolytic effects. Near-infrared (NIR) light has shown potential to improve learning and memory in human and animal models. Despite the vast amount of information regarding the effect of visible light, there is a significant gap in our understanding of the response of neural stem cells (NSCs) to NIR stimulation, particularly in anxiety-like behavior. The present study aimed to develop a new optical manipulation approach to stimulate hippocampal neurogenesis and understand the mechanisms underlying its anxiolytic effects. Methods We used 940 nm NIR (40 Hz) light exposure to stimulate hippocampal stem cells in C57BL/6 mice. The enhanced proliferation and astrocyte differentiation of NIR-treated NSCs were assessed using 5-Ethynyl-2’-deoxyuridine (EdU) incorporation and immunofluorescence assays. Additionally, we evaluated calcium activity of NIR light-treated astrocytes using GCaMP6f recording through fluorescence fiber photometry. The effects of NIR illumination of the hippocampus on anxiety-like behaviors were evaluated using elevated plus maze and open-field test. Results In vitro, the NIR light effectively promoted the NSC proliferation and astrocyte differentiation via the Opn4 photoreceptor. In vivo, the NIR stimulation significantly enhanced neurogenesis and calcium-dependent astrocytic activity. Moreover, activating hippocampal astrocytes with 40-Hz NIR light substantially improved anxiety-like behaviors in mice. Conclusions We found that flickering NIR (940 nm/40Hz) light illumination improved neurogenesis in the hippocampus with anxiolytic effects. This innovative approach holds promise as a novel preventive treatment for depression.

Overview

The claims and statistics of this paper haven’t been checked yet.

Run the check — free, no account needed. It reads the open-access text and checks the sources it cites.

A few free checks a day · papers already verified open instantly · results are public

Integrity signals

Registry

Crossref · 10.21203/rs.3.rs-3918262/v1

Cites

1 of 1 references verified0 citation errors · 0 not checkable

Statistics

Figures

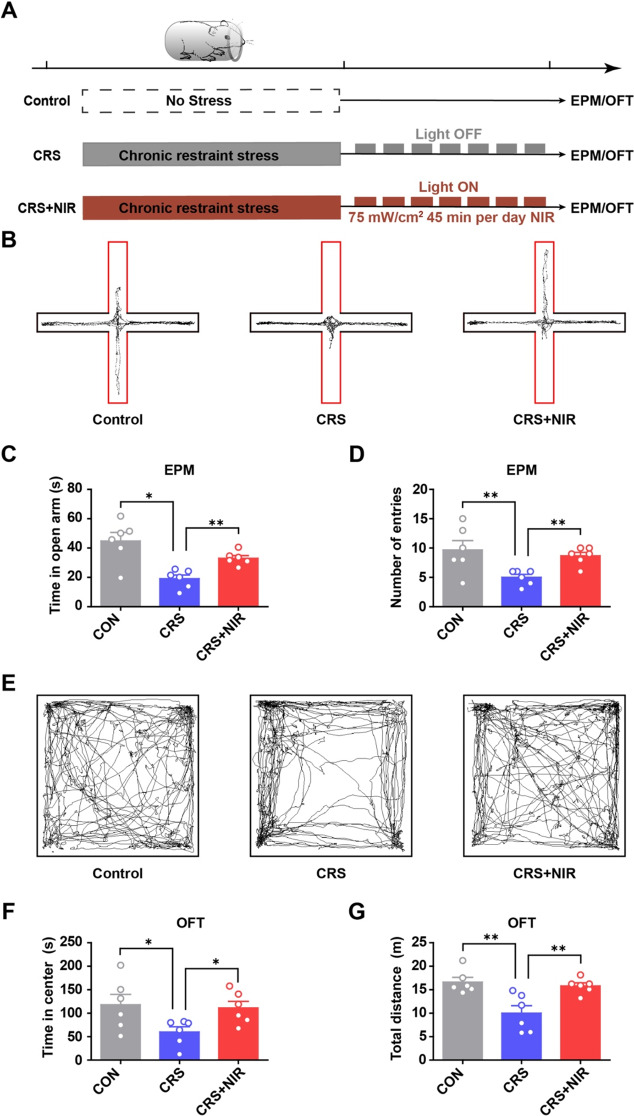
Fig. 1 Behavioral test of CRS mice under NIR illumination. (A) Experimental scheme outlining the indicated treatments and behavioral experiments conducted. (B-D) Results of EPM (CON: n = 6; CRS: n = 6; CRS + NIR: n = 6. Values represent mean ± SEM, *p < 0.05 and **p < 0.01. (B) Representative locomotion trajectories of mice in the EPM. (C) Time spent by mice in the open arm of EPM. (D) Number of mice entering the open-arm in the EPM. (E-G) Results of OFT (CON: n = 6; CRS: n = 6; CRS + NIR: n = 6). Values represent mean ± SEM, *p < 0.05 and **p < 0.01. (E) Representative locomotion trajectories of mice in the OFT. (F) Time spent by mice in the central area of OFT. (G) Distance travelled by mice in the OFT
Fig. 1 Behavioral test of CRS mice under NIR illumination. (A) Experimental scheme outlining the indicated treatments and behavioral experiments conducted. (B-D) Results of EPM (CON: n = 6; CRS: n = 6; CRS + NIR: n = 6. Values represent mean ± SEM, *p < 0.05 and **p < 0.01. (B) Representative locomotion trajectories of mice in the EPM. (C) Time spent by mice in the open arm of EPM. (D) Number of mice entering the open-arm in the EPM. (E-G) Results of OFT (CON: n = 6; CRS: n = 6; CRS + NIR: n = 6). Values represent mean ± SEM, *p < 0.05 and **p < 0.01. (E) Representative locomotion trajectories of mice in the OFT. (F) Time spent by mice in the central area of OFT. (G) Distance travelled by mice in the OFTCC BY-NC-ND · PubMed Central
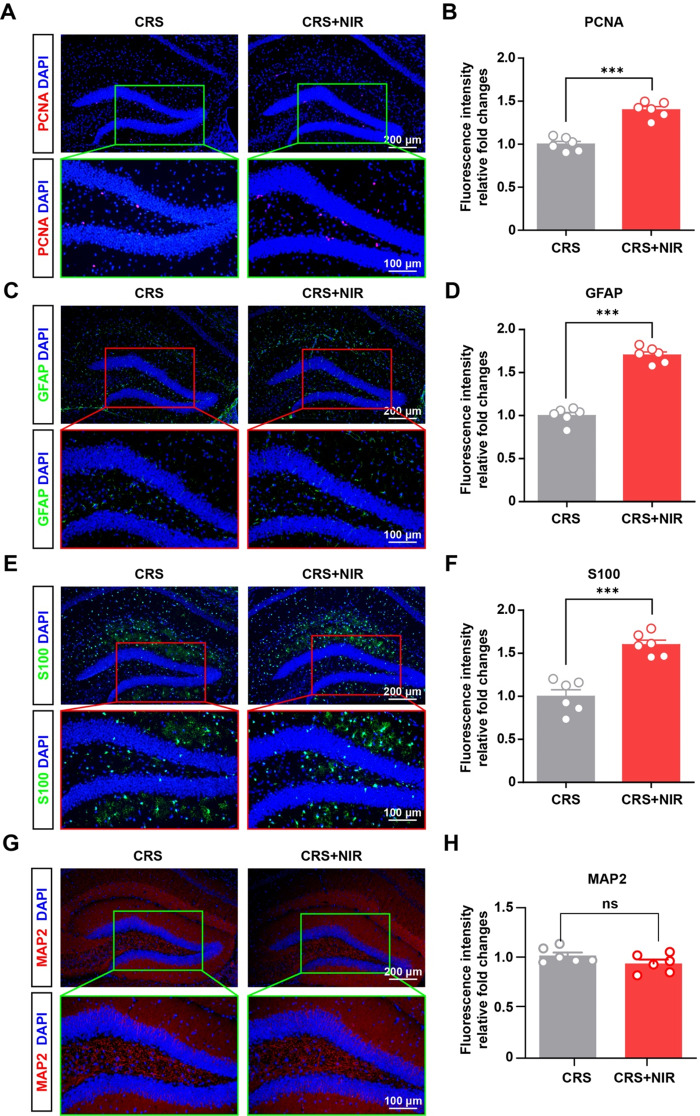
Fig. 2 Glial expression in the hippocampus of CRS mice after NIR treatment. (A) Representative image of immunohistochemical staining for PCNA in the non-stimulated and stimulated DG regions of CRS mice. (B) Relative intensity value of fluorescence after homogenization (CRS: n = 3; CRS + NIR: n = 3; two slices per mice). (C) Representative images of immunofluorescence staining of GFAP in the non-stimulated and stimulated DG regions of CRS mice. (D) Relative intensity value of fluorescence after homogenization (CRS: n = 3; CRS + NIR: n = 3; two slices per mice). (E) Representative image of immunohistochemical staining for S100 in the non-stimulated and stimulated DG regions of CRS mice. (F) Relative intensity value of fluorescence after homogenization (CRS: n = 3; CRS + NIR: n = 3; two slices per mice).Values represent mean ± SEM, ***p < 0.001. (G) Representative image of immunohistochemical staining for MAP2 in the non-stimulated and stimulated SGZ regions of CRS mice. (H) Relative intensity value of fluorescence after homogenization (CRS: n = 3; CRS + NIR: n = 3; two slices per mice).Values represent mean ± SEM, ***p < 0.001
Fig. 2 Glial expression in the hippocampus of CRS mice after NIR treatment. (A) Representative image of immunohistochemical staining for PCNA in the non-stimulated and stimulated DG regions of CRS mice. (B) Relative intensity value of fluorescence after homogenization (CRS: n = 3; CRS + NIR: n = 3; two slices per mice). (C) Representative images of immunofluorescence staining of GFAP in the non-stimulated and stimulated DG regions of CRS mice. (D) Relative intensity value of fluorescence after homogenization (CRS: n = 3; CRS + NIR: n = 3; two slices per mice). (E) Representative image of immunohistochemical staining for S100 in the non-stimulated and stimulated DG regions of CRS mice. (F) Relative intensity value of fluorescence after homogenization (CRS: n = 3; CRS + NIR: n = 3; two slices per mice).Values represent mean ± SEM, ***p < 0.001. (G) Representative image of immunohistochemical staining for MAP2 in the non-stimulated and stimulated SGZ regions of CRS mice. (H) Relative intensity value of fluorescence after homogenization (CRS: n = 3; CRS + NIR: n = 3; two slices per mice).Values represent mean ± SEM, ***p < 0.001CC BY-NC-ND · PubMed Central
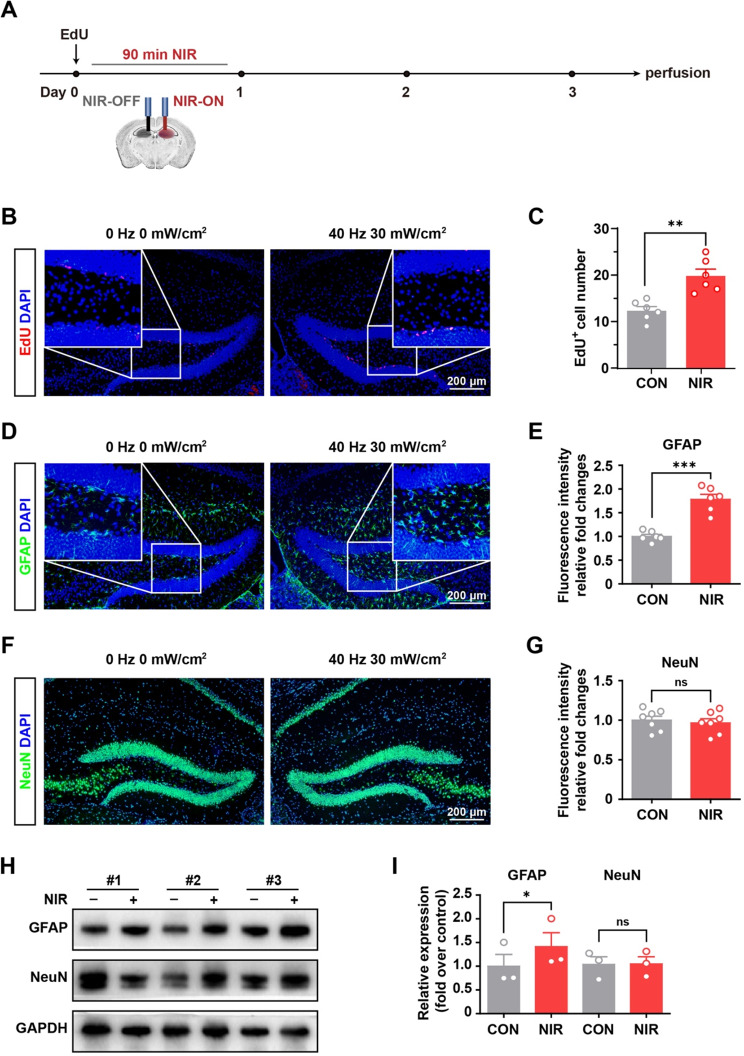
Fig. 3 NIR stimulated hippocampal neurogenesis in vivo by nongenetic stimulation. (A) Schematic flowchart of nongenetic NIR stimulation experiment. (B) Immunofluorescence staining of EdU incorporation assay of NSCs in DG under NIR exposure. (C) Statistical analysis of EdU positive cells using Image-J software (n = 6 slices/3 mice/group, the left DG with only the optical fiber was used as a control after light stimulation for each animal) (D) Representative images of immunofluorescence staining of GFAP in the non-stimulated and stimulated DG regions as described in the experimental procedures. (E) Statistical analysis of immunosignals using Image-J software (n = 6 mice per group, the left DG with only the optical fiber was used as a control after light stimulation for each animal). (F) Representative images of immunofluorescence staining of NeuN in the non-stimulated and stimulated DG regions as described in the experimental procedures. (G) Statistical analysis of immunosignals using Image-J software (n = 7 mice per group, the left DG with only the optical fiber was used as a control after light stimulation for each animal).Values are presented as mean ± SEM. Values are presented as mean ± SEM. **p < 0.01, ***p < 0.001. (H) Equivalent amounts (30 µg) of tissue lysates were separated by SDS-PAGE and analyzed by immunoblotting with antibodies specific for the indicated proteins. GAPDH was used as a loading control (n = 3 mice per group, the left SGZ with only the optical fiber was used as a control after light stimulation for each animal). (I) Statistical analysis of immunosignals. Values are presented as mean ± SEM. *p < 0.05
Fig. 3 NIR stimulated hippocampal neurogenesis in vivo by nongenetic stimulation. (A) Schematic flowchart of nongenetic NIR stimulation experiment. (B) Immunofluorescence staining of EdU incorporation assay of NSCs in DG under NIR exposure. (C) Statistical analysis of EdU positive cells using Image-J software (n = 6 slices/3 mice/group, the left DG with only the optical fiber was used as a control after light stimulation for each animal) (D) Representative images of immunofluorescence staining of GFAP in the non-stimulated and stimulated DG regions as described in the experimental procedures. (E) Statistical analysis of immunosignals using Image-J software (n = 6 mice per group, the left DG with only the optical fiber was used as a control after light stimulation for each animal). (F) Representative images of immunofluorescence staining of NeuN in the non-stimulated and stimulated DG regions as described in the experimental procedures. (G) Statistical analysis of immunosignals using Image-J software (n = 7 mice per group, the left DG with only the optical fiber was used as a control after light stimulation for each animal).Values are presented as mean ± SEM. Values are presented as mean ± SEM. **p < 0.01, ***p < 0.001. (H) Equivalent amounts (30 µg) of tissue lysates were separated by SDS-PAGE and analyzed by immunoblotting with antibodies specific for the indicated proteins. GAPDH was used as a loading control (n = 3 mice per group, the left SGZ with only the optical fiber was used as a control after light stimulation for each animal). (I) Statistical analysis of immunosignals. Values are presented as mean ± SEM. *p < 0.05CC BY-NC-ND · PubMed Central
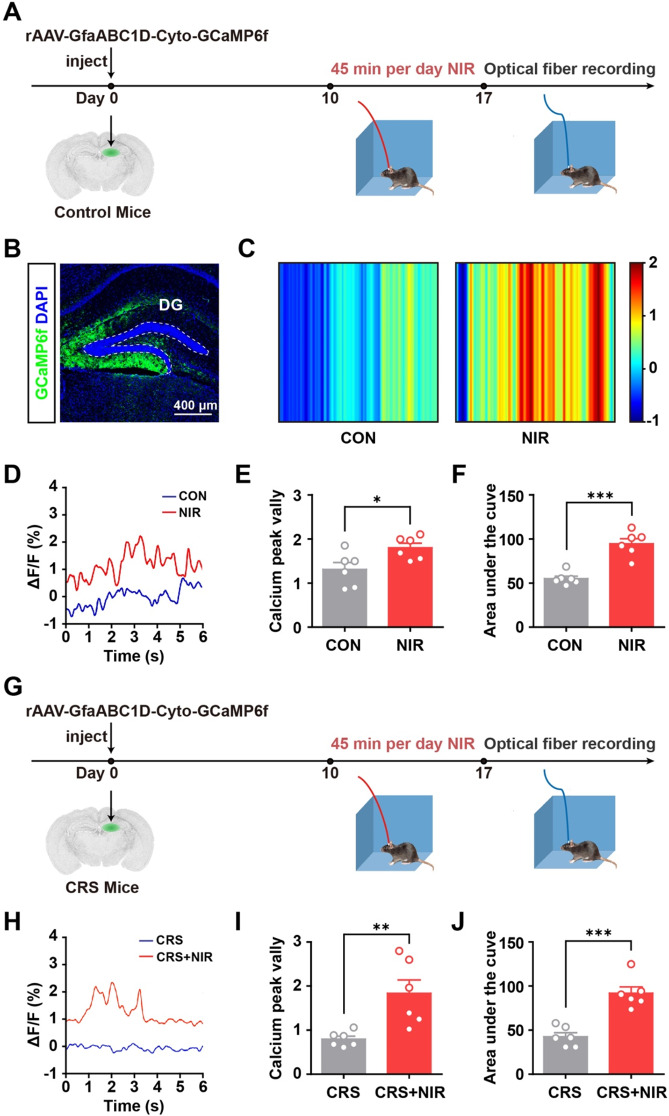
Fig. 4 In vivo calcium recordings in awake mice using optical fiber photometry. (A) Experimental protocol for calcium signal recording with optical fiber photometry in C57BL/6 mice. (B) Immunofluorescence image showing GCaMP6f expressed astrocytes in the DG. (C) Color plot depicting DG Ca2+ activity in the non-stimulated and stimulated mice. (D) Sample ΔF/F of GCaMP6f signals from the DG in non-stimulated and stimulated mice. (E) Bar graphs illustrating the peak valley of calcium signal in non-stimulated and stimulated mice DG regions as described in the experimental procedures (n = 6 mice per group). (F) Bar graphs showing the integration under the curve of calcium signal in non-stimulated and stimulated mice DG regions as described in the experimental procedures (n = 6 mice per group). (G) Experimental protocol for calcium signal recording with optical fiber photometry in CRS mice. (H) Sample ΔF/F of GCaMP6f signals from the DG in non-stimulated and stimulated CRS mice. (I) Bar graphs illustrating the peak valley of calcium signal in non-stimulated and stimulated CRS mice DG regions as described in the experimental procedures (n = 6 mice per group). (F) Bar graphs showing the integration under the curve of calcium signal in non-stimulated and stimulated CRS mice DG regions as described in the experimental procedures (n = 6 mice per group). Values are presented as mean ± SEM, *p < 0.05, **p < 0.01, ***p < 0.001
Fig. 4 In vivo calcium recordings in awake mice using optical fiber photometry. (A) Experimental protocol for calcium signal recording with optical fiber photometry in C57BL/6 mice. (B) Immunofluorescence image showing GCaMP6f expressed astrocytes in the DG. (C) Color plot depicting DG Ca2+ activity in the non-stimulated and stimulated mice. (D) Sample ΔF/F of GCaMP6f signals from the DG in non-stimulated and stimulated mice. (E) Bar graphs illustrating the peak valley of calcium signal in non-stimulated and stimulated mice DG regions as described in the experimental procedures (n = 6 mice per group). (F) Bar graphs showing the integration under the curve of calcium signal in non-stimulated and stimulated mice DG regions as described in the experimental procedures (n = 6 mice per group). (G) Experimental protocol for calcium signal recording with optical fiber photometry in CRS mice. (H) Sample ΔF/F of GCaMP6f signals from the DG in non-stimulated and stimulated CRS mice. (I) Bar graphs illustrating the peak valley of calcium signal in non-stimulated and stimulated CRS mice DG regions as described in the experimental procedures (n = 6 mice per group). (F) Bar graphs showing the integration under the curve of calcium signal in non-stimulated and stimulated CRS mice DG regions as described in the experimental procedures (n = 6 mice per group). Values are presented as mean ± SEM, *p < 0.05, **p < 0.01, ***p < 0.001CC BY-NC-ND · PubMed Central
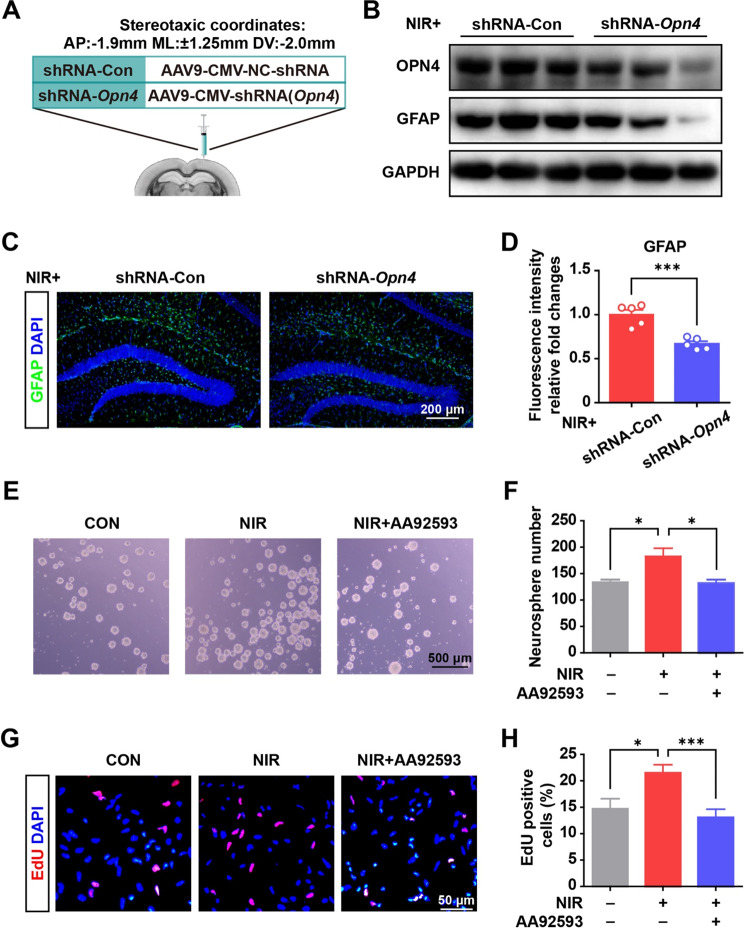
Fig. 5 NIR irradiation promoted NSC proliferation and astrocyte differentiation (A) Scheme of the experimental design. (B) shRNA-Opn4 injection down-regulated OPN4 and GFAP expression in the hippocampus of mice with NIR irradiation. (C) Immunofluorescence staining for GFAP in the control and shRNA-Opn4 group with NIR irradiation. (D) Quantitative data from immunofluorescence staining (5 slices from 3 mice for each group). Values are presented as mean ± SEM, ***p < 0.001. (E) Representative micrographs of NSC sphere formation after NIR irradiation and Opn4 inhibitor (AA92593) treatment. (F) Quantitative data from NSC sphere counts with the indicated treatment. The results from four repeat wells of a 24-well plate. Values are given as mean ± SEM. *p < 0.05. (G) Photographs of the EdU incorporation assay of NSCs under NIR exposure. (H) Quantitative data from NSC proliferation under illumination across 12–13 randomly selected view fields of the tested samples using ImageJ software. Values are given as mean ± SEM. *P < 0.05, and ***P < 0.001
Fig. 5 NIR irradiation promoted NSC proliferation and astrocyte differentiation (A) Scheme of the experimental design. (B) shRNA-Opn4 injection down-regulated OPN4 and GFAP expression in the hippocampus of mice with NIR irradiation. (C) Immunofluorescence staining for GFAP in the control and shRNA-Opn4 group with NIR irradiation. (D) Quantitative data from immunofluorescence staining (5 slices from 3 mice for each group). Values are presented as mean ± SEM, ***p < 0.001. (E) Representative micrographs of NSC sphere formation after NIR irradiation and Opn4 inhibitor (AA92593) treatment. (F) Quantitative data from NSC sphere counts with the indicated treatment. The results from four repeat wells of a 24-well plate. Values are given as mean ± SEM. *p < 0.05. (G) Photographs of the EdU incorporation assay of NSCs under NIR exposure. (H) Quantitative data from NSC proliferation under illumination across 12–13 randomly selected view fields of the tested samples using ImageJ software. Values are given as mean ± SEM. *P < 0.05, and ***P < 0.001CC BY-NC-ND · PubMed Central
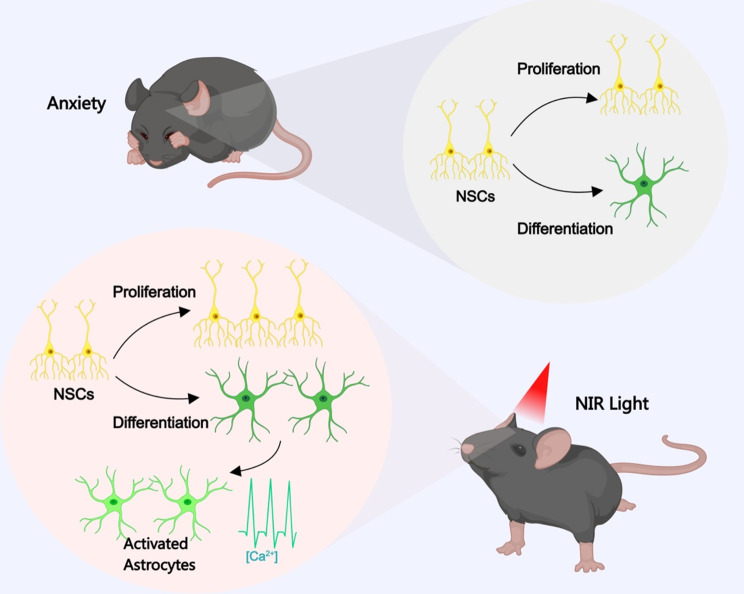
Fig. 6 Schematic representation of our findings showing that NIR light irradiation improved neurogenesis in the hippocampus with anxiolytic effects. See the Discussion section for further details. The image was created using MedPeer.cn
Fig. 6 Schematic representation of our findings showing that NIR light irradiation improved neurogenesis in the hippocampus with anxiolytic effects. See the Discussion section for further details. The image was created using MedPeer.cnCC BY-NC-ND · PubMed Central

Verification

Claims the paper makes

The claims and statistics of this paper haven’t been checked yet.

Run the check — free, no account needed. It reads the open-access text and checks the sources it cites.

A few free checks a day · papers already verified open instantly · results are public

Self-check

Percentages, sums and reported differences re-computed from the paper’s own numbers.

The self-check needs the paper’s full text.

Citations

Cites

Show all 1 references

Research works printed but not linked: 25

  1. Warner-Schmidt JL, Duman RS. Hippocampal neurogenesis: opposing effects of stress and antidepressant treatment. Hippocampus. 2006;16(3):239–49. · DOI · Paper page
  2. Palamarchuk IS, Slavich GM, Vaillancourt T, Rajji TK. Stress-related cellular pathophysiology as a crosstalk risk factor for neurocognitive and psychiatric disorders. BMC Neurosci. 2023;24(1):65. · DOI
  3. Leng L, Zhuang K, Liu Z, Huang C, Gao Y, Chen G, Lin H, Hu Y, Wu D, Shi M, et al. Menin Deficiency Leads to Depressive-like Behaviors in Mice by Modulating Astrocyte-Mediated Neuroinflammation. Neuron. 2018;100(3):551–563e557. · DOI
  4. Cho WH, Noh K, Lee BH, Barcelon E, Jun SB, Park HY, Lee SJ. Hippocampal astrocytes modulate anxiety-like behavior. Nat Commun. 2022;13(1):6536. · DOI
  5. Nie L, Yao D, Chen S, Wang J, Pan C, Wu D, Liu N, Tang Z. Directional induction of neural stem cells, a new therapy for neurodegenerative diseases and ischemic stroke. Cell Death Discov. 2023;9(1):215. · DOI
  6. Gage FH. Mammalian neural stem cells. Science. 2000;287(5457):1433–8. · DOI · Paper page
  7. Wang M, Xu Z, Liu Q, Sun W, Jiang B, Yang K, Li J, Gong Y, Liu Q, Liu D, et al. Nongenetic optical modulation of neural stem cell proliferation and neuronal/glial differentiation. Biomaterials. 2019;225:119539. · DOI
  8. Chernov M, Roe AW. Infrared neural stimulation: a new stimulation tool for central nervous system applications. Neurophotonics. 2014;1(1):011011. · DOI
  9. Nizamutdinov D, Qi X, Berman MH, Dougal G, Dayawansa S, Wu E, Yi SS, Stevens AB, Huang JH. Transcranial Near Infrared Light Stimulations Improve Cognition in Patients with Dementia. Aging Dis. 2021;12(4):954–63. · DOI
  10. Saieva S, Taglialatela G. Near-infrared light reduces glia activation and modulates neuroinflammation in the brains of diet-induced obese mice. Sci Rep. 2022;12(1):10848. · DOI
  11. Iaccarino HF, Singer AC, Martorell AJ, Rudenko A, Gao F, Gillingham TZ, Mathys H, Seo J, Kritskiy O, Abdurrob F, et al. Gamma frequency entrainment attenuates amyloid load and modifies microglia. Nature. 2016;540(7632):230–5. · DOI · Paper page
  12. Singer AC, Martorell AJ, Douglas JM, Abdurrob F, Attokaren MK, Tipton J, Mathys H, Adaikkan C, Tsai LH. Noninvasive 40-Hz light flicker to recruit microglia and reduce amyloid beta load. Nat Protoc. 2018;13(8):1850–68. · DOI · Paper page
  13. Buzsaki G, Moser EI. Memory, navigation and theta rhythm in the hippocampal-entorhinal system. Nat Neurosci. 2013;16(2):130–8. · DOI · Paper page
  14. Berson DM, Dunn FA, Takao M. Phototransduction by retinal ganglion cells that set the circadian clock. Science. 2002;295(5557):1070–3. · DOI · Paper page
  15. Dacey DM, Liao HW, Peterson BB, Robinson FR, Smith VC, Pokorny J, Yau KW, Gamlin PD. Melanopsin-expressing ganglion cells in primate retina signal colour and irradiance and project to the LGN. Nature. 2005;433(7027):749–54. · DOI · Paper page
  16. Campagnola PJ, Millard AC, Terasaki M, Hoppe PE, Malone CJ, Mohler WA. Three-dimensional high-resolution second-harmonic generation imaging of endogenous structural proteins in biological tissues. Biophys J. 2002;82(1 Pt 1):493–508. · DOI
  17. Gao F, Liu A, Qi X, Wang M, Chen X, Wei S, Gao S, Sun Y, Sun P, Li X et al. Ppp4r3a deficiency leads to depression-like behaviors in mice by modulating the synthesis of synaptic proteins. Dis Model Mech 2022, 15(6).
  18. Jones KA, Hatori M, Mure LS, Bramley JR, Artymyshyn R, Hong SP, Marzabadi M, Zhong H, Sprouse J, Zhu Q, et al. Small-molecule antagonists of melanopsin-mediated phototransduction. Nat Chem Biol. 2013;9(10):630–5. · DOI
  19. Sha L, Li J, Shen H, Wang Q, Meng P, Zhang X, Deng Y, Zhu W, Xu Q. LHPP-mediated inorganic pyrophosphate hydrolysis-driven lysosomal acidification in astrocytes regulates adult neurogenesis. Cell Rep. 2023;42(8):112975. · DOI
  20. Harada K, Kamiya T, Tsuboi T. Gliotransmitter Release from Astrocytes: Functional, Developmental, and Pathological Implications in the Brain. Front Neurosci. 2015;9:499.
  21. Semyanov A, Henneberger C, Agarwal A. Making sense of astrocytic calcium signals - from acquisition to interpretation. Nat Rev Neurosci. 2020;21(10):551–64. · DOI · Paper page
  22. Gholami L, Afshar S, Arkian A, Saeidijam M, Hendi SS, Mahmoudi R, Khorsandi K, Hashemzehi H, Fekrazad R. NIR irradiation of human buccal fat pad adipose stem cells and its effect on TRP ion channels. Lasers Med Sci. 2022;37(9):3681–92. · DOI
  23. Wang Q, Kong Y, Wu DY, Liu JH, Jie W, You QL, Huang L, Hu J, Chu HD, Gao F, et al. Impaired calcium signaling in astrocytes modulates autism spectrum disorder-like behaviors in mice. Nat Commun. 2021;12(1):3321. · DOI
  24. Loew LM, Lewis A. Second Harmonic Imaging of Membrane Potential. Adv Exp Med Biol. 2015;859:473–92. · DOI
  25. Vanzi F, Sacconi L, Cicchi R, Pavone FS. Protein conformation and molecular order probed by second-harmonic-generation microscopy. J Biomed Opt. 2012;17(6):060901. · DOI

Metadata

Authors
Qi, X., Xu, Z., Liu, X., Ren, Y., Jin, Y., Sun, W., Li, J., Liu, D., Liu, S., Liu, Q., & Li, X.
Affiliations
  • Shandong University (CN)
  • Shandong Sport University (CN)
Corresponding author
  • Liu, Duo
  • Liu, Shuwei
  • Liu, Qiji
  • Li, Xi
Venue
Stem Cell Research & Therapy
Published
2024-04-04
Volume
15
Issue
1
Pages
494-494
ISSN
1757-6512 (ISSN-L)
OpenAlex
W4405624547
Cited by
5
References
1
Citations by year
2026: 3 · 2025: 2
FWCI
0.81
Type
journal article
Language
en
Open access
Locations
  • Stem Cell Research & Therapy (publishedVersion, cc-by-nc-nd)
  • Research Square (acceptedVersion, cc-by)
  • PubMed Central (publishedVersion, cc-by-nc-nd)
  • PubMed (publishedVersion)
  • DOAJ (DOAJ: Directory of Open Access Journals) (submittedVersion, cc-by-sa)
Funders
  • Shandong University
  • National Natural Science Foundation of China (32070586, 81873737)
  • Natural Science Foundation of Shandong Province (ZR2022LZL010)
Topics
  • Life Sciences › Neuroscience › Developmental Neuroscience › Neurogenesis and neuroplasticity mechanisms
  • Health Sciences › Medicine › Radiology, Nuclear Medicine and Imaging › Laser Applications in Dentistry and Medicine
  • Health Sciences › Medicine › Radiology, Nuclear Medicine and Imaging › Optical Imaging and Spectroscopy Techniques
Keywords
near-infrared light, hippocampal neurogenesis, anxiety-like behavior, neural stem cells, astrocyte differentiation, anxiolytic effects, depression prevention, optical stimulation
MeSH terms
Animals, Anxiety, Astrocytes, Behavior, Animal, Cell Differentiation, Hippocampus, Infrared Rays, Male, Mice, Inbred C57BL, Cell Proliferation, Mice, Neurogenesis, Neural Stem Cells

About these checks

Registry, retraction, Cites and statistics results are computed, not judged, with one exception: a printed reference that no index lists is read once by a model before it counts as a citation error. Claims are extracted by a model and kept only when their quote appears verbatim in the text; each cited source is then checked, with a model’s help, for whether it says what the claim relies on. Those verdicts can be wrong — read the claim’s quote and the cited source before relying on one.

Statistics and arithmetic are recomputed, not judged.

Confidence bands are shown only for fields calibrated on our annotated test set. None is calibrated yet, so no band is shown.

What counts as a claim ›How we measure confidence ›How we check this ›

Are you an author, or do you see a problem with this page? Request a review

How to cite

Cite CoChat for the checks on this page, and the paper for its own findings.

This page
CoChat. (2026). Citation check: Near-Infrared Light Induces Neurogenesis and Modulates Anxiety-like Behavior. https://app.cochat.ai/papers/10.21203/rs.3.rs-3918262/v1
The paper
Qi, X., Xu, Z., Liu, X., Ren, Y., Jin, Y., Sun, W., Li, J., Liu, D., Liu, S., Liu, Q., & Li, X. (2024). Near-Infrared Light Induces Neurogenesis and Modulates Anxiety-like Behavior. Stem Cell Research & Therapy. https://doi.org/10.21203/rs.3.rs-3918262/v1