Student or educator? Sign up with your school email and get 6 months of Pro free.
PreprintCited by 1Acute Kidney Injury ResearchAutophagy in Disease and TherapyChronic Kidney Disease and Diabetes

The DOI matches its Crossref record; 1 of the 1 references it cites were found in a registry or an index.

ATP6V1C1 and COPA: Autophagy-Related Markers for Tracking Progression from AKI to CKD—A Multi-Omics Investigation

Open access
Wang, Yaojun, Li, Qiang·2024·Scientific Reports

Preprint — published as 10.1038/s41598-025-97269-9 · Paper page

Abstract

This study explored the relationship between acute kidney injury (AKI) and chronic kidney disease (CKD), focusing on autophagy-related genes and their immune infiltration during the transition from AKI to CKD. We performed weighted correlation network analysis (WGCNA) using two microarray datasets (GSE139061 and GSE66494) in the GEO database, and identified autophagy signatures by KEGG, GO, and GSEA enrichment analysis. Machine learning algorithms such as LASSO, random forest and XGBoost were used to construct the diagnostic model, and the diagnostic performance of GSE30718 (AKI) and GSE37171 (CKD) was used as validation cohorts to evaluate its diagnostic performance. The study identified 14 autophagy candidate genes, among which ATP6V1C1 and COPA were identified as key biomarkers that were able to effectively distinguish between AKI and CKD. Immune cell infiltration and GSEA analysis revealed immune dysregulation in AKI, and these genes were associated with inflammation and immune pathways. Single-cell analysis showed that ATP6V1C1 and COPA were specifically expressed in AKI and CKD, which may be related to renal fibrosis. In addition, drug prediction and molecular docking analysis proposed SZ(+)-(S)-202-791 and PDE4 inhibitor 16 as potential therapeutic agents. In summary, this study provides new insights into the relationship between AKI and CKD and lays a foundation for the development of new treatment strategies.

Overview

The claims and statistics of this paper haven’t been checked yet.

Run the check — free, no account needed. It reads the open-access text and checks the sources it cites.

A few free checks a day · papers already verified open instantly · results are public

Integrity signals

Registry

Crossref · 10.21203/rs.3.rs-5321995/v1

Cites

1 of 1 references verified0 citation errors · 0 not checkable

Statistics

Figures

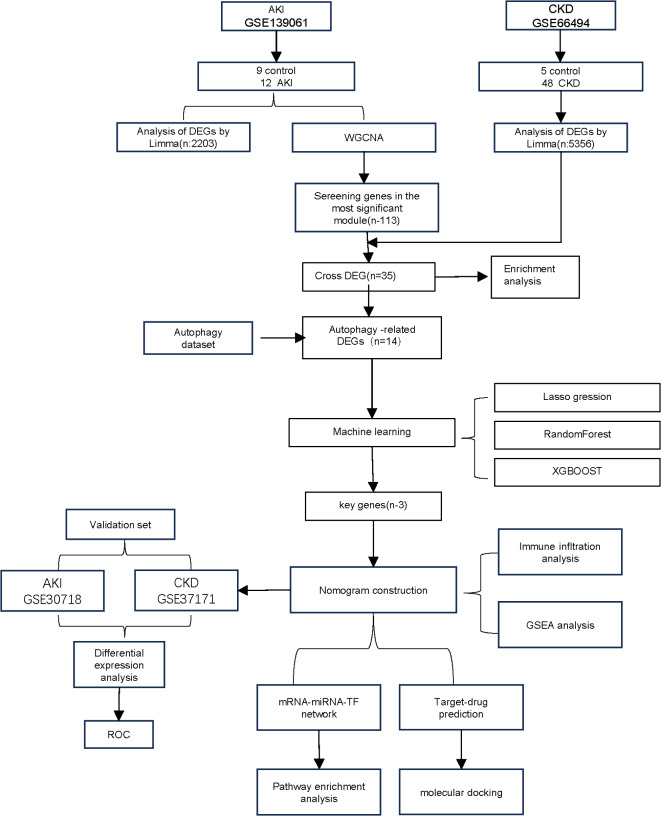
Fig. 1 Workflow of the analysis.
Fig. 1 Workflow of the analysis.CC BY-NC-ND · PubMed Central
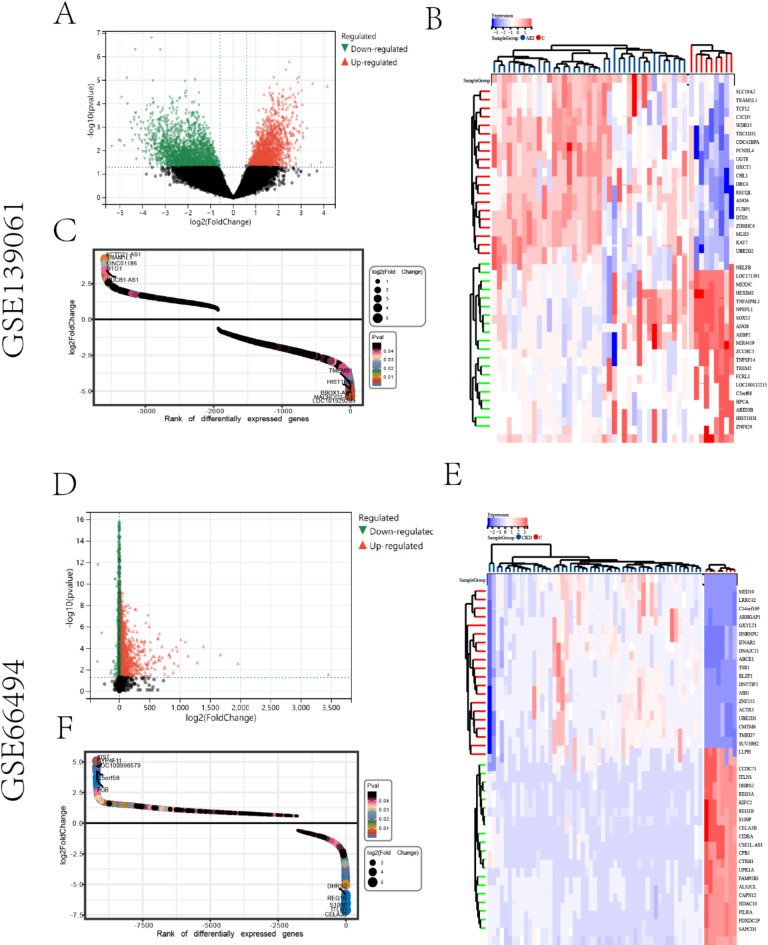
Fig. 2 DEGs between AKI, CKD, and controls. (A, D) Genes that are significantly up- and down-regulated in acute kidney AKI and CKD are shown in red and green in the graphs, respectively. (B, E) Heatmap of the top 40 differentially expressed genes in AKI and CKD conditions, where blue denotes lowly expressed genes and red denotes highly expressed genes. The distribution of differential genes, including the number of up-regulated and down-regulated genes, is depicted in the scatterplot. (C, F). The vertical coordinate shows the fold change of differential genes, while the horizontal coordinate shows the number of differential genes.
Fig. 2 DEGs between AKI, CKD, and controls. (A, D) Genes that are significantly up- and down-regulated in acute kidney AKI and CKD are shown in red and green in the graphs, respectively. (B, E) Heatmap of the top 40 differentially expressed genes in AKI and CKD conditions, where blue denotes lowly expressed genes and red denotes highly expressed genes. The distribution of differential genes, including the number of up-regulated and down-regulated genes, is depicted in the scatterplot. (C, F). The vertical coordinate shows the fold change of differential genes, while the horizontal coordinate shows the number of differential genes.CC BY-NC-ND · PubMed Central
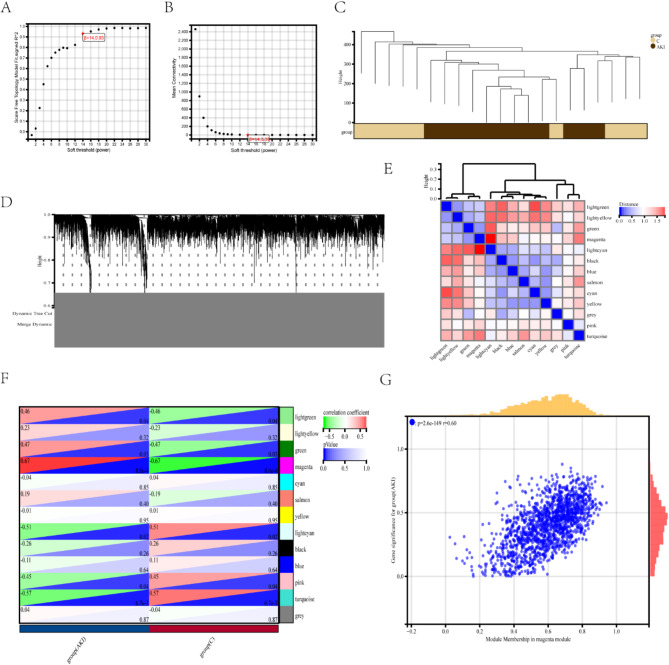
Fig. 3 The DEGs identified in AKI using WGCNA. (A, B) The soft threshold of β = 14 was selected based on scale independence and average connectivity. (C) A hierarchical clustering dendrogram of AKI and control samples. (D) An adjacency heatmap of characteristic genes. (E) Co-expression modules are represented in different colors below the gene tree. (F) A correlation heatmap depicting the association between module genes and AKI, with the “magenta” module displaying the highest correlation. The upper left triangle uses color to denote the correlation coefficient, while the lower right triangle uses color to indicate the p-value. (G) A graph showing the correlation of “magenta” module genes and AKI.
Fig. 3 The DEGs identified in AKI using WGCNA. (A, B) The soft threshold of β = 14 was selected based on scale independence and average connectivity. (C) A hierarchical clustering dendrogram of AKI and control samples. (D) An adjacency heatmap of characteristic genes. (E) Co-expression modules are represented in different colors below the gene tree. (F) A correlation heatmap depicting the association between module genes and AKI, with the “magenta” module displaying the highest correlation. The upper left triangle uses color to denote the correlation coefficient, while the lower right triangle uses color to indicate the p-value. (G) A graph showing the correlation of “magenta” module genes and AKI.CC BY-NC-ND · PubMed Central
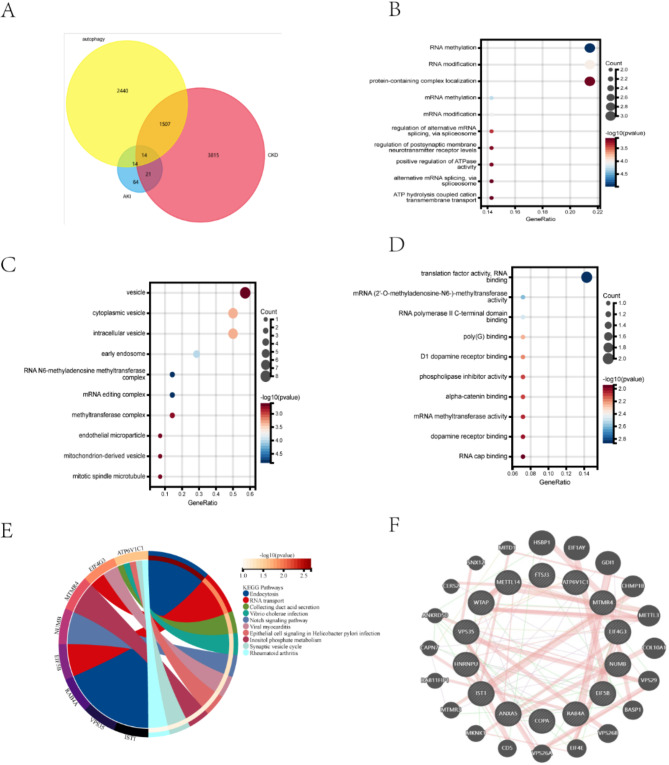
Fig. 4 Functional enrichment analysis of autophagy-related genes. (A) Differential genes in CKD were identified by Limma, modular genes in AKI were identified by WGCNA, and the intersection of the autophagy gene set included 14 genes as shown in the Venny diagram. (B–D) GO analysis covers biological processes, cellular components, and molecular functions, with the vertical axis indicating GO terms and the horizontal axis indicating the proportion of genes involved in the corresponding GO process. The size of the circle corresponds to the number of genes and the shade of the color indicates the p-value. (E) KEGG pathway analysis results, different colors indicate different important pathways and their related genes. (F) The GeneMANIA website was used to identify functionally similar genes and to build a PPI network. 20 functionally similar genes are located in the outer circle, while 14 hub genes are located in the inner circle. The color of the nodes correlates with protein function, while the line color represents the type of protein interaction.”
Fig. 4 Functional enrichment analysis of autophagy-related genes. (A) Differential genes in CKD were identified by Limma, modular genes in AKI were identified by WGCNA, and the intersection of the autophagy gene set included 14 genes as shown in the Venny diagram. (B–D) GO analysis covers biological processes, cellular components, and molecular functions, with the vertical axis indicating GO terms and the horizontal axis indicating the proportion of genes involved in the corresponding GO process. The size of the circle corresponds to the number of genes and the shade of the color indicates the p-value. (E) KEGG pathway analysis results, different colors indicate different important pathways and their related genes. (F) The GeneMANIA website was used to identify functionally similar genes and to build a PPI network. 20 functionally similar genes are located in the outer circle, while 14 hub genes are located in the inner circle. The color of the nodes correlates with protein function, while the line color represents the type of protein interaction.”CC BY-NC-ND · PubMed Central
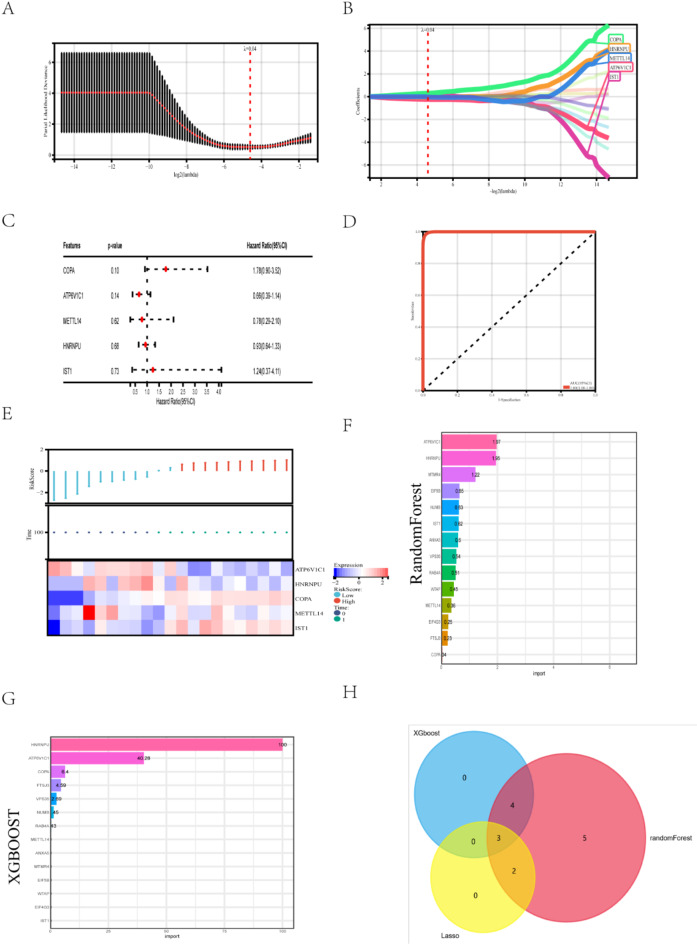
Fig. 5 Three machine learning algorithms identify key diagnostic genes from autophagy-related genes. (A, B) Key genes identified by the LASSO regression with a total of 5 genes considered suitable for diagnosis. (C) Forest plot showing the results of multifactorial analysis of COX based on 5 key genes. (D) Validation of the diagnostic efficacy of the key genes by ROC (E) Risk score heatmap depicting the high- and low-risk differential expression profiles of the 5 genes in the training cohort. (F) The results of the Random Forest algorithm are demonstrated by scoring. (G) Results of the XGBOOST algorithm are shown by scoring. (H) Key genes obtained through the overlap of the three algorithms are shown as Venny plots.
Fig. 5 Three machine learning algorithms identify key diagnostic genes from autophagy-related genes. (A, B) Key genes identified by the LASSO regression with a total of 5 genes considered suitable for diagnosis. (C) Forest plot showing the results of multifactorial analysis of COX based on 5 key genes. (D) Validation of the diagnostic efficacy of the key genes by ROC (E) Risk score heatmap depicting the high- and low-risk differential expression profiles of the 5 genes in the training cohort. (F) The results of the Random Forest algorithm are demonstrated by scoring. (G) Results of the XGBOOST algorithm are shown by scoring. (H) Key genes obtained through the overlap of the three algorithms are shown as Venny plots.CC BY-NC-ND · PubMed Central
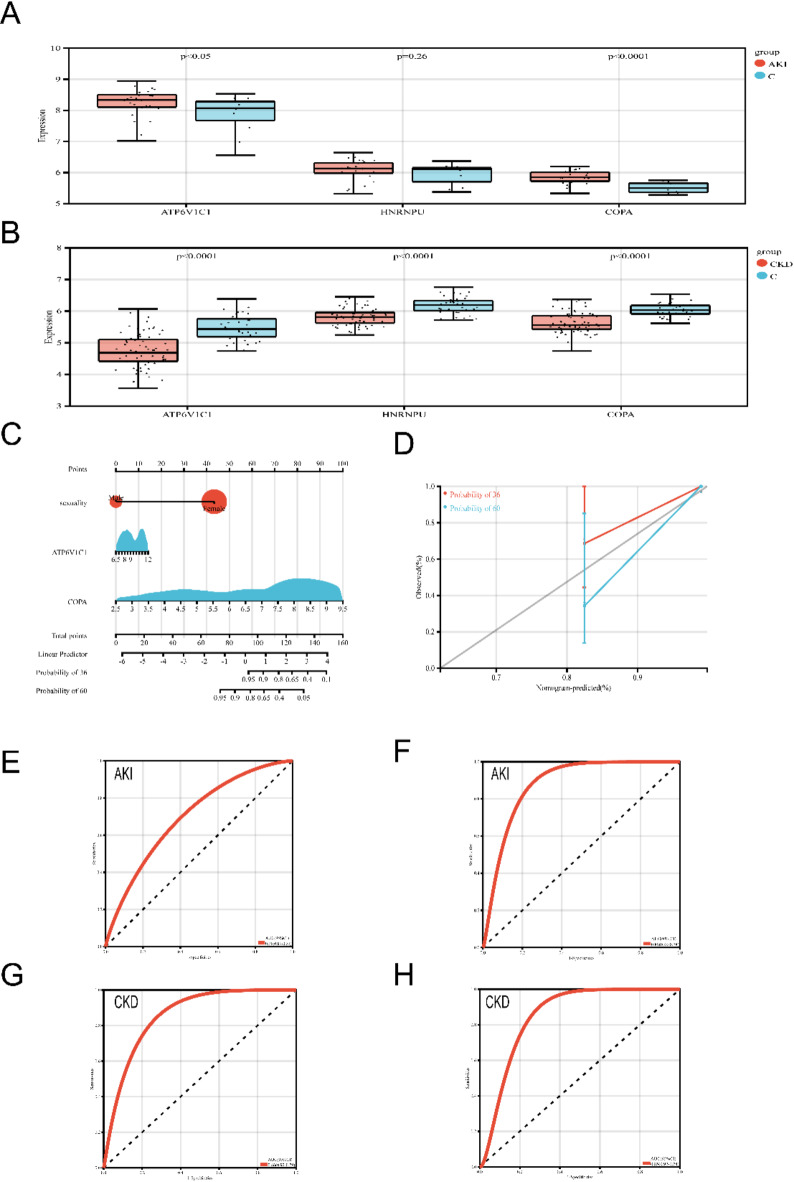
Fig. 6 Validation of key genes, construction of Nomogram, and evaluation of its diagnostic value. (A, B) Differential expression of candidate genes was validated in the validation sets of AKI and CKD. (C) Nomogram construction of the diagnostic model. (D) Calibration curve of the diagnostic model. (E–H) Diagnostic efficacy of candidate genes in the model validated by ROC curve.
Fig. 6 Validation of key genes, construction of Nomogram, and evaluation of its diagnostic value. (A, B) Differential expression of candidate genes was validated in the validation sets of AKI and CKD. (C) Nomogram construction of the diagnostic model. (D) Calibration curve of the diagnostic model. (E–H) Diagnostic efficacy of candidate genes in the model validated by ROC curve.CC BY-NC-ND · PubMed Central
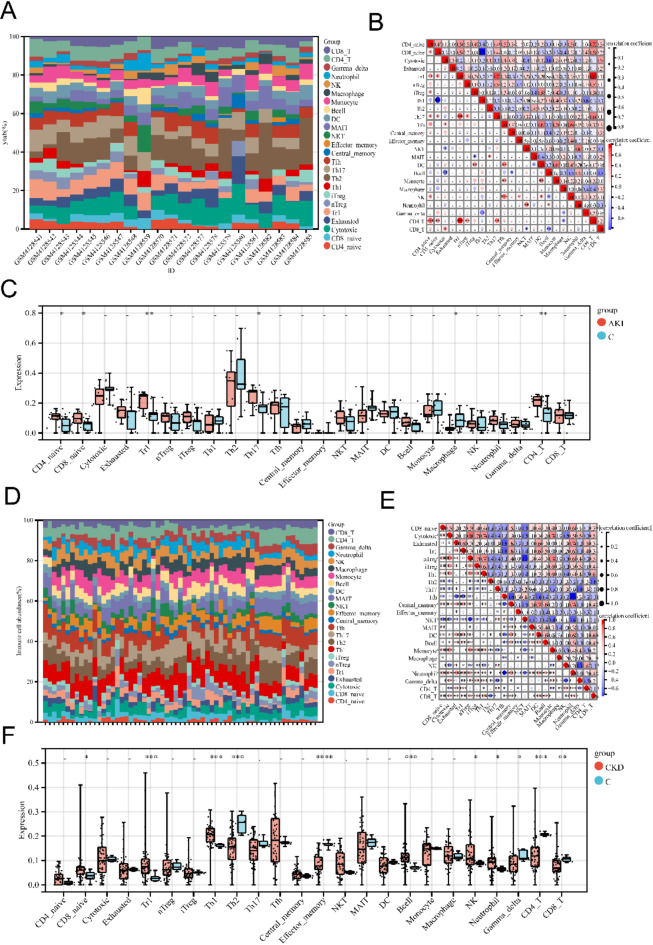
Fig. 7 Immune infiltration analysis of AKI and CKD versus controls (A, D) Superimposed bar graphs showing the proportions of the 24 immune cell types in all samples. (B, E) Correlation heatmap of the 24 immune cell types. Red color indicates positive correlation, blue color indicates negative correlation, and numbers in the graph represent correlation coefficients. (C, F) Comparison of the proportions of immune cells in AKI and CKD and controls. Significance is indicated by *p < 0.05; p < 0.01; *p < 0.001.
Fig. 7 Immune infiltration analysis of AKI and CKD versus controls (A, D) Superimposed bar graphs showing the proportions of the 24 immune cell types in all samples. (B, E) Correlation heatmap of the 24 immune cell types. Red color indicates positive correlation, blue color indicates negative correlation, and numbers in the graph represent correlation coefficients. (C, F) Comparison of the proportions of immune cells in AKI and CKD and controls. Significance is indicated by *p < 0.05; p < 0.01; *p < 0.001.CC BY-NC-ND · PubMed Central
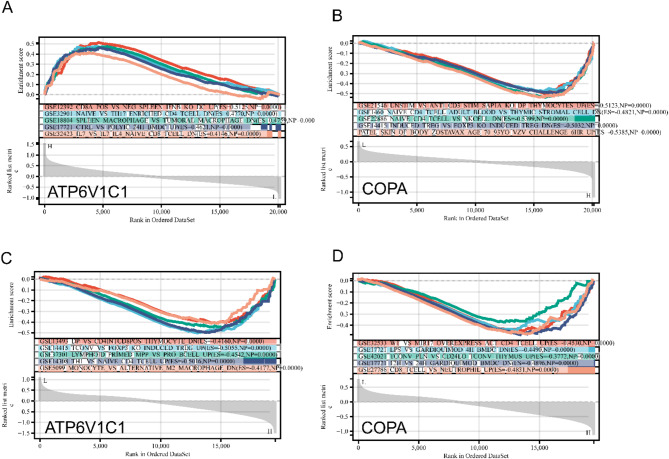
Fig. 8 GSEA immune pathway analysis of candidate genes. (A, C) GSEA analysis of candidate genes in AKI. (C, D) GSEA analysis of candidate genes in CKD. The top box represents the enrichment score of the pathway, the middlebox represents the immune pathway associated with the candidate gene, and the bottom box represents the expression level of the candidate gene.
Fig. 8 GSEA immune pathway analysis of candidate genes. (A, C) GSEA analysis of candidate genes in AKI. (C, D) GSEA analysis of candidate genes in CKD. The top box represents the enrichment score of the pathway, the middlebox represents the immune pathway associated with the candidate gene, and the bottom box represents the expression level of the candidate gene.CC BY-NC-ND · PubMed Central
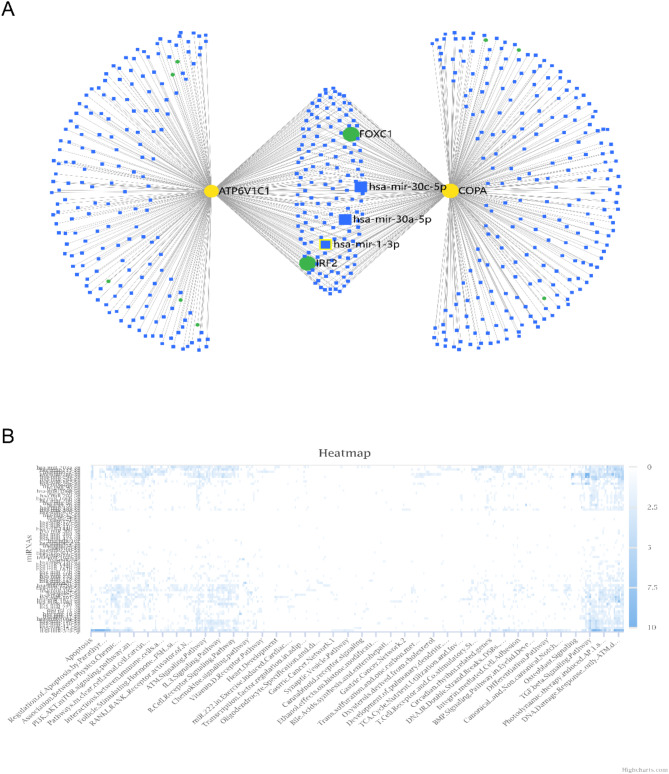
Fig. 9 Construction of miRNA-mRNA-TF network by candidate genes and functional enrichment analysis of miRNAs. (A) miRNA-mRNA-TF network constructed based on 2 candidate genes. Yellow circles represent candidate genes, blue squares represent predicted miRNAs and green circles represent predicted TFs. (B) Pathway analysis of predicted miRNAs through online platforms is shown in the heatmap.
Fig. 9 Construction of miRNA-mRNA-TF network by candidate genes and functional enrichment analysis of miRNAs. (A) miRNA-mRNA-TF network constructed based on 2 candidate genes. Yellow circles represent candidate genes, blue squares represent predicted miRNAs and green circles represent predicted TFs. (B) Pathway analysis of predicted miRNAs through online platforms is shown in the heatmap.CC BY-NC-ND · PubMed Central
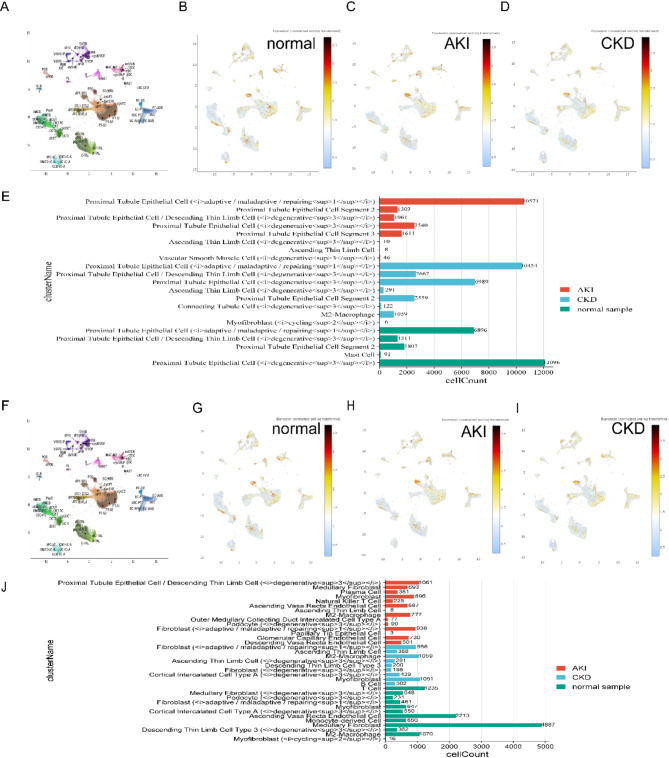
Fig. 10 Differential expression of candidate genes in single cells. (A) Cellular compartmentalization of ATP6V1C1 in the single-cell dataset. (B) Expression distribution of ATP6V1C1 in normal tissues. (C) Distribution of ATP6V1C1 expression in AKI tissues. (D) Expression distribution of ATP6V1C1 in CKD tissues. (E) Multiple histograms demonstrating the differences in cellular expression of ATP6V1C1 in normal tissues, AKI, and CKD. (F) Cellular fractionation of COPA in the single-cell dataset. (G) Distribution of COPA expression in normal tissues. (H) Distribution of COPA expression in AKI tissues. (I) Distribution of COPA expression in CKD tissues. (J) Multiple sets of bar graphs demonstrating the differences in cellular expression of COPA in normal tissues, AKI, and CKD.
Fig. 10 Differential expression of candidate genes in single cells. (A) Cellular compartmentalization of ATP6V1C1 in the single-cell dataset. (B) Expression distribution of ATP6V1C1 in normal tissues. (C) Distribution of ATP6V1C1 expression in AKI tissues. (D) Expression distribution of ATP6V1C1 in CKD tissues. (E) Multiple histograms demonstrating the differences in cellular expression of ATP6V1C1 in normal tissues, AKI, and CKD. (F) Cellular fractionation of COPA in the single-cell dataset. (G) Distribution of COPA expression in normal tissues. (H) Distribution of COPA expression in AKI tissues. (I) Distribution of COPA expression in CKD tissues. (J) Multiple sets of bar graphs demonstrating the differences in cellular expression of COPA in normal tissues, AKI, and CKD.CC BY-NC-ND · PubMed Central
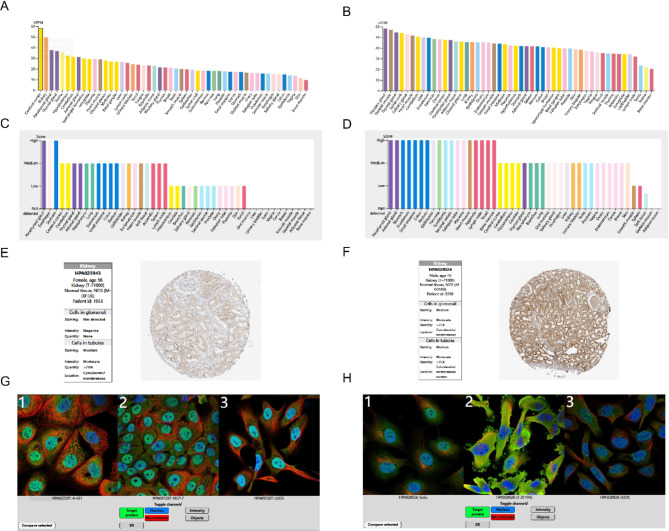
Fig. 11 Expression and localization of ATP6V1C1 and COPA. (A, B) RNA and protein expression levels of ATP6V1C1 and COPA in human tissues. (C, D) Immunohistochemical analysis of ATP6V1C1 and COPA proteins in kidney. (E, F) Immunofluorescence localization analysis of ATP6V1C1 and COPA in different cell lines. Green: ATP6V1C1 and COPA proteins; blue: nuclei; red: microtubules.
Fig. 11 Expression and localization of ATP6V1C1 and COPA. (A, B) RNA and protein expression levels of ATP6V1C1 and COPA in human tissues. (C, D) Immunohistochemical analysis of ATP6V1C1 and COPA proteins in kidney. (E, F) Immunofluorescence localization analysis of ATP6V1C1 and COPA in different cell lines. Green: ATP6V1C1 and COPA proteins; blue: nuclei; red: microtubules.CC BY-NC-ND · PubMed Central
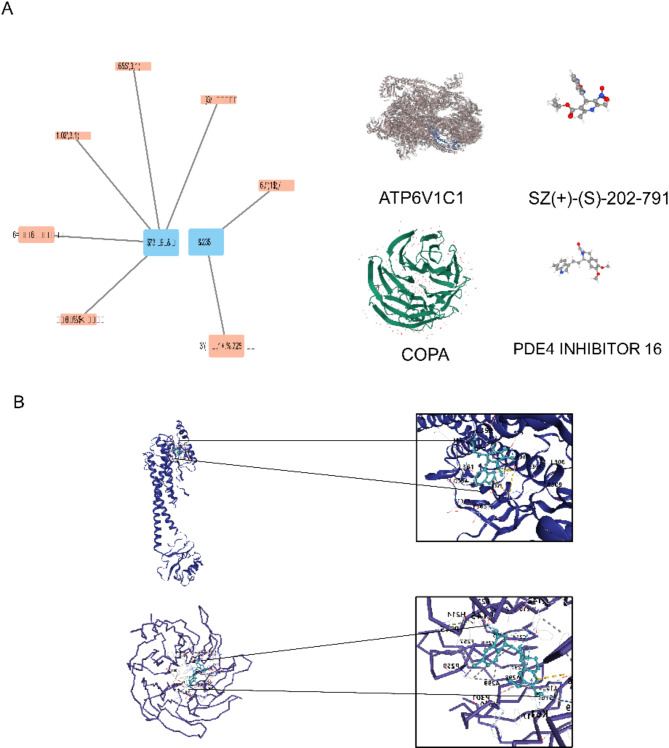
Fig. 12 Prediction and molecular docking of therapeutic drugs for candidate genes. (A) Prediction of targeting drugs for candidate genes through an online platform visualized using Cytoscape software. Blue squares represent candidate genes and orange squares represent drugs. (B) Molecular docking of ligand-protein and receptor drug crystals and their visualization.
Fig. 12 Prediction and molecular docking of therapeutic drugs for candidate genes. (A) Prediction of targeting drugs for candidate genes through an online platform visualized using Cytoscape software. Blue squares represent candidate genes and orange squares represent drugs. (B) Molecular docking of ligand-protein and receptor drug crystals and their visualization.CC BY-NC-ND · PubMed Central

Verification

Claims the paper makes

The claims and statistics of this paper haven’t been checked yet.

Run the check — free, no account needed. It reads the open-access text and checks the sources it cites.

A few free checks a day · papers already verified open instantly · results are public

Self-check

Percentages, sums and reported differences re-computed from the paper’s own numbers.

The self-check needs the paper’s full text.

Citations

Cites

Research works printed but not linked: 44

  1. Bucaloiu, I. D. et al. Increased risk of death and de novo chronic kidney disease following reversible acute kidney injury[J]. Kidney Int. 81 (5), 477–485 (2012). · DOI · Paper page
  2. Turgut, F., Awad, A. S. & Abdel-Rahman, E. M. Acute Kidney Injury: Medical Causes and Pathogenesis[J]. J. Clin. Med., 12(1). (2023). · DOI
  3. Menon, S., Symons, J. M. & Selewski, D. T. Acute Kidney Injury[J]. Pediatr. Rev. 44 (5), 265–279 (2023). · DOI
  4. Chawla, L. S. et al. Acute kidney injury and chronic kidney disease as interconnected syndromes[J]. N Engl. J. Med. 371 (1), 58–66 (2014). · DOI
  5. See, E. J. et al. Long-term risk of adverse outcomes after acute kidney injury: a systematic review and meta-analysis of cohort studies using consensus definitions of exposure[J]. Kidney Int. 95 (1), 160–172 (2019). · DOI · Paper page
  6. Tanemoto, F. & Mimura, I. Therapies Targeting Epigenetic Alterations in Acute Kidney Injury-to-Chronic Kidney Disease Transition[J]. Pharmaceuticals (Basel), 15(2). (2022). · DOI
  7. Choi, M. E. Autophagy in Kidney Disease[J]. Annu. Rev. Physiol. 82, 297–322 (2020). · DOI
  8. Liu, S. et al. Autophagy plays a critical role in kidney tubule maintenance, aging and ischemia-reperfusion injury[J]. Autophagy. 8 (5), 826–837 (2012). · DOI · Paper page
  9. Jiang, M. et al. Autophagy in proximal tubules protects against acute kidney injury[J]. Kidney Int. 82 (12), 1271–1283 (2012). · DOI · Paper page
  10. Han, Y. P. et al. Autophagy and its therapeutic potential in diabetic nephropathy[J]. Front. Endocrinol. (Lausanne). 14, 1139444 (2023). · DOI
  11. Mori, H. et al. The mTOR pathway is highly activated in diabetic nephropathy and rapamycin has a strong therapeutic potential[J]. Biochem. Biophys. Res. Commun. 384 (4), 471–475 (2009). · DOI
  12. Ritchie, M. E. et al. limma powers differential expression analyses for RNA-sequencing and microarray studies[J]. Nucleic Acids Res. 43 (7), e47 (2015). · DOI · Paper page
  13. Kanehisa, M. & Goto, S. KEGG: kyoto encyclopedia of genes and genomes[J]. Nucleic Acids Res. 28 (1), 27–30 (2000). · DOI · Paper page
  14. Warde-Farley, D. et al. The GeneMANIA prediction server: biological network integration for gene prioritization and predicting gene function[J]. Nucleic Acids Res., (2010). 38(Web Server issue):W214–W220 . · DOI · Paper page
  15. Friedman, J., Hastie, T. & Tibshirani, R. Regularization Paths for Generalized Linear Models via Coordinate Descent[J]. J. Stat. Softw. 33 (1), 1–22 (2010). · DOI · Paper page
  16. Chen, T., Guestrin, C. & XGBoost: A Scalable Tree Boosting System[J]. Proceedings of the 22nd ACM SIGKDD International Conference on Knowledge Discovery and Data Mining, (2016).
  17. Shariat, S. F. et al. Can nomograms be superior to other prediction tools?[J]. BJU Int. 103 (4), 492–495 (2009). · DOI
  18. Miao, Y. R. et al. ImmuCellAI-mouse: a tool for comprehensive prediction of mouse immune cell abundance and immune microenvironment depiction[J]. Bioinformatics. 38 (3), 785–791 (2022). · DOI
  19. Chang, L. et al. miRNet 2.0: network-based visual analytics for miRNA functional analysis and systems biology[J]. Nucleic Acids Res. 48 (W1), W244–W251 (2020). · DOI
  20. Wagner, A. H. et al. DGIdb 2.0: mining clinically relevant drug-gene interactions[J]. Nucleic Acids Res. 44 (D1), D1036–D1044 (2016). · DOI · Paper page
  21. Yan, Y. et al. The HDOCK server for integrated protein-protein docking[J]. Nat. Protoc. 15 (5), 1829–1852 (2020). · DOI · Paper page
  22. Wang, Z. & Zhang, C. From AKI to CKD: Maladaptive Repair and the Underlying Mechanisms[J]. Int. J. Mol. Sci., 23(18). (2022). · DOI
  23. Thakar, C. V. et al. A clinical score to predict acute renal failure after cardiac surgery[J]. J. Am. Soc. Nephrol. 16 (1), 162–168 (2005). · DOI · Paper page
  24. James, M. T. et al. Glomerular filtration rate, proteinuria, and the incidence and consequences of acute kidney injury: a cohort study[J]. Lancet. 376 (9758), 2096–2103 (2010). · DOI · Paper page
  25. Livingston, M. J. et al. Tubular cells produce FGF2 via autophagy after acute kidney injury leading to fibroblast activation and renal fibrosis[J]. Autophagy. 19 (1), 256–277 (2023). · DOI
  26. Su, L. et al. Mitochondria ROS and mitophagy in acute kidney injury[J]. Autophagy. 19 (2), 401–414 (2023). · DOI
  27. Yu, B. et al. TRPM2 protects against cisplatin-induced acute kidney injury and mitochondrial dysfunction via modulating autophagy[J]. Theranostics. 13 (13), 4356–4375 (2023). · DOI
  28. Jiang, M. et al. Mitochondrial dysfunction and the AKI-to-CKD transition[J]. Am. J. Physiol. Ren. Physiol. 319 (6), F1105–F1116 (2020). · DOI
  29. Yao, X. et al. The ATPase subunit of ATP6V1C1 inhibits autophagy and enhances radiotherapy resistance in esophageal squamous cell carcinoma[J]. Gene. 768, 145261 (2021). · DOI
  30. Zhu, H. et al. Identification and validation of autophagy-related genes in Kawasaki disease[J]. Hereditas. 160 (1), 17 (2023). · DOI
  31. Carpentieri, G. et al. Dominantly acting variants in ATP6V1C1 and ATP6V1B2 cause a multisystem phenotypic spectrum by altering lysosomal and/or autophagosome function[J]. Hum. Genet. Genomics Adv. 5 (4), 100349 (2024). · DOI
  32. Kumrah, R. et al. Genetics of COPA syndrome[J]. Appl. Clin. Genet. 12, 11–18 (2019). · DOI
  33. Tsui, J. L. et al. Analysis of pulmonary features and treatment approaches in the COPA syndrome[J]. ERJ Open. Res., 4(2). (2018).
  34. Watkin, L. B. et al. COPA mutations impair ER-Golgi transport and cause hereditary autoimmune-mediated lung disease and arthritis[J]. Nat. Genet. 47 (6), 654–660 (2015). · DOI · Paper page
  35. Taguchi, T. et al. STING Operation at the ER/Golgi Interface[J]. Front. Immunol. 12, 646304 (2021). · DOI
  36. Linkermann, A. et al. Regulated cell death in AKI[J]. J. Am. Soc. Nephrol. 25 (12), 2689–2701 (2014). · DOI · Paper page
  37. Li, L. et al. New autophagy reporter mice reveal dynamics of proximal tubular autophagy[J]. J. Am. Soc. Nephrol. 25 (2), 305–315 (2014). · DOI · Paper page
  38. Kumar, S. Cellular and molecular pathways of renal repair after acute kidney injury[J]. Kidney Int. 93 (1), 27–40 (2018). · DOI · Paper page
  39. Zuk, A. & Bonventre, J. V. Acute Kidney Injury[J]. Annu. Rev. Med. 67, 293–307 (2016). · DOI · Paper page
  40. He, L., Livingston, M. J. & Dong, Z. Autophagy in acute kidney injury and repair[J]. Nephron Clin. Pract. 127 (1–4), 56–60 (2014). · DOI
  41. Baisantry, A. et al. Autophagy Induces Prosenescent Changes in Proximal Tubular S3 Segments[J]. J. Am. Soc. Nephrol. 27 (6), 1609–1616 (2016). · DOI · Paper page
  42. Gameiro, J. et al. Neutrophil, lymphocyte and platelet ratio as a predictor of postoperative acute kidney injury in major abdominal surgery[J]. BMC Nephrol. 19 (1), 320 (2018). · DOI
  43. Xu, D. et al. IL-18 induces the differentiation of Th1 or Th2 cells depending upon cytokine milieu and genetic background[J]. Eur. J. Immunol. 30 (11), 3147–3156 (2000). · DOI
  44. Pindjakova, J. et al. Interleukin-1 accounts for intrarenal Th17 cell activation during ureteral obstruction[J]. Kidney Int. 81 (4), 379–390 (2012). · DOI

Metadata

Authors
Wang, Y., & Li, Q.
Affiliations
  • Affiliated Hospital of Hebei University (CN)
  • People's Liberation Army Air Force (CN)
Corresponding author
Li, Qiang
Venue
Scientific Reports
Published
2024-11-27
Volume
15
Issue
1
Pages
13687-13687
ISSN
2045-2322 (ISSN-L)
OpenAlex
W4409619675
Cited by
1
References
1
Citations by year
2026: 1
FWCI
0.69
Type
journal article
Language
en
Open access
Locations
  • Scientific Reports (publishedVersion, cc-by-nc-nd)
  • Research Square (acceptedVersion, cc-by)
  • PubMed Central (publishedVersion, cc-by-nc-nd)
  • PubMed (publishedVersion)
  • DOAJ (DOAJ: Directory of Open Access Journals) (submittedVersion, cc-by-sa)
Topics
  • Health Sciences › Medicine › Nephrology › Acute Kidney Injury Research
  • Life Sciences › Biochemistry, Genetics and Molecular Biology › Cell Biology › Autophagy in Disease and Therapy
  • Health Sciences › Medicine › Nephrology › Chronic Kidney Disease and Diabetes
Keywords
acute kidney injury, chronic kidney disease, autophagy, AKI-to-CKD transition, biomarkers, therapeutic target, COPA, immune cell infiltration, renal fibrosis, inflammation, drug prediction, molecular docking
MeSH terms
Multiomics, Autophagy, Humans, Biomarkers, Gene Expression Profiling, Renal Insufficiency, Chronic, Gene Regulatory Networks, Acute Kidney Injury, Molecular Docking Simulation, Gene Ontology

About these checks

Registry, retraction, Cites and statistics results are computed, not judged, with one exception: a printed reference that no index lists is read once by a model before it counts as a citation error. Claims are extracted by a model and kept only when their quote appears verbatim in the text; each cited source is then checked, with a model’s help, for whether it says what the claim relies on. Those verdicts can be wrong — read the claim’s quote and the cited source before relying on one.

Statistics and arithmetic are recomputed, not judged.

Confidence bands are shown only for fields calibrated on our annotated test set. None is calibrated yet, so no band is shown.

What counts as a claim ›How we measure confidence ›How we check this ›

Are you an author, or do you see a problem with this page? Request a review

Data sources

Bibliographic data: Semantic Scholar, OpenAlex, Crossref.

Contains information from the Semantic Scholar Academic Graph Datasets, made available under the ODC Attribution License (ODC-BY 1.0).

Semantic Scholar’s data is described in: Kinney, R., et al. (2023). The Semantic Scholar Open Data Platform. arXiv:2301.10140.