

The DOI matches its Crossref record; 32 of the 32 references it cites were found in a registry or an index; none of the 45 sources its claims cite is checked for support yet.
Guidance for using pilot studies to inform the design of intervention trials with continuous outcomes
Open accessAbstract
BACKGROUND: A pilot study can be an important step in the assessment of an intervention by providing information to design the future definitive trial. Pilot studies can be used to estimate the recruitment and retention rates and population variance and to provide preliminary evidence of efficacy potential. However, estimation is poor because pilot studies are small, so sensitivity analyses for the main trial's sample size calculations should be undertaken. METHODS: We demonstrate how to carry out easy-to-perform sensitivity analysis for designing trials based on pilot data using an example. Furthermore, we introduce rules of thumb for the size of the pilot study so that the overall sample size, for both pilot and main trials, is minimized. RESULTS: The example illustrates how sample size estimates for the main trial can alter dramatically by plausibly varying assumptions. Required sample size for 90% power varied from 392 to 692 depending on assumptions. Some scenarios were not feasible based on the pilot study recruitment and retention rates. CONCLUSION: Pilot studies can be used to help design the main trial, but caution should be exercised. We recommend the use of sensitivity analyses to assess the robustness of the design assumptions for a main trial.
Overview
AI snapshot
Written from the paper’s full text.
TL;DR
Pilot studies can inform the design of definitive trials with continuous outcomes by estimating recruitment/retention, population variance, and preliminary efficacy potential, but their small size makes estimates imprecise. The paper recommends sensitivity analyses and stepped rules of thumb for pilot sample size, illustrated by an example where required main-trial sample size for 90% power ranged from 392 to 692 depending on assumptions.
Key findings
- In the worked example, main-trial sample size for 90% power varied from 392 to 692 depending on assumptions about the SD and dropout rate; for 80% power, sample sizes ranged from 296 to 518.
- The pilot example had a recruitment rate of 50% of eligible patients, at 25 recruitments per month, and 80% retention (40 of 50 participants completed all three assessments).
- Based on a target standardized effect size of 4/14 = 0.29 for a 90% powered main trial, the stepped rules of thumb indicated 25 patients per arm for the pilot.
- Feasibility assessment showed that recruiting over 1.5 years at 25 participants per month would enroll 450 participants, falling below several sample size estimates in the sensitivity analysis.
Methods
- Methodological guidance paper with a worked example using a continuous outcome; it focuses on external pilot studies whose results are not combined with the main trial.
- The example is a hypothetical two-arm RCT comparing a new supportive care regimen for cancer patients to usual care, with quality of life at 3 months measured by FACT-G; the pilot had 50 participants, with 100 potential participants, 70 referred, 60 eligible, and 50 agreeing to participate.
- Main analysis demonstrates sample size sensitivity analyses varying the SD (pilot SD, upper 80% CI limit, literature estimate) and dropout rates (observed 20%, >5%, <5%), plus stepped rules of thumb for pilot sample size based on target effect size and future trial size.
Limitations
- Stated: pilot studies are small, so effect size and SD estimates are imprecise; using a pilot study’s SD to design a future sample size has been shown to often result in an underpowered study, and preliminary efficacy evidence from a pilot should not be overstated.
- Stated: sensitivity analyses are needed because sample size estimates can alter dramatically by plausibly varying assumptions, and some scenarios may not be feasible based on pilot recruitment and retention rates.
- Evident from the text: the worked example is explicitly hypothetical (“Suppose…”), so its numerical results are illustrative rather than empirical findings from an actual pilot study.
Model-written summary. Check it against the paper before relying on it.
Integrity signals
Registry
Cites
Statistics
Figures
Verification
Claims the paper makes
31 Not checked yet · 8 No basis given · 7 Own result · 6 Own interpretation
A result the paper reports from its own data — it cites no other source for it, so there is none to check. The quote shows it is in the paper.
In the paper
“Required sample size for 90% power varied from 392 to 692 depending on assumptions.”
- Also stated in: § Sample size calculations and sensitivity analyses · plain
“For 90% power, sample size ranges from 392 to 692.”
§ Guidance for using pilot studies to inform the design of intervention trials with continuous outcomes > Abstract > Results
plaincorrelational- Asserted: passes — The authors put it forward as true.
- Checkable: passes — It can be checked against evidence.
- Load-bearing: passes — The paper’s conclusions depend on it.
- Based: passes — The paper gives a reason why it holds.
- Also stated in: § Sample size calculations and sensitivity analyses · plain
A result the paper reports from its own data — it cites no other source for it, so there is none to check. The quote shows it is in the paper.
In the paper
“The example illustrates how sample size estimates for the main trial can alter dramatically by plausibly varying assumptions.”
- Also stated in: § Conclusion · boosted
“The example demonstrated how main trial sample size estimates can vary dramatically by plausibly altering assumptions.”
§ Guidance for using pilot studies to inform the design of intervention trials with continuous outcomes > Abstract > Results
boosteddirect- Asserted: passes — The authors put it forward as true.
- Checkable: passes — It can be checked against evidence.
- Load-bearing: passes — The paper’s conclusions depend on it.
- Based: passes — The paper gives a reason why it holds.
- Also stated in: § Conclusion · boosted
A result the paper reports from its own data — it cites no other source for it, so there is none to check. The quote shows it is in the paper.
In the paper
“Some scenarios were not feasible based on the pilot study recruitment and retention rates.”
§ Guidance for using pilot studies to inform the design of intervention trials with continuous outcomes > Abstract > Results
plaindirect- Asserted: passes — The authors put it forward as true.
- Checkable: passes — It can be checked against evidence.
- Load-bearing: unclear — It is unclear whether the paper’s conclusions depend on it.
- Based: passes — The paper gives a reason why it holds.
A result the paper reports from its own data — it cites no other source for it, so there is none to check. The quote shows it is in the paper.
In the paper
“For 80% power, sample sizes range from 296 to 518.”
§ Guidance for using pilot studies to inform the design of intervention trials with continuous outcomes > Example > Sample size calculations and sensitivity analyses
plain- Asserted: passes — The authors put it forward as true.
- Checkable: passes — It can be checked against evidence.
- Load-bearing: unclear — It is unclear whether the paper’s conclusions depend on it.
- Based: passes — The paper gives a reason why it holds.
The paper states this without a source or data behind it here, so there is nothing to check it against. The quote shows it is in the paper.
In the paper
“Using an MID estimate of four points, and an SD of 14, the standardized effect size is 4/14=0.29.”
§ Guidance for using pilot studies to inform the design of intervention trials with continuous outcomes > Example > Pilot study sample size
plain- Asserted: passes — The authors put it forward as true.
- Checkable: passes — It can be checked against evidence.
- Load-bearing: passes — The paper’s conclusions depend on it.
- Based: passes — The paper gives a reason why it holds.
A result the paper reports from its own data — it cites no other source for it, so there is none to check. The quote shows it is in the paper.
In the paper
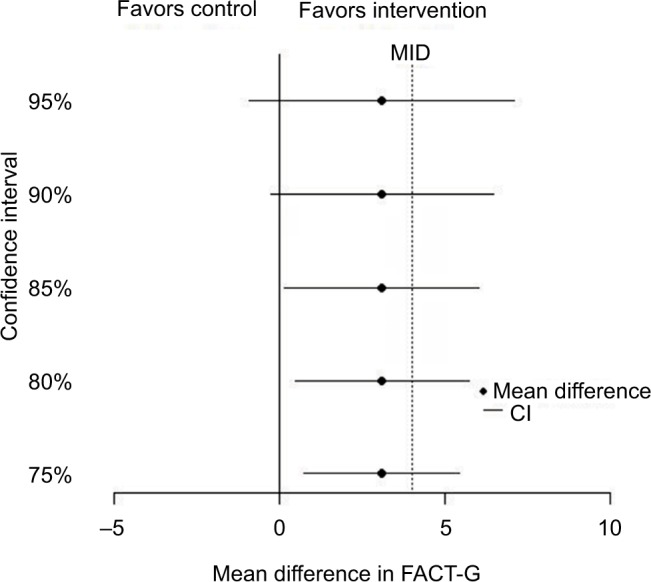
“Figure 1 shows several CIs demonstrating that the intervention is promising, as each CI contains the MID of 4.”
§ Guidance for using pilot studies to inform the design of intervention trials with continuous outcomes > Example > Pilot study results
boosted- Asserted: passes — The authors put it forward as true.
- Checkable: passes — It can be checked against evidence.
- Load-bearing: passes — The paper’s conclusions depend on it.
- Based: passes — The paper gives a reason why it holds.
In the paper
“The target effect size must also be realistic, and the estimated effect size and confidence interval (CI) from the pilot can give some evidence here, ie, whether there is any indication that the intervention is effective and important differences might be obtained in the main trial.5”
§ Guidance for using pilot studies to inform the design of intervention trials with continuous outcomes > Considerations for trial design > Target effect size and potential efficacy
What the sources say
- Not checked yetcites [5] Cocks K Torgerson DJ Sample size calculations for pilot randomized trials: a confidence interval approach J Clin Epidemiol 2013 66 2 197 201 23195919
hedgedcorrelational- Asserted: passes — The authors put it forward as true.
- Checkable: passes — It can be checked against evidence.
- Load-bearing: passes — The paper’s conclusions depend on it.
- Based: passes — The paper gives a reason why it holds.
None of the sources cited for this claim have been checked yet.
In the paper
“However, estimation is poor because pilot studies are small, so sensitivity analyses for the main trial’s sample size calculations should be undertaken.”
- Also stated in: § Target effect size and potential efficacy · plain
“The small sample size of a pilot makes estimation uncertain, so caution must be exercised.19,20”
§ Guidance for using pilot studies to inform the design of intervention trials with continuous outcomes > Abstract > Background
What the sources say
- Not checked yetcites [19] Kraemer HC Mintz J Noda A Tinklenberg J Yesavage JA Caution regarding the use of pilot studies to guide power calculations for study proposals Arch Gen Psychiatry 2006 63 5 484 489 16651505
- Not checked yetcites [20] Loscalzo J Pilot trials in clinical research: of what value are they? Circulation 2009 119 13 1694 1696 19349331
plaindirect- Asserted: passes — The authors put it forward as true.
- Checkable: passes — It can be checked against evidence.
- Load-bearing: passes — The paper’s conclusions depend on it.
- Based: passes — The paper gives a reason why it holds.
- Also stated in: § Target effect size and potential efficacy · plain
None of the sources cited for this claim have been checked yet.
In the paper
“The small sample size of a pilot makes estimation uncertain, so caution must be exercised.19,20”
§ Guidance for using pilot studies to inform the design of intervention trials with continuous outcomes > Considerations for trial design > Target effect size and potential efficacy
What the sources say
- Not checked yetcites [19] Kraemer HC Mintz J Noda A Tinklenberg J Yesavage JA Caution regarding the use of pilot studies to guide power calculations for study proposals Arch Gen Psychiatry 2006 63 5 484 489 16651505
- Not checked yetcites [20] Loscalzo J Pilot trials in clinical research: of what value are they? Circulation 2009 119 13 1694 1696 19349331
plaindirect- Asserted: passes — The authors put it forward as true.
- Checkable: passes — It can be checked against evidence.
- Load-bearing: passes — The paper’s conclusions depend on it.
- Based: passes — The paper gives a reason why it holds.
In the paper
“pilot studies can also give estimates of retention rates and adherence rates.11”
§ Guidance for using pilot studies to inform the design of intervention trials with continuous outcomes > Considerations for trial design > Feasibility
What the sources say
- Not checked yetcites [11] Avery KNL Williamson PR Gamble C Informing efficient randomised controlled trials: exploration of challenges in developing progression criteria for internal pilot studies BMJ Open 2017 7 2 e013537 PMC5318608 28213598
plain- Asserted: passes — The authors put it forward as true.
- Checkable: passes — It can be checked against evidence.
- Load-bearing: passes — The paper’s conclusions depend on it.
- Based: passes — The paper gives a reason why it holds.
- Probably not a substantial claim. 23
- It may state two separate claims as one. 15
The paper states this without a source or data behind it here, so there is nothing to check it against. The quote shows it is in the paper.
In the paper
“If the pilot recruitment rate of 25 participants per month is a good estimate, then the study will be able to recruit and enroll 450 participants.”
§ Guidance for using pilot studies to inform the design of intervention trials with continuous outcomes > Example > Feasibility of the main trial
plainconditionaln = 25- Asserted: passes — The authors put it forward as true.
- Checkable: passes — It can be checked against evidence.
- Load-bearing: fails — The paper’s conclusions may not depend on it.
- Based: passes — The paper gives a reason why it holds.
Probably not a substantial claim. The paper’s conclusions may not depend on it.
A result the paper reports from its own data — it cites no other source for it, so there is none to check. The quote shows it is in the paper.
In the paper
“Of the 50 participants, 40 participants completed all three assessments; retention is 80%.”
§ Guidance for using pilot studies to inform the design of intervention trials with continuous outcomes > Example > Pilot study results
plainn = 50- Asserted: passes — The authors put it forward as true.
- Checkable: passes — It can be checked against evidence.
- Load-bearing: fails — The paper’s conclusions may not depend on it.
- Based: passes — The paper gives a reason why it holds.
Probably not a substantial claim. The paper’s conclusions may not depend on it. It may state two separate claims as one.
The paper states this without a source or data behind it here, so there is nothing to check it against. The quote shows it is in the paper.
In the paper
“This indicates a recruitment rate of 50% of eligible patients, at 25 recruitments per month.”
§ Guidance for using pilot studies to inform the design of intervention trials with continuous outcomes > Example > Pilot study results
hedgedn = 50- Asserted: passes — The authors put it forward as true.
- Checkable: passes — It can be checked against evidence.
- Load-bearing: unclear — It is unclear whether the paper’s conclusions depend on it.
- Based: passes — The paper gives a reason why it holds.
It may state two separate claims as one.
The paper states this without a source or data behind it here, so there is nothing to check it against. The quote shows it is in the paper.
In the paper
“The difference in the quality of life between the arms at 3 months is estimated at 3.1 points, with 95% CI −1.8 to 8.0, and SD =11.2.”
§ Guidance for using pilot studies to inform the design of intervention trials with continuous outcomes > Example > Pilot study results
hedgedn = 50- Asserted: passes — The authors put it forward as true.
- Checkable: passes — It can be checked against evidence.
- Load-bearing: passes — The paper’s conclusions depend on it.
- Based: passes — The paper gives a reason why it holds.
It may state two separate claims as one.
A result the paper reports from its own data — it cites no other source for it, so there is none to check. The quote shows it is in the paper.
In the paper
“This falls below several of the estimates in Table 2.”
§ Guidance for using pilot studies to inform the design of intervention trials with continuous outcomes > Example > Feasibility of the main trial
plainn = 450- Asserted: passes — The authors put it forward as true.
- Checkable: passes — It can be checked against evidence.
- Load-bearing: fails — The paper’s conclusions may not depend on it.
- Based: passes — The paper gives a reason why it holds.
Probably not a substantial claim. The paper’s conclusions may not depend on it.
In the paper
“Hislop et al15 undertook a systematic review to identify seven approaches for determining the target effect size for an RCT and classified them as clinically important and/or realistic.”
§ Guidance for using pilot studies to inform the design of intervention trials with continuous outcomes > Considerations for trial design > Target effect size and potential efficacy
What the sources say
- Not checked yetcites [15] Hislop J Adewuyi TE Vale LD Methods for specifying the target difference in a randomised controlled trial: the Difference ELicitation in TriAls (DELTA) systematic review PLoS Med 2014 11 5 e1001645 24824338 PMC4019477
plain- Asserted: passes — The authors put it forward as true.
- Checkable: passes — It can be checked against evidence.
- Load-bearing: fails — The paper’s conclusions may not depend on it.
- Based: passes — The paper gives a reason why it holds.
Probably not a substantial claim. The paper’s conclusions may not depend on it. It may state two separate claims as one.
In the paper
“While some authors argue against carrying out hypothesis tests and assessing efficacy from pilots, even potential efficacy, most pilot studies do undertake hypothesis tests.6”
§ Guidance for using pilot studies to inform the design of intervention trials with continuous outcomes > Considerations for trial design > Target effect size and potential efficacy
What the sources say
- Not checked yetcites [6] Shanyinde M Pickering RM Weatherall M Questions asked and answered in pilot and feasibility randomized controlled trials BMC Med Res Methodol 2011 11 1 117 21846349 PMC3170294
plain- Asserted: passes — The authors put it forward as true.
- Checkable: passes — It can be checked against evidence.
- Load-bearing: fails — The paper’s conclusions may not depend on it.
- Based: passes — The paper gives a reason why it holds.
Probably not a substantial claim. The paper’s conclusions may not depend on it.
None of the sources cited for this claim have been checked yet.
In the paper
“Pilot studies can be used to estimate the recruitment and retention rates and population variance and to provide preliminary evidence of efficacy potential.”
- Also stated in: § Introduction · plain
“To address this aim, there are a number of objectives for a pilot study including assessing recruitment and retention rates, obtaining estimates of parameters required for sample size calculation, and providing preliminary evidence of efficacy potential.3–6”
§ Guidance for using pilot studies to inform the design of intervention trials with continuous outcomes > Abstract > Background
What the sources say
- Not checked yetcites [3] Craig P Dieppe P Macintyre S Developing and evaluating complex interventions: the new Medical Research Council guidance BMJ 2008 337 a1655 18824488 PMC2769032
- Not checked yetcites [4] Lancaster G Campbell M Eldridge S Trials in primary care: statistical issues in the design, conduct and evaluation of complex interventions Stat Methods Med Res 2010 19 4 349 377 20442193
- Not checked yetcites [5] Cocks K Torgerson DJ Sample size calculations for pilot randomized trials: a confidence interval approach J Clin Epidemiol 2013 66 2 197 201 23195919
- Not checked yetcites [6] Shanyinde M Pickering RM Weatherall M Questions asked and answered in pilot and feasibility randomized controlled trials BMC Med Res Methodol 2011 11 1 117 21846349 PMC3170294
plaindirect- Asserted: passes — The authors put it forward as true.
- Checkable: passes — It can be checked against evidence.
- Load-bearing: passes — The paper’s conclusions depend on it.
- Based: passes — The paper gives a reason why it holds.
It may state two separate claims as one.
- Also stated in: § Introduction · plain
In the paper
“A figure showing these CIs, the MID, and the null value can be a helpful way of displaying pilot results, by facilitating an assessment of both statistical significance and the potential for clinical significance.31”
§ Guidance for using pilot studies to inform the design of intervention trials with continuous outcomes > Considerations for trial design > Target effect size and potential efficacy
What the sources say
- Not checked yetcites [31] Bell ML Fiero MH Dhillon HM Bray VJ Vardy JL Statistical controversies in cancer research: using standardized effect size graphs to enhance interpretability of cancer-related clinical trials with patient-reported outcomes Ann Oncol 2017 28 8 1730 1733 28327975 PMC5834129
plain- Asserted: passes — The authors put it forward as true.
- Checkable: fails — It may be too vague to check against evidence.
- Load-bearing: fails — The paper’s conclusions may not depend on it.
- Based: passes — The paper gives a reason why it holds.
Probably not a substantial claim. It may be too vague to check against evidence. The paper’s conclusions may not depend on it.
The paper states this without a source or data behind it here, so there is nothing to check it against. The quote shows it is in the paper.
In the paper
“Pilot trial results can inform each of these elements.”
§ Guidance for using pilot studies to inform the design of intervention trials with continuous outcomes > Considerations for trial design
plaindirect- Asserted: passes — The authors put it forward as true.
- Checkable: passes — It can be checked against evidence.
- Load-bearing: passes — The paper’s conclusions depend on it.
- Based: passes — The paper gives a reason why it holds.
Probably not a substantial claim. It may state two separate claims as one.
The paper states this without a source or data behind it here, so there is nothing to check it against. The quote shows it is in the paper.
In the paper
“The population SD is another key element of sample size estimation for continuous outcomes, and its estimation is one of the objectives for conducting a pilot study.”
§ Guidance for using pilot studies to inform the design of intervention trials with continuous outcomes > Considerations for trial design > Estimating the standard deviation (SD)
plain- Asserted: passes — The authors put it forward as true.
- Checkable: passes — It can be checked against evidence.
- Load-bearing: passes — The paper’s conclusions depend on it.
- Based: passes — The paper gives a reason why it holds.
It may state two separate claims as one.
None of the sources cited for this claim have been checked yet.
In the paper
“In the absence of a known MID for continuous outcomes, particularly patient-reported outcomes, a standardized effect size15 between 0.3 and 0.5 has been recommended.17,18”
§ Guidance for using pilot studies to inform the design of intervention trials with continuous outcomes > Considerations for trial design > Target effect size and potential efficacy
What the sources say
- Not checked yetcites [15] Hislop J Adewuyi TE Vale LD Methods for specifying the target difference in a randomised controlled trial: the Difference ELicitation in TriAls (DELTA) systematic review PLoS Med 2014 11 5 e1001645 24824338 PMC4019477
- Not checked yetcites [17] King M A point of minimal important difference (MID): a critique of terminology and methods Expert Rev Pharmacoecon Outcomes Res 2011 11 2 171 184 21476819
- Not checked yetcites [18] Norman GR Sloan JA Wyrwich KW The truly remarkable universality of half a standard deviation: confirmation through another look Expert Rev Pharmacoecon Outcomes Res 2004 4 5 581 585 19807551
plain- Asserted: passes — The authors put it forward as true.
- Checkable: passes — It can be checked against evidence.
- Load-bearing: passes — The paper’s conclusions depend on it.
- Based: passes — The paper gives a reason why it holds.
Probably not a substantial claim.
In the paper
“Factors such as type I error and power are set independent of the pilot and are discussed in detail elsewhere.7”
§ Guidance for using pilot studies to inform the design of intervention trials with continuous outcomes > Considerations for trial design
What the sources say
- Not checked yetcites [7] Julious SA Sample sizes for clinical trials with normal data Stat Med 2004 23 12 1921 1986 15195324
plain- Asserted: passes — The authors put it forward as true.
- Checkable: passes — It can be checked against evidence.
- Load-bearing: fails — The paper’s conclusions may not depend on it.
- Based: passes — The paper gives a reason why it holds.
Probably not a substantial claim. The paper’s conclusions may not depend on it.
In the paper
“Many trials struggle to reach their sample size goal, which can result in trial extensions or failure to recruit to their prespecified sample size.10”
§ Guidance for using pilot studies to inform the design of intervention trials with continuous outcomes > Considerations for trial design > Feasibility
What the sources say
- Not checked yetcites [10] Sully B Julious SA Nicholl J A reinvestigation of recruitment to randomised, controlled, multicenter trials: a review of trials funded by two UK funding agencies Trials 2013 14 166 23758961 PMC3691846
plaindirect- Asserted: passes — The authors put it forward as true.
- Checkable: passes — It can be checked against evidence.
- Load-bearing: unclear — It is unclear whether the paper’s conclusions depend on it.
- Based: passes — The paper gives a reason why it holds.
It may state two separate claims as one.
None of the sources cited for this claim have been checked yet.
In the paper
“Pilot trials are often small versions of the main trial, undertaken to test trial methods and procedures.1,2”
§ Guidance for using pilot studies to inform the design of intervention trials with continuous outcomes > Introduction
What the sources say
- Not checked yetcites [1] Thabane L Ma J Chu R A tutorial on pilot studies: the what, why and how BMC Med Res Methodol 2010 10 1 20053272 PMC2824145
- Not checked yetcites [2] Arain M Campbell MJ Cooper CL Lancaster GA What is a pilot or feasibility study? A review of current practice and editorial policy BMC Med Res Methodol 2010 10 67 20637084 PMC2912920
plain- Asserted: passes — The authors put it forward as true.
- Checkable: passes — It can be checked against evidence.
- Load-bearing: fails — The paper’s conclusions may not depend on it.
- Based: passes — The paper gives a reason why it holds.
Probably not a substantial claim. The paper’s conclusions may not depend on it. It may state two separate claims as one.
None of the sources cited for this claim have been checked yet.
In the paper
“To address this aim, there are a number of objectives for a pilot study including assessing recruitment and retention rates, obtaining estimates of parameters required for sample size calculation, and providing preliminary evidence of efficacy potential.3–6”
§ Guidance for using pilot studies to inform the design of intervention trials with continuous outcomes > Introduction
What the sources say
- Not checked yetcites [3] Craig P Dieppe P Macintyre S Developing and evaluating complex interventions: the new Medical Research Council guidance BMJ 2008 337 a1655 18824488 PMC2769032
- Not checked yetcites [4] Lancaster G Campbell M Eldridge S Trials in primary care: statistical issues in the design, conduct and evaluation of complex interventions Stat Methods Med Res 2010 19 4 349 377 20442193
- Not checked yetcites [5] Cocks K Torgerson DJ Sample size calculations for pilot randomized trials: a confidence interval approach J Clin Epidemiol 2013 66 2 197 201 23195919
- Not checked yetcites [6] Shanyinde M Pickering RM Weatherall M Questions asked and answered in pilot and feasibility randomized controlled trials BMC Med Res Methodol 2011 11 1 117 21846349 PMC3170294
plain- Asserted: passes — The authors put it forward as true.
- Checkable: passes — It can be checked against evidence.
- Load-bearing: passes — The paper’s conclusions depend on it.
- Based: passes — The paper gives a reason why it holds.
Probably not a substantial claim. It may state two separate claims as one.
In the paper
“Although some researchers use the pilot effect size to power the definitive trial, this is a practice that should be avoided in general, as estimation is poor due to the small sample size, and is likely to mislead.19”
§ Guidance for using pilot studies to inform the design of intervention trials with continuous outcomes > Considerations for trial design > Target effect size and potential efficacy
What the sources say
- Not checked yetcites [19] Kraemer HC Mintz J Noda A Tinklenberg J Yesavage JA Caution regarding the use of pilot studies to guide power calculations for study proposals Arch Gen Psychiatry 2006 63 5 484 489 16651505
hedgeddirect- Asserted: passes — The authors put it forward as true.
- Checkable: passes — It can be checked against evidence.
- Load-bearing: passes — The paper’s conclusions depend on it.
- Based: passes — The paper gives a reason why it holds.
It may state two separate claims as one.
In the paper
“One approach for handling this uncertainty is to use significance levels other than the “traditional” 5% to provide preliminary evidence for efficacy, with corresponding CIs such as 85 and 75% in addition to 95% CIs.21”
§ Guidance for using pilot studies to inform the design of intervention trials with continuous outcomes > Considerations for trial design > Target effect size and potential efficacy
What the sources say
- Not checked yetcites [21] Lee EC Whitehead AL Jacques RM Julious SA The statistical interpretation of pilot trials: should significance thresholds be reconsidered? BMC Med Res Methodol 2014 14 1 41 24650044 PMC3994566
plainconditional- Asserted: passes — The authors put it forward as true.
- Checkable: passes — It can be checked against evidence.
- Load-bearing: fails — The paper’s conclusions may not depend on it.
- Based: passes — The paper gives a reason why it holds.
Probably not a substantial claim. The paper’s conclusions may not depend on it.
In the paper
“From this work, they proposed stepped rules of thumb for pilot studies based on the target effect size and the size of the future trial.”
§ Guidance for using pilot studies to inform the design of intervention trials with continuous outcomes > Pilot study sample size
What the sources say
- Not checked yetcites [27] Whitehead A Julious S Cooper C Campbell MJ Estimating the sample size for a pilot randomised trial to minimise the overall trial sample size for the external pilot and main trial for a continuous outcome variable Stat Methods Med Res 2016 25 3 1057 1073 26092476 PMC4876429
plaindirect- Asserted: passes — The authors put it forward as true.
- Checkable: passes — It can be checked against evidence.
- Load-bearing: passes — The paper’s conclusions depend on it.
- Based: passes — The paper gives a reason why it holds.
Probably not a substantial claim.
None of the sources cited for this claim have been checked yet.
In the paper
“The decision to progress from a pilot trial to a main trial is generally made using feasibility estimates, as well as issues such as protocol nonadherence.”
§ Guidance for using pilot studies to inform the design of intervention trials with continuous outcomes > Conclusion
What the sources say
- Not checked yetcites [11] Avery KNL Williamson PR Gamble C Informing efficient randomised controlled trials: exploration of challenges in developing progression criteria for internal pilot studies BMJ Open 2017 7 2 e013537 PMC5318608 28213598
- Not checked yetcites [14] Hampson LV Williamson PR Wilby MJ Jaki T A framework for prospectively defining progression rules for internal pilot studies monitoring recruitment Stat Methods Med Res Epub 2017 1 01 28589752
plaincorrelational- Asserted: passes — The authors put it forward as true.
- Checkable: passes — It can be checked against evidence.
- Load-bearing: fails — The paper’s conclusions may not depend on it.
- Based: passes — The paper gives a reason why it holds.
Probably not a substantial claim. The paper’s conclusions may not depend on it.
None of the sources cited for this claim have been checked yet.
In the paper
“While there are several rules of thumb for the size of a pilot study, ranging from 12 to 35 individuals per arm,5,27 none of these guidelines account for the likely size of the future trial.”
§ Guidance for using pilot studies to inform the design of intervention trials with continuous outcomes > Pilot study sample size
What the sources say
- Not checked yetcites [5] Cocks K Torgerson DJ Sample size calculations for pilot randomized trials: a confidence interval approach J Clin Epidemiol 2013 66 2 197 201 23195919
- Not checked yetcites [27] Whitehead A Julious S Cooper C Campbell MJ Estimating the sample size for a pilot randomised trial to minimise the overall trial sample size for the external pilot and main trial for a continuous outcome variable Stat Methods Med Res 2016 25 3 1057 1073 26092476 PMC4876429
plain- Asserted: passes — The authors put it forward as true.
- Checkable: passes — It can be checked against evidence.
- Load-bearing: passes — The paper’s conclusions depend on it.
- Based: passes — The paper gives a reason why it holds.
It may state two separate claims as one.
The paper states this without a source or data behind it here, so there is nothing to check it against. The quote shows it is in the paper.
In the paper
“Although traditional power calculations are inappropriate for pilot studies (since the primary aim of a pilot study is not to test superiority of one treatment over the other), a sample size justification is important.”
§ Guidance for using pilot studies to inform the design of intervention trials with continuous outcomes > Pilot study sample size
plaindirect- Asserted: passes — The authors put it forward as true.
- Checkable: passes — It can be checked against evidence.
- Load-bearing: passes — The paper’s conclusions depend on it.
- Based: passes — The paper gives a reason why it holds.
It may state two separate claims as one.
A conclusion the paper draws from its own results — it cites no other source for it, so there is none to check. The quote shows it is in the paper.
In the paper
“We have illustrated how pilot studies can aid in the design of future trials with continuous outcomes by providing estimates of population SD, evidence of potential for intervention effectiveness, and quantification of feasibility in the form of recruitment and retention rates.”
§ Guidance for using pilot studies to inform the design of intervention trials with continuous outcomes > Conclusion
plaindirect- Asserted: passes — The authors put it forward as true.
- Checkable: passes — It can be checked against evidence.
- Load-bearing: passes — The paper’s conclusions depend on it.
- Based: passes — The paper gives a reason why it holds.
It may state two separate claims as one.
A conclusion the paper draws from its own results — it cites no other source for it, so there is none to check. The quote shows it is in the paper.
In the paper
“These rates will aid in estimating the main trial duration.”
§ Guidance for using pilot studies to inform the design of intervention trials with continuous outcomes > Example > Pilot study results
plaindirectn = 50- Asserted: passes — The authors put it forward as true.
- Checkable: passes — It can be checked against evidence.
- Load-bearing: passes — The paper’s conclusions depend on it.
- Based: passes — The paper gives a reason why it holds.
Probably not a substantial claim.
None of the sources cited for this claim have been checked yet.
In the paper
“They find that the estimated FACT-G MID is between three and six points29 and an SD estimate from the literature30 is 14 in similar populations.”
§ Guidance for using pilot studies to inform the design of intervention trials with continuous outcomes > Example > Pilot study sample size
What the sources say
- Not checked yetcites [29] Webster K Cella D Yost K The functional assessment of chronic illness therapy (FACIT) measurement system: properties, applications, and interpretation Health Qual Life Outcomes 2003 1 79 14678568 PMC317391
- Not checked yetcites [30] Bell ML McKenzie JE Designing psycho-oncology randomised trials and cluster randomised trials: variance components and intra-cluster correlation of commonly used psychosocial measures Psychooncology 2013 22 8 1738 1747 23080401
hedged- Asserted: passes — The authors put it forward as true.
- Checkable: passes — It can be checked against evidence.
- Load-bearing: passes — The paper’s conclusions depend on it.
- Based: passes — The paper gives a reason why it holds.
It may state two separate claims as one.
In the paper
“Sensitivity analyses should also be performed in the design stage26 and can take the form of accounting for the uncertainty in estimation by calculating sample sizes based on a range of plausible SDs and retention/dropout rates.”
§ Guidance for using pilot studies to inform the design of intervention trials with continuous outcomes > Considerations for trial design > Sensitivity analysis for sample size
What the sources say
- Not checked yetcites [26] Lewis JA Statistical principles for clinical trials (ICH E9): an introductory note on an international guideline Stat Med 1999 18 15 1903 1942 10440877
plain- Asserted: passes — The authors put it forward as true.
- Checkable: passes — It can be checked against evidence.
- Load-bearing: passes — The paper’s conclusions depend on it.
- Based: passes — The paper gives a reason why it holds.
Probably not a substantial claim.
In the paper
“Sensitivity analyses are important to assess the robustness of study results to the assumptions made in the primary analysis.25”
§ Guidance for using pilot studies to inform the design of intervention trials with continuous outcomes > Considerations for trial design > Sensitivity analysis for sample size
What the sources say
- Not checked yetcites [25] Thabane L Mbuagbaw L Zhang S A tutorial on sensitivity analyses in clinical trials: the what, why, when and how BMC Med Res Methodol 2013 13 1 92 23855337 PMC3720188
plain- Asserted: passes — The authors put it forward as true.
- Checkable: fails — It may be too vague to check against evidence.
- Load-bearing: fails — The paper’s conclusions may not depend on it.
- Based: passes — The paper gives a reason why it holds.
Probably not a substantial claim. It may be too vague to check against evidence. The paper’s conclusions may not depend on it.
A conclusion the paper draws from its own results — it cites no other source for it, so there is none to check. The quote shows it is in the paper.
In the paper
“Thus, the objective of the pilot study to provide preliminary evidence of efficacy has been met.”
§ Guidance for using pilot studies to inform the design of intervention trials with continuous outcomes > Example > Pilot study results
plainn = 50- Asserted: passes — The authors put it forward as true.
- Checkable: passes — It can be checked against evidence.
- Load-bearing: fails — The paper’s conclusions may not depend on it.
- Based: passes — The paper gives a reason why it holds.
Probably not a substantial claim. The paper’s conclusions may not depend on it.
In the paper
“For example, if the future trial will be designed around a small effect, then the number of patients per arm for the pilot study should be 25 for 90% power.”
§ Guidance for using pilot studies to inform the design of intervention trials with continuous outcomes > Pilot study sample size
What the sources say
- Not checked yetcites [27] Whitehead A Julious S Cooper C Campbell MJ Estimating the sample size for a pilot randomised trial to minimise the overall trial sample size for the external pilot and main trial for a continuous outcome variable Stat Methods Med Res 2016 25 3 1057 1073 26092476 PMC4876429
plain- Asserted: passes — The authors put it forward as true.
- Checkable: passes — It can be checked against evidence.
- Load-bearing: fails — The paper’s conclusions may not depend on it.
- Based: passes — The paper gives a reason why it holds.
Probably not a substantial claim. The paper’s conclusions may not depend on it.
In the paper
“A CONSORT extension for reporting results of pilot and feasibility studies gives detailed guidelines.9”
§ Guidance for using pilot studies to inform the design of intervention trials with continuous outcomes > Conclusion
What the sources say
- Not checked yetcites [9] Eldridge SM Chan CL Campbell MJ CONSORT 2010 statement: extension to randomised pilot and feasibility trials BMJ 2016 355 i5239 27777223 PMC5076380
plain- Asserted: passes — The authors put it forward as true.
- Checkable: passes — It can be checked against evidence.
- Load-bearing: fails — The paper’s conclusions may not depend on it.
- Based: passes — The paper gives a reason why it holds.
Probably not a substantial claim. The paper’s conclusions may not depend on it.
A conclusion the paper draws from its own results — it cites no other source for it, so there is none to check. The quote shows it is in the paper.
In the paper
“For a 90% powered main trial, they should use a sample size of 25 per arm for the pilot (Table 1).”
§ Guidance for using pilot studies to inform the design of intervention trials with continuous outcomes > Example > Pilot study sample size
plain- Asserted: passes — The authors put it forward as true.
- Checkable: passes — It can be checked against evidence.
- Load-bearing: fails — The paper’s conclusions may not depend on it.
- Based: passes — The paper gives a reason why it holds.
Probably not a substantial claim. The paper’s conclusions may not depend on it.
In the paper
“Browne23 suggested using the pilot study’s upper limit of the 80% CI for the SD to calculate sample size in the subsequent trial.”
§ Guidance for using pilot studies to inform the design of intervention trials with continuous outcomes > Considerations for trial design > Sensitivity analysis for sample size
What the sources say
- Not checked yetcites [23] Browne RH On the use of a pilot sample for sample size determination Stat Med 1995 14 17 1933 1940 8532986
hedged- Asserted: passes — The authors put it forward as true.
- Checkable: passes — It can be checked against evidence.
- Load-bearing: fails — The paper’s conclusions may not depend on it.
- Based: passes — The paper gives a reason why it holds.
Probably not a substantial claim. The paper’s conclusions may not depend on it.
In the paper
“Cocks and Torgerson5 also recommend basing the pilot study size on the future trial’s size, if the SD is known.”
§ Guidance for using pilot studies to inform the design of intervention trials with continuous outcomes > Pilot study sample size
What the sources say
- Not checked yetcites [5] Cocks K Torgerson DJ Sample size calculations for pilot randomized trials: a confidence interval approach J Clin Epidemiol 2013 66 2 197 201 23195919
plain- Asserted: passes — The authors put it forward as true.
- Checkable: passes — It can be checked against evidence.
- Load-bearing: fails — The paper’s conclusions may not depend on it.
- Based: passes — The paper gives a reason why it holds.
Probably not a substantial claim. The paper’s conclusions may not depend on it.
Claims other papers make about this one
Each is checked against this paper’s own text: does it say what the citing paper says it does?
The source backs part of the claim, not all of it — or backs it for a different population, condition or comparison.
In the citing paper
“In order to stablish the sample size required for this trial, we follow recommendations by Bell et al. (2018) which proposed that a sample size of 60 participants would be adequate considering an effect size of 0.3 and 80% of power.”
From Unified Protocol for the transdiagnostic treatment of emotional disorders in people with post COVID-19 condition: study protocol for a multiple baseline n-of-1 trial (2023) · cites this paper as Bell et al., 2018
Experimental — accuracy not yet measuredThe cited source says what the claim attributes to it.
In the citing paper
“CIs and minimal clinically important differences (MCIDs) are presented to suggest plausible evidence of effect for respective study arms.34 35”
The cited source says what the claim attributes to it.
In the citing paper
“Lee et al35 and Bell et al34 suggest using CIs and the MCID to interpret feasibility trials.”
The cited source says what the claim attributes to it.
In the citing paper
“The method of setting the pilot trial sample size was applied [49,50], and the following parameters were chosen to establish the sample size:”
From HAPPY MAMA Project (Part 2)—Maternal Distress and Self-Efficacy: A Pilot Randomized Controlled Field Trial (2022) · cites this paper as [49]
Self-check
Percentages, sums and reported differences re-computed from the paper’s own numbers.
Rated minor: it would not touch a result — a value no result rests on, a p-value that stays on the same side of the significance level, or a conflict that is clerical, resolved elsewhere in the paper, or outside its own findings.
In the paper
“Of the 100 potential participants, 70 participants were referred by their oncologist, 60 participants met eligibility criteria, and 50 participants agreed to participate. This indicates a recruitment rate of 50% of eligible patients”
§ Guidance for using pilot studies to inform the design of intervention trials with continuous outcomes > Example > Pilot study results
Reported 50 · recomputed 83.333333
Citations
Cites
Developing and evaluating complex interventions: the new Medical Research Council guidance
Craig, P., Dieppe, P., Macintyre, S., Michie, S., Nazareth, I., & Petticrew, M. (2008) · BMJ · doi:10.1136/bmj.a1655 · Cited by 10,995
The functional assessment of cancer therapy scale: development and validation of the general measure
Cella, D. F., Tulsky, D. S., Gray, G., Sarafian, B., Linn, E., Bonomi, A., Silberman, M., Yellen, S. B., Winicour, P., & Brannon, J. (1993) · Journal of Clinical Oncology · doi:10.1200/jco.1993.11.3.570 · Cited by 6,020
CONSORT 2010 statement: extension to randomised pilot and feasibility trials.
Eldridge, S. M., Chan, C. L., Campbell, M. J., Bond, C. M., Hopewell, S., Thabane, L., & Lancaster, G. A. (2016) · BMJ · doi:10.1136/bmj.i5239 · Cited by 3,404
A tutorial on pilot studies: the what, why and how
Thabane, L., Ma, J., Chu, R., Cheng, J., Ismaila, A., Rios, L. P., Robson, R., Thabane, M., Giangregorio, L., & Goldsmith, C. H. (2010) · BMC Medical Research Methodology · doi:10.1186/1471-2288-10-1 · Cited by 3,384
CONSORT 2010 statement: extension to randomised pilot and feasibility trials
on behalf of the PAFS consensus group, Eldridge, S. M., Chan, C. L., Campbell, M. J., Bond, C. M., Hopewell, S., Thabane, L., & Lancaster, G. A. (2016) · Pilot and Feasibility Studies · doi:10.1186/s40814-016-0105-8 · Cited by 2,843
Design and analysis of pilot studies: recommendations for good practice
Lancaster, G. A., Dodd, S., & Williamson, P. R. (2004) · Journal of Evaluation in Clinical Practice · doi:10.1111/j..2002.384.doc.x · Cited by 2,572 · cited 1×
“We strongly stress that preliminary efficacy evidence from a pilot study should not be overstated, and researchers should avoid temptation to forgo the main trial.(20,22)”
Whitehead, A. L., Julious, S. A., Cooper, C. L., & Campbell, M. J. (2016) · Statistical Methods in Medical Research · doi:10.1177/0962280215588241 · Cited by 1,936 · cited 2×
“Whitehead et al 27 showed how, if you know the main trial’s target effect size, you can estimate the pilot study’s optimum sample size, minimizing the number of patients recruited across the two studies.”
Self-citation(2003) · Health and Quality of Life Outcomes · doi:10.1186/1477-7525-1-79 · Cited by 1,506
What is a pilot or feasibility study? A review of current practice and editorial policy
Arain, M., Campbell, M. J., Cooper, C. L., & Lancaster, G. A. (2010) · BMC Medical Research Methodology · doi:10.1186/1471-2288-10-67 · Cited by 1,483
On the use of a pilot sample for sample size determination
Browne, R. H. (1995) · Statistics in Medicine · doi:10.1002/sim.4780141709 · Cited by 1,007
Cited by
Sorted by citations
Guidance for conducting feasibility and pilot studies for implementation trials
Pearson, N., Naylor, P.-J., Ashe, M. C., Fernandez, M., Yoong, S. L., & Wolfenden, L. (2020) · Pilot and Feasibility Studies · doi:10.1186/s40814-020-00634-w · Cited by 475
A brief overview of pilot studies and their sample size justification
Kunselman, A. R. (2024) · Fertility and Sterility · doi:10.1016/j.fertnstert.2024.01.040 · Cited by 329
Applying mixed methods to pilot feasibility studies to inform intervention trials
Aschbrenner, K. A., Kruse, G. R., Gallo, J. J., & Clark, V. L. P. (2022) · Pilot and Feasibility Studies · doi:10.1186/s40814-022-01178-x · Cited by 188
“Investigators commonly use quantitative metrics such as recruitment and retention rates to determine whether or not pre-specified feasibility criteria and milestones were met to signal that the research can advance to the next stage of testing [7, 13, 16].”
MethodFontalis, A., Kayani, B., Asokan, A. K., Haddad, I. C., Tahmassebi, J. E., Konan, S., Oussedik, S. I., & Haddad, F. S. (2022) · Journal of Bone and Joint Surgery · doi:10.2106/jbjs.22.00167 · Cited by 85
Power Analysis and Exploratory Research
Haile, Z. T. (2023) · Journal of Human Lactation · doi:10.1177/08903344231195625 · Cited by 91
“However, alternative strategies for calculating sample sizes for pilot studies have recently been proposed (Bell et al., 2018; Julious, 2016).”
BackgroundGreen, J. E., Berk, M., Mohebbi, M., Loughman, A., McGuinness, A. J., Castle, D. J., Chatterton, M. L., Perez, J., Strandwitz, P., Athan, E., et al. (2023) · The Canadian Journal of Psychiatry · doi:10.1177/07067437221150508 · Cited by 87
Bell, M. L., Dhillon, H. M., Bray, V., & Vardy, J. L. (2018) · Journal of Patient-Reported Outcomes · doi:10.1186/s41687-018-0071-4 · Cited by 66
Self-citationDetermining sample size for pilot trials: a tutorial
Ying, X., Freedland, K. E., Powell, L. H., Stuart, E. A., Ehrhardt, S., & Mayo‐Wilson, E. (2025) · BMJ · doi:10.1136/bmj-2024-083405 · Cited by 64
Pile, V., Smith, P. A., Leamy, M. C., Oliver, A., Bennett, E., Blackwell, S. E., Meiser‐Stedman, R., Stringer, D., Dunn, B. D., Holmes, E. A., et al. (2021) · Behaviour Research and Therapy · doi:10.1016/j.brat.2021.103876 · Cited by 42
Schifino, G., Vega, M. L., Pisani, L., Prediletto, I., Catalanotti, V., Comellini, V., Bassi, I., Zompatori, M., Ranieri, V. M., & Nava, S. (2022) · European Journal of Internal Medicine · doi:10.1016/j.ejim.2022.04.012 · Cited by 38
“To reach a statistical power of almost 80%, we assumed to enroll 20 subjects with a minimum of 12 subjects having full data available, [15,16, 17].”
Derruau, S., Robinet, J., Untereiner, V., Piot, O., Sockalingum, G. D., & Lorimier, S. (2020) · Molecules · doi:10.3390/molecules25184142 · Cited by 37
“Only publications with both a clinically and/or a histopathologically confirmed disease and a control group, each containing more than 20 participants, were included [40,68].”
ResultMonthé‐Drèze, C., Sen, S., Mouzon, S. H., & Catalano, P. M. (2021) · Nutrients · doi:10.3390/nu13020578 · Cited by 41
“However, the current pilot study’s sample size was optimal in order to inform a future large RCT with 80% power to detect small-tomoderate effect size in fetal adiposity [68].”
BackgroundYeung, C. Y., Ho, K. H. M., & Chan, H. Y. L. (2023) · BMC Geriatrics · doi:10.1186/s12877-023-03815-3 · Cited by 32
Jolley, S., Johns, L. C., O’Donoghue, E., Oliver, J., Khondoker, M., Byrne, M., Butler, L., De Rosa, C., Leal, D., McGovern, J., et al. (2020) · British Journal of Clinical Psychology · doi:10.1111/bjc.12265 · Cited by 26
Armour, M., Parry, K. A., Curry, C., Ferfolja, T., Parker, M. A., Farooqi, T., MacMillan, F., Smith, C. A., & Holmes, K. (2022) · Journal of Psychosomatic Research · doi:10.1016/j.jpsychores.2022.111038 · Cited by 27
New guidance to improve sample size calculations for trials: eliciting the target difference
Bell, M. L. (2018) · Trials · doi:10.1186/s13063-018-2894-y · Cited by 27
Self-citationRuangsomboon, O., Limsuwat, C., Praphruetkit, N., Monsomboon, A., & Chakorn, T. (2020) · Academic Emergency Medicine · doi:10.1111/acem.14187 · Cited by 27
“3), and the future main trial would be powered at 90%.(29) However, due to the coronavirus disease 2019 pandemic, trials involving NHF use outside negative-pressure rooms had to be suspended.”
BackgroundPatterson, B., Barton, C. J., Culvenor, A. G., Cooper, R., & Crossley, K. M. (2021) · BMC Musculoskeletal Disorders · doi:10.1186/s12891-020-03919-6 · Cited by 33
Oswald, L. B., Morales-Cruz, J., Eisel, S. L., Rio, J. D., Hoogland, A. I., Ortiz-Rosado, V., Soto-Lopez, G., Rodriguez-Rivera, E., Savard, J., Castro, E., et al. (2022) · Journal of Behavioral Medicine · doi:10.1007/s10865-022-00313-6 · Cited by 27
“To plan for a future RCT with 90% power to detect a medium effect, a sample of 15 participants per arm was considered acceptable (total recruitment goal N = 30) (Bell et al., 2018).”
BackgroundLogie, C. H., Okumu, M., Loutet, M. G., Berry, I., Lukone, S. O., Kisubi, N., Mwima, S., & Kyambadde, P. (2022) · Global Public Health · doi:10.1080/17441692.2022.2092178 · Cited by 25
“To assess feasibility (Bell et al., 2018), we collected information on process (e.g. recruitment rates), resources (e.g. retention, survey completion length), management (e.g. time and capacity required to implement intervention), and scienti fi c outcomes (e.g. survey challenges, estimated…”
MethodFerreres-Galán, V., Navarro-Haro, M. V., Peris-Baquero, Ó., Guillén-Marín, S., de Luna-Hermoso, J., & Osma, J. (2022) · International Journal of Environmental Research and Public Health · doi:10.3390/ijerph19095715 · Cited by 21
Pilot Trial of a Sleep-Promoting Intervention for Children With Type 1 Diabetes
Jaser, S. S., Bergner, E. M., Hamburger, E., Bhatia, S. H., Lyttle, M., Bell, G. E., Slaughter, J. C., Malow, B. A., & Simmons, J. H. (2020) · Journal of Pediatric Psychology · doi:10.1093/jpepsy/jsaa105 · Cited by 21
“We aimed for a sample of 20 per intervention arm, as we would expect to target small effect sizes in a larger trial (Bell et al., 2018).”
Methodde Bruin, E. D., Baur, H., Bruelhart, Y., Luijckx, E., Hinrichs, T., & Rogan, S. (2020) · Frontiers in Medicine · doi:10.3389/fmed.2020.507155 · Cited by 19
Crowley, P., Ikeda, E., Islam, S. M. S., Kildedal, R., Jacobsen, S. S., Larsen, J. R., Johansson, P. J., Hettiarachchi, P., Aadahl, M., Mork, P. J., et al. (2022) · JMIR Research Protocols · doi:10.2196/35697 · Cited by 19
“Based on the rules of thumb presented in a recent guidance on using pilot studies to inform the design of intervention trials with continuous outcomes, a sample size of approximately 200-250 participants will be required for our evaluation [20].”
MethodHyatt, A., Gough, K., Murnane, A., Au‐Yeung, G., Dawson, T., Pearson, E. J. M., Dhillon, H. M., Sandhu, S. K., Williams, N., Paton, E., et al. (2020) · BMJ Open · doi:10.1136/bmjopen-2019-036059 · Cited by 19
Effects of a Massage Protocol in Tensiomyographic and Myotonometric Proprieties
Pérez‐Bellmunt, A., Labata‐Lezaun, N., Llurda-Almuzara, L., Rodríguez‐Sanz, J., González-Rueda, V., Bueno-Gracía, E., Çelik, D., & López-de–Celis, C. (2021) · International Journal of Environmental Research and Public Health · doi:10.3390/ijerph18083891 · Cited by 19
“A pilot study (n = 10) was carried out in order to set the sample calculation [28].”
MethodFrostholm, L., & Rask, C. U. (2019) · Clinical Psychology in Europe · doi:10.32872/cpe.v1i1.32217 · Cited by 18
Barabasch, A., Riemann-Lorenz, K., Kofahl, C., Scheiderbauer, J., Eklund, D., Kleiter, I., Kasper, J., Köpke, S., Lezius, S., Zapf, A., et al. (2021) · Pilot and Feasibility Studies · doi:10.1186/s40814-020-00749-0 · Cited by 18
Lawrence, M. R., Arnetz, J. E., Counts, S., Ahmed, A., & Arnetz, B. B. (2025) · PLoS ONE · doi:10.1371/journal.pone.0315486 · Cited by 16
“While formal power calculations are not required for pilot studies [38], it was important to have a sufficient sample size to examine the feasibility of recruiting participants with and without long COVID, and whether differences could be detected between groups [39].”
Logie, C. H., Okumu, M., Lukone, S. O., Loutet, M. G., McAlpine, A., Latif, M., Berry, I., Kisubi, N., Mwima, S., Kyambadde, P., et al. (2021) · Global Health Action · doi:10.1080/16549716.2021.1940763 · Cited by 20
“The primary outcomes to measure feasibility [51] of the Ngutulu Kagwero intervention were: 1) process, including recruitment rates; 2) resources, including retention rates, adherence, comprehension of surveys, length of time for survey completion, management of eligibility criteria; 3) management, including time and c…”
BackgroundMethodCaperchione, C. M., Sabiston, C. M., Stolp, S., Bottorff, J. L., Campbell, K. L., Eves, N. D., Ellard, S. L., Gotay, C. C., Sharp, P., Pullen, T., et al. (2019) · BMC Cancer · doi:10.1186/s12885-019-5470-2 · Cited by 16
Evans, S., Olive, L., Dober, M., Knowles, S., Fuller-Tyszkiewicz, M., O, E., Gibson, P., Raven, L., Gearry, R., McCombie, A., et al. (2022) · BMJ Open · doi:10.1136/bmjopen-2021-060272 · Cited by 15
Lapierre, A., Lavoie, P., Castonguay, V., Lonergan, A.-M., & Arbour, C. (2023) · International Emergency Nursing · doi:10.1016/j.ienj.2022.101261 · Cited by 16
Behrendt, D., Boß, L., Hannibal, S., Kunzler, A. M., Wessa, M., & Lehr, D. (2023) · Internet Interventions · doi:10.1016/j.invent.2023.100649 · Cited by 18
Poli, A., Maremmani, A. G. I., Gemignani, A., & Miccoli, M. (2022) · Behavioral Sciences · doi:10.3390/bs12030074 · Cited by 17
“Following recommendations to carry out pilot investigations, a minimum sample size of 12 per group was considered [43] in order to carry out our pilot trial [44,45].”
MethodDigital Therapeutic Self‐Management Intervention in Adolescents With Inflammatory Bowel Disease
Hommel, K. A., Ramsey, R. R., Gray, W. N., & Denson, L. A. (2022) · Journal of Pediatric Gastroenterology and Nutrition · doi:10.1097/mpg.0000000000003623 · Cited by 14
“Although this trial was aimed at determining feasibility and preliminary efficacy, we exceeded the recommended sample size (n = 20) for a pilot trial designed to inform a larger efficacy trial with 80% power to detect a medium effect (18).”
MethodImproving the Quality of Pilot/Feasibility Trials Reporting in Pediatric Psychology
Hilliard, M. E., Modi, A. C., & Palermo, T. M. (2021) · Journal of Pediatric Psychology · doi:10.1093/jpepsy/jsab056 · Cited by 14
Hesketh, K., Low, J., Andrews, R., Blitz, S., Buckley, B., Falkenhain, K., Job, J., Jones, C. A., Jones, H., Jung, M. E., et al. (2025) · BMJ Open · doi:10.1136/bmjopen-2024-092260 · Cited by 13
Haines, K. J., Hibbert, E., Skinner, E. H., Leggett, N. E., Holdsworth, C., Abdelhamid, Y. A., Bates, S., Bicknell, E., Booth, S., Carmody, J., et al. (2024) · Australian Critical Care · doi:10.1016/j.aucc.2024.01.006 · Cited by 13
Pozzar, R. A., Enzinger, A. C., Howard, C., Tavormina, A., Matulonis, U. A., Campos, S., Liu, J. F., Horowitz, N., Konstantinopoulos, P. A., Krasner, C. N., et al. (2024) · Gynecologic Oncology · doi:10.1016/j.ygyno.2024.06.001 · Cited by 13
Taney, K. G., Smith, M. M., Cummings, N. P., & Lozano, A. J. (2021) · Frontiers in Veterinary Science · doi:10.3389/fvets.2021.762842 · Cited by 12
“, odds ratios) to inform future studies (18).”
BackgroundLatif, A. I., Sjattar, E. L., & Erika, K. A. (2020) · Enfermería Clínica · doi:10.1016/j.enfcli.2019.07.069 · Cited by 12
Gonot-Schoupinsky, F., Garip, G., Sheffield, D., Omar, O., & Arora, T. (2020) · Contemporary Clinical Trials Communications · doi:10.1016/j.conctc.2020.100676 · Cited by 12
Feneberg, A. C., Kappert, M. B., Maidhof, R. M., Doering, B. K., Olbrich, D., & Nater, U. M. (2020) · Frontiers in Psychiatry · doi:10.3389/fpsyt.2020.518316 · Cited by 13
“Therefore, following the recommendations mentioned in (122, 123) and (124), we decided to test 30 participants in each group.”
MethodNgaage, D. L., Mitchell, N., Dean, A., Mitchell, A. S., Hinde, S., Akowuah, E., Doherty, P., Nichols, S., Fairhurst, C. M., Flemming, K., et al. (2023) · Pilot and Feasibility Studies · doi:10.1186/s40814-023-01304-3 · Cited by 11
“The ISWT was summarised descriptively at each timepoint, with the standard deviation being estimated alongside an 80% confidence interval in line with current guidance on estimation of standard deviations from feasibility trials [17, 18].”
MethodAmoah, I., Cairncross, C., & Rush, E. C. (2023) · Food Science & Nutrition · doi:10.1002/fsn3.3327 · Cited by 10
Pisani, L., Vega, M. L., Ageno, E., Prediletto, I., Dongilli, R., Catalanotti, V., Giancotti, G., & Nava, S. (2024) · Pulmonology · doi:10.1080/25310429.2024.2411813 · Cited by 10
Tschenett, H., Vafai-Tabrizi, F., Zwick, R. H., Valipour, A., Funk, G., & Nater, U. M. (2025) · Respiratory Research · doi:10.1186/s12931-025-03243-4 · Cited by 13
“…randomized controlled trial (step 3), and to gather preliminary data on the intervention’s effects to inform power calculations and determine which observed trends may be promising for further investigation in a future definitive trial (based on recommendations for pilot studies [22–24]).”
InfluentialDobbs, D., Yauk, J., Vogel, C. E., Fanfan, D., Buck, H. G., Haley, W. E., & Meng, H. (2023) · The Gerontologist · doi:10.1093/geront/gnad018 · Cited by 13
Ditton, E., Knott, B., Hodyl, N., Horton, G., Walker, F. R., & Nilsson, M. (2023) · JMIR Formative Research · doi:10.2196/43263 · Cited by 9
“The collection of these data can provide information about how psychological skill training apps are experienced in real-world contexts among medical student end users [32,34], unexpected methodological issues and barriers [32], and factors that may affect engagement [34,35].”
BackgroundMethodMundal, I. P., Gråwe, R. W., Hafstad, H., Cuevas, C. D. L., & Lara‐Cabrera, M. L. (2020) · BMJ Open · doi:10.1136/bmjopen-2020-039852 · Cited by 11
Munshi, R., Karande-Patil, S., Kumbhar, D. A., Deshmukh, A., & Hingorani, L. (2023) · Journal of Ayurveda and Integrative Medicine · doi:10.1016/j.jaim.2023.100806 · Cited by 9
“As this was a Proof-of-Concept Study, with no previous clinical results available with this formulation, a sample size of 60 participants (30 in each group) was considered adequate to address the study objectives [47 e 49].”
MethodQuilez-Orden, A. B., Ferreres-Galán, V., & Osma, J. (2020) · International Journal of Environmental Research and Public Health · doi:10.3390/ijerph17176155 · Cited by 9
“To calculate the sample size, we drew on a study that proposed stepwise rules of thumb for pilot studies based on the target effect size and the size of the future trial [40].”
MethodSample size planning for pilot studiesPreprint
Tseng, C., & Sim, D. (2021) · arXiv (Cornell University) · doi:10.48550/arxiv.2105.05483 · Cited by 21
The Relationship between Toxic Leadership Behavior and Employee Silence: A Quantitative StudyPreprint
Coakley, N. (2021) · SSRN Electronic Journal · doi:10.2139/ssrn.3893817 · Cited by 9
Sharp, P., Stolp, S., Bottorff, J. L., Oliffe, J. L., Hunt, K., & Caperchione, C. M. (2020) · Health Promotion International · doi:10.1093/heapro/daaa120 · Cited by 10
Saulnier, K. G., Koscinski, B., Flynt, S., Accorso, C., & Allan, N. P. (2023) · Cognitive Behaviour Therapy · doi:10.1080/16506073.2023.2288551 · Cited by 9
“Despite limitations of using pilot data to estimate expected effect sizes for definitive trials (Bell et al., 2018), these results suggest an RCT could aim for at least a medium effect size.”
MethodKadam, A., Wani, S. K., Gadekar, G. N., Katage, G., Garg, K., & Mungikar, S. (2024) · Archives of Orthopaedic and Trauma Surgery · doi:10.1007/s00402-024-05347-w · Cited by 9
Furlano, J. A., & Nagamatsu, L. S. (2020) · Canadian Journal of Diabetes · doi:10.1016/j.jcjd.2020.11.001 · Cited by 8
Poli, A., Gemignani, A., & Miccoli, M. (2022) · International Journal of Environmental Research and Public Health · doi:10.3390/ijerph19137684 · Cited by 8
“In order to conduct our pilot study [63,64], a minimum sample size of 12 per group was considered [65].”
BackgroundWilson, J. R. M., Doty, S., Petitt, J. C., El-Abtah, M. E., Francis, J. J., Sharpe, M. G., Kelly, M. L., & Anderson, K. D. (2022) · Frontiers in Neurology · doi:10.3389/fneur.2022.1033386 · Cited by 8
“Calculating the eligibility rate and the retention rate from this trial will also be helpful in estimating the duration of a future efficacy trial (22).”
BackgroundMethodKeinert, M., Eskofier, B. M., Schuller, B. W., Böhme, S., & Berking, M. (2023) · Pilot and Feasibility Studies · doi:10.1186/s40814-023-01386-z · Cited by 9
“Therefore, we will include n = 10 participants per study group (i.e., N = 80 in total) as suggested by Bell and colleagues [68] for pilot studies with expected medium to large effect sizes.”
Luo, H., Galvao, D. A., Newton, R. U., Tang, C., Dean, A. P., Jasas, K., Johansson, M., Yusoff, I. F., Spry, N. A., & Taaffe, D. R. (2021) · BMJ Open Gastroenterology · doi:10.1136/bmjgast-2021-000642 · Cited by 8
Sharma, M., Kanekar, A. S., Batra, K., Hayes, T., & Lakhan, R. (2022) · Healthcare · doi:10.3390/healthcare10040614 · Cited by 9
“01 for a two-tailed test) were established as a priori, given the generally accepted recommendations from previous studies [36,37].”
Rahman, H. (2023) · Indian Journal of Community Medicine · doi:10.4103/ijcm.ijcm_404_22 · Cited by 7
“Study procedures According to Melanie L Bell 2018,[11] a sample size of 30 trial participants with 15 in each group was taken for this pilot study.”
MethodWhite, M. J., Zaccaria, I., Ennahdi-Elidrissi, F., Putzu, A., Dimassi, S., Luise, S., Diaper, J., Mulin, S., Baudat, A., Gil-Wey, B., et al. (2024) · British Journal of Anaesthesia · doi:10.1016/j.bja.2024.05.020 · Cited by 7
Plow, M. A., Moore, S. M., Chang, J. H., Bachhal, E., & Sparks, K. E. (2019) · Patient Education and Counseling · doi:10.1016/j.pec.2019.08.007 · Cited by 7
Williams, R. D., Housman, J. M., & McDonald, J. D. (2020) · Health Promotion Practice · doi:10.1177/1524839919882385 · Cited by 7
Mairal, J. B., Fernández, E. N., & Polanski, T. (2021) · International Journal of Environmental Research and Public Health · doi:10.3390/ijerph18199981 · Cited by 7
Kirthi, V., Zuckerman, B. P., Alam, U., Bunce, C., Hopkins, D., & Jackson, T. L. (2021) · Retina · doi:10.1097/iae.0000000000003337 · Cited by 7
Technology-Assisted Stepped-Care to Promote Adherence in Adolescents with Asthma: A Pilot Study
Ramsey, R. R., Plevinsky, J. M., Guilbert, T. W., Carmody, J. K., & Hommel, K. A. (2022) · Journal of Clinical Psychology in Medical Settings · doi:10.1007/s10880-022-09905-5 · Cited by 8
“A target sample size of 30 was set to exceed the recommended sample size (n = 20) for a pilot trial designed to inform a larger efficacy trial with 80% power to detect a medium effect (Bell et al., 2018).”
Perception of Open Science in the Scientific Community of the Republic of Moldova
Țurcan, N., Cuciureanu, G., Cujba, R., Lupu, V., Cheradi, N., & Cojocaru, I. (2022) · Postmodern Openings · doi:10.18662/po/13.4/519 · Cited by 9
“The questions were adapted through a pilot study to validate the feasibility of the study (2017), to test trial methods and procedures (Bell et al., 2018), to meet the understanding of the later targeted large respondents before the distribution (Mahfooz & Othman, 2021) and to estimate the time required to complete th…”
MethodKelpin, S. S., Brockman, T. A., Decker, P. A., Young, A. M., Boehmer, K. R., Nguyen, A., Kamath, C. C., Sauver, J. S., Sinicrope, P. S., Sharma, P., et al. (2024) · Communications Medicine · doi:10.1038/s43856-024-00624-6 · Cited by 6
“Based on sample size recommendations for pilot studies using continuous outcome variables 38 we determined that with 30 participants randomly assigned to each of the three study arms (total N = 90), this sample size would provide greater than 90% power with two-sided 5% signi fi cance to detect a…”
Liu, S., Wegner, L., Haucke, M. N., Gates, J., Adam, M., & Bärnighausen, T. (2023) · JMIR Formative Research · doi:10.2196/43036 · Cited by 5
“size was at least 50 participants per arm, which would be sufficient to evaluate the study design feasibility [57-60].”
Krieger, J. F., Kristensen, E., Marquardsen, M., Ofer, S., Mortensen, E. L., & Giraldi, A. G. E. (2023) · Sexual Medicine · doi:10.1093/sexmed/qfad033 · Cited by 6
Gates, P., Dhillon, H. M., Krishnasamy, M., Wilson, C. J., & Gough, K. (2024) · Supportive Care in Cancer · doi:10.1007/s00520-024-08441-2 · Cited by 6
Krch, D., Lequerica, A. H., Arelis, A. A., Barajas, B. V. R., Arango‐Lasprilla, J. C., & Chiaravalloti, N. D. (2019) · Neurorehabilitation · doi:10.3233/nre-192808 · Cited by 6
“We utilized a method recommended by several authors (Bell, Whitehead, & Julious, 2018; Cocks & Torgerson, 2013) that estimates the pilot sample size based upon the target effect size of a future trial.”
Anderson, L. A., Kildea, S. V., Lee, N., Kynoch, K., & Gao, Y. (2022) · Journal of Human Lactation · doi:10.1177/08903344221088789 · Cited by 6
“…general guidelines for pilot studies, including a general rule of at least 30 participants and a minimum sample size of 12 participants per group (Bell et al., 2018; Whitehead et al., 2016); (2) the estimated timeframe to complete the study; and (3) the number of preterm births at the research…”
BackgroundHyatt, A., Lipson‐Smith, R., Gough, K., Butow, P. N., Jefford, M., Hack, T. F., Hale, S. B., Zucchi, E., White, S. C., Ozoliņš, U., et al. (2022) · Contemporary Clinical Trials Communications · doi:10.1016/j.conctc.2022.100932 · Cited by 6
“Note, however, responses to study measures were not used to estimate the population variance or potential efficacy because the sample size was too small to ensure precise estimation [19].”
BackgroundPatten, C. A., Brockman, T. A., Kelpin, S. S., Sinicrope, P. S., Boehmer, K. R., Sauver, J. L. S., Lampman, M. A., Sharma, P., Reinicke, N. M., Huang, M. S., et al. (2022) · Contemporary Clinical Trials · doi:10.1016/j.cct.2022.106838 · Cited by 6
“This sample size will result in > 90% power with two-sided 5% significance to detect a small effect size (~1 standard deviation unit) between study groups for the primary intent-to-treat (ITT) analysis [22].”
Furlano, J. A., & Nagamatsu, L. S. (2019) · BMJ Open · doi:10.1136/bmjopen-2019-032047 · Cited by 6
Nair, U. S., Miller, E. S., Bell, M. L., ALLEN, S. S., Collins, B. N., & Allen, A. M. (2020) · Contemporary Clinical Trials Communications · doi:10.1016/j.conctc.2020.100569 · Cited by 6
Self-citationBuro, A. W., Baskin, M. L., Miller, D. R., Ward, T., West, D. S., Gore, L. R., Gwede, C. K., Epel, E. S., & Carson, T. L. (2022) · BMC Public Health · doi:10.1186/s12889-022-12519-z · Cited by 6
“As these measures were taken at 3 months, and the current study is assessing 6-month weight loss, larger effects are likely; however, to reduce the likelihood of using an effect size which is too large [29], the study has been powered for a Cohen’s d of 0.”
BackgroundGordon, J. S., Giacobbi, P. R., Armin, J. S., Nair, U. S., Bell, M. L., & Alleman, G. P. (2019) · Contemporary Clinical Trials Communications · doi:10.1016/j.conctc.2019.100437 · Cited by 7
“This sample size is large enough to reasonably estimate, in conjunction with sensitivity analysis, relevant variance components, recruitment, and dropout rates for use in a future definitive trial [40,41].”
BackgroundSelf-citationArmour, M., Parry, K. A., Curry, C., Ferfolja, T., Parker, M., Farooqi, T., MacMillan, F., Smith, C. T., & Holmes, K. (2021) · Research Square · doi:10.21203/rs.3.rs-841718/v1 · Cited by 6
Mannocci, A., Ciavardini, S., Mattioli, F., Massimi, A., D’Egidio, V., Lia, L., Scaglietta, F., Giannini, A., Antico, R., Dorelli, B., et al. (2022) · International Journal of Environmental Research and Public Health · doi:10.3390/ijerph19031461 · Cited by 5
“3 (small effect) [49], namely that the EPDS mean in the IG was lower 4.”
BackgroundMethodGraetz, I., Hernandez, S., Arshad, S., Byers, K., Meisel, J. L., Sadigh, G., Sakach, E. A., Gogineni, K., & Torres, M. A. (2024) · JCO Oncology Practice · doi:10.1200/op.24.00031 · Cited by 6
Piloting a team-based telemedicine care for hypertension focused on Black patients
Manandhar, S., Chhetri, S., Sutton, D., Saha, A., Kaur, S., Brown, J., Williamson, J. D., Callahan, K. E., Moore, J. B., Taylor, Y. J., et al. (2025) · Pilot and Feasibility Studies · doi:10.1186/s40814-025-01656-y · Cited by 5
“With an estimated 20% drop out rate [19], 20 patients would allow us to evaluate retention with 18% margin of error at the 95% confidence interval [20, 21].”
Donath, V. M., Ries, E. S., Mariegaard, L. S., Kristensen, T. D., Ebdrup, B. H., Strauss, G. P., Fisher, P. M., Rostrup, E., Nordentoft, M., Hilker, R. W., et al. (2025) · PLoS ONE · doi:10.1371/journal.pone.0331632 · Cited by 4
“The sample size of the present feasibility study is set at n = 30 in line with recommendations for pilot studies [41,42].”
Pilot study of an app-supported psychosocial prevention intervention: a mixed-methods approach
Gehrmann, J., Stephan, J., Dehner, J., Stullich, A., Richter, M., PE³PP study group, Ballaschke, O., Finke, F., Gabel, F., Grossmann, A., et al. (2025) · Pilot and Feasibility Studies · doi:10.1186/s40814-025-01737-y · Cited by 5
“This approach is consistent with guidance that pilot studies should be large enough to estimate parameters for a future main study with reasonable precision, but not powered for effectiveness testing [56–60].”
Surendran, A., McSharry, J., Meredith, D., McNamara, J. G., Bligh, F., Meade, O., & O’Hora, D. P. (2023) · Pilot and Feasibility Studies · doi:10.1186/s40814-023-01319-w · Cited by 5
Gates, P., Green, H. J., Gough, K., Dhillon, H. M., Vardy, J. L., Dickinson, M. J., Guarnera, J., Krishnasamy, M., Livingston, P. M., WHITE, V. M., et al. (2024) · BMJ Open · doi:10.1136/bmjopen-2023-081084 · Cited by 5
“Differences in test/(sub)scale scores at follow-up will be summarised using a mean and 95% CI, as well as 75% and 85% confidence intervals; these will be compared with estimates of minimum clinically important differences, 32 where available.”
BackgroundMethodMood and influenza vaccination in older adults: A randomized controlled trial.
Ayling, K., Fairclough, L. C., Buchanan, H., Wetherell, M. A., & Vedhara, K. (2019) · Health Psychology · doi:10.1037/hea0000786 · Cited by 5
“Second, while we note due caution is warranted in overextrapolating effect size estimations from pilot trials (Bell & Julious, 2018; Kraemer, Mintz, Noda, Tinklenberg, & Yesavage, 2015; Leon, Davis, & Kraemer, 2011), effect sizes of the magnitude observed here are not necessarily trivial when the…”
Reddy, A. V., Hill, C., Zheng, L., He, J. P., & Narang, A. K. (2022) · Radiation Oncology · doi:10.1186/s13014-022-02145-9 · Cited by 5
“A sample size of 20 patients was chosen because this will enable safety evaluation using a closely monitored Bayesian stopping rule and is also recommended by the literature [21, 22].”
MethodKeinert, M., Schindler‐Gmelch, L., Eskofier, B. M., & Berking, M. (2024) · International Journal of Cognitive Therapy · doi:10.1007/s41811-024-00218-z · Cited by 5
Lambert, S., Duncan, L. R., Ellis, J., Robinson, J. W., Sears, C. S., Culos-Reed, N. S., Matthew, A., de Raad, M., Schaffler, J. L., Mina, D. S., et al. (2021) · Pilot and Feasibility Studies · doi:10.1186/s40814-021-00791-6 · Cited by 6
Bai, R., Batra, K., Yap, C., & Izuora, K. E. (2023) · The American Journal of the Medical Sciences · doi:10.1016/j.amjms.2023.04.003 · Cited by 5
Ottesen, A. R., Banna, S., & Alzougool, B. (2023) · Energies · doi:10.3390/en16093756 · Cited by 5
Feasibility of a Group-Based Telerehabilitation Intervention for Long COVID Management.Preprint
King, M., Byrne, A., Denehy, L., Graham, P. L., Douglas, B., de Toni, P., Santos, A., Kitson, E., Pang, A., Bartos, E. M., et al. (2022) · Research Square · doi:10.21203/rs.3.rs-1452186/v1 · Cited by 5
Usability of Videoconferencing for Physical Exercise Interventions in Older Adults: Scoping Review
Robin, L., Mandigout, S., Batcho, C. S., Gelineau, A., & Borel, B. (2025) · JMIR Rehabilitation and Assistive Technologies · doi:10.2196/65552 · Cited by 4
Metadata
- Authors
- Bell, M. L., Whitehead, A. L., & Julious, S. A.
- Affiliations
- University of Arizona (US)
- University of Sheffield (GB)
- Corresponding author
- Bell, Melanie L
- Venue
- Clinical Epidemiology
- Publisher
- Informa UK Limited
- Published
- 2018-01
- Volume
- Volume 10
- Pages
- 153-157
- ISSN
- 1179-1349 (ISSN-L)
- PMC
- PMC5779280
- OpenAlex
- W2783709266
- Semantic Scholar
- cfec5aaa40794375792112254874a4c92fb0bf5e
- Cited by
- 280
- References
- 32
- Citations by year
- 2026: 37 · 2025: 52 · 2024: 22 · 2023: 48 · 2022: 43 · 2021: 37 · 2020: 26 · 2019: 12 · 2018: 3
- FWCI
- 16.18
- Type
- journal article
- Language
- en
- Open access
- gold
- doi.org
- Licence
- Locations
- Clinical Epidemiology (publishedVersion, cc-by-nc)
- Europe PMC (PubMed Central) (publishedVersion, cc-by-nc)
- PubMed Central (publishedVersion, cc-by-nc)
- PubMed (publishedVersion)
- White Rose Research Online (University of Leeds, The University of Sheffield, University of York) (acceptedVersion)
- ePrints Soton (University of Southampton) (acceptedVersion)
- UA Campus Repository (The University of Arizona) (acceptedVersion, cc-by-nc)
- Dove Medical Press (Taylor and Francis Group) (submittedVersion, cc-by-nc)
- Funders
- University of Southampton
- National Cancer Institute (P30CA023074)
- Topics
- Physical Sciences › Mathematics › Statistics and Probability › Statistical Methods in Clinical Trials
- Physical Sciences › Mathematics › Statistics and Probability › Statistical Methods in Epidemiology
- Social Sciences › Decision Sciences › Statistics, Probability and Uncertainty › Meta-analysis and systematic reviews
- Keywords
- pilot study, trial design, sample size determination, sensitivity analysis, continuous outcomes, population variance estimation
About these checks
Registry, retraction, Cites and statistics results are computed, not judged, with one exception: a printed reference that no index lists is read once by a model before it counts as a citation error. Claims are extracted by a model and kept only when their quote appears verbatim in the text; each cited source is then checked, with a model’s help, for whether it says what the claim relies on. Those verdicts can be wrong — read the claim’s quote and the cited source before relying on one.
A language model drew the claims from the paper on 2026-10-09, under version 3 of the claim definition (model deepseek-v4.1-flash, prompt extract-v3).
A second model labelled each claim on 2026-10-09 (model jev-1.13-20260917, definition revision gold-guideline-v0.2).
Statistics and arithmetic are recomputed, not judged.
Confidence bands are shown only for fields calibrated on our annotated test set. None is calibrated yet, so no band is shown.
What counts as a claim ›How we measure confidence ›How we check this ›
Are you an author, or do you see a problem with this page? Request a review
