

The DOI matches its Crossref record; 160 of the 161 references it cites were found in a registry or an index.
Optical Stimulation of Neurons
Open accessAbstract
Our capacity to interface with the nervous system remains overwhelmingly reliant on electrical stimulation devices, such as electrode arrays and cuff electrodes that can stimulate both central and peripheral nervous systems. However, electrical stimulation has to deal with multiple challenges, including selectivity, spatial resolution, mechanical stability, implant-induced injury and the subsequent inflammatory response. Optical stimulation techniques may avoid some of these challenges by providing more selective stimulation, higher spatial resolution and reduced invasiveness of the device, while also avoiding the electrical artefacts that complicate recordings of electrically stimulated neuronal activity. This review explores the current status of optical stimulation techniques, including optogenetic methods, photoactive molecule approaches and infrared neural stimulation, together with emerging techniques such as hybrid optical-electrical stimulation, nanoparticle enhanced stimulation and optoelectric methods. Infrared neural stimulation is particularly emphasised, due to the potential for direct activation of neural tissue by infrared light, as opposed to techniques that rely on the introduction of exogenous light responsive materials. However, infrared neural stimulation remains imperfectly understood, and techniques for accurately delivering light are still under development. While the various techniques reviewed here confirm the overall feasibility of optical stimulation, a number of challenges remain to be overcome before they can deliver their full potential.
Overview
The claims and statistics of this paper haven’t been checked yet.
Run the check — free, no account needed. It reads the open-access text and checks the sources it cites.
Integrity signals
Registry
Cites
Statistics
Figures
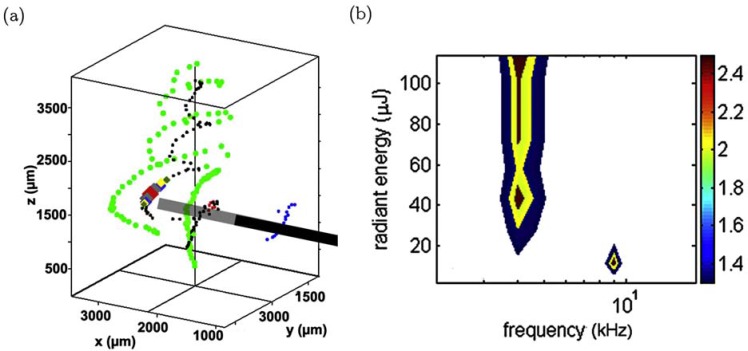
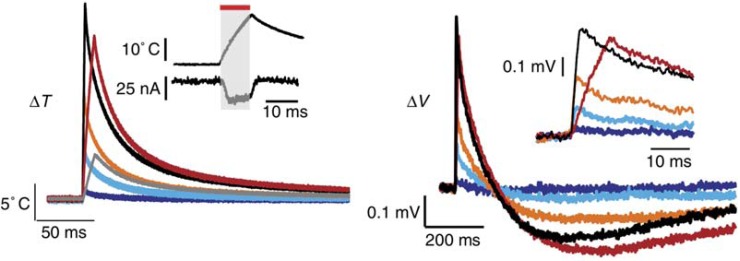
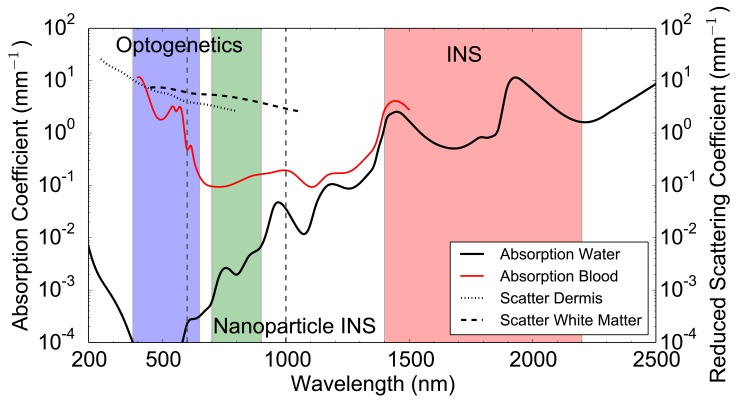
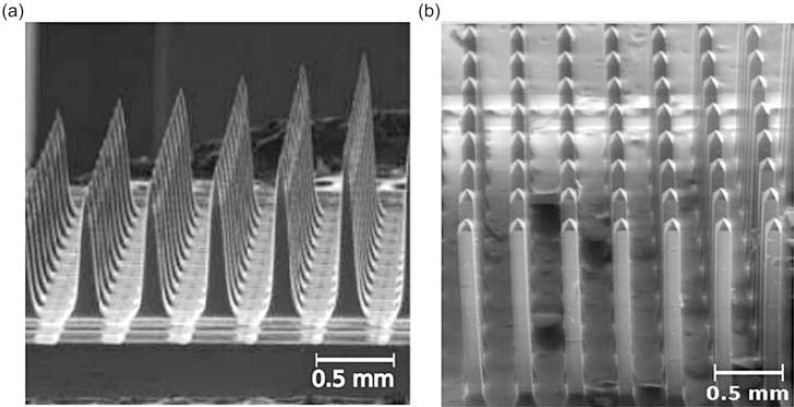
Verification
Claims the paper makes
The claims and statistics of this paper haven’t been checked yet.
Run the check — free, no account needed. It reads the open-access text and checks the sources it cites.
Claims other papers make about this one
Each is checked against this paper’s own text: does it say what the citing paper says it does?
The source backs part of the claim, not all of it — or backs it for a different population, condition or comparison.
In the citing paper
“ChR2 responds to blue (470 nm) lights to depolarise a neuron, and HR exhibits sensitivity toward green light (578 nm) that hyperpolarises the cell, thus inhibiting the propagation of action potentials [107].”
From Active Neural Interface Circuits and Systems for Selective Control of Peripheral Nerves: A Review (2024) · cites this paper as [107]
Experimental — accuracy not yet measured
Self-check
Percentages, sums and reported differences re-computed from the paper’s own numbers.
The self-check needs the paper’s full text.
Citations
Cites
(1982) · Trends in Neurosciences · doi:10.1016/0166-2236(82)90076-5 · Cited by 9,150
The capsaicin receptor: a heat-activated ion channel in the pain pathway
Caterina, M. J., Schumacher, M. A., Tominaga, M., Rosen, T. A., Levine, J. D., & Julius, D. J. (1997) · Nature · doi:10.1038/39807 · Cited by 9,132 · cited 11×
“Expression of TRPV channels varies in different tissue [104] and could potentially explain some variations between different neural targets.”
BackgroundInfluentialQuantum Dots for Live Cells, in Vivo Imaging, and Diagnostics
Michalet, X., Pinaud, F. F., Bentolila, L. A., Tsay, J. M., Doose, S., Li, J. J., Sundaresan, G., Wu, A. M., Gambhir, S. S., & Weiss, S. (2005) · Science · doi:10.1126/science.1104274 · Cited by 7,794 · cited 1×
“Quantum dots are semiconducting nanoparticles with fluorescent and other optoelectronic properties [132].”
BackgroundMillisecond-timescale, genetically targeted optical control of neural activity
Boyden, E. S., Zhang, F., Bamberg, E., Nagel, G., & Deisseroth, K. A. (2005) · Nature Neuroscience · doi:10.1038/nn1525 · Cited by 5,015 · cited 2×
“Genes to express opsins are typically delivered with viral transfection [12], but electroporation transfection [26] and optical transfection [27] have also been demonstrated as a feasible techniques.”
BackgroundMethodOptical Constants of Water in the 200-nm to 200-μm Wavelength Region
Hale, G. M., & Querry, M. R. (1973) · Applied Optics · doi:10.1364/ao.12.000555 · Cited by 4,479
Snyder, A. W., & Love, J. D. (1984) · doi:10.1007/978-1-4613-2813-1 · Cited by 3,780
Neurodegenerative Disorders: Parkinson's Disease and Huntington's Disease
Hague, S., Klaffke, S., & Bandmann, O. (2006) · IMPERIAL COLLEGE PRESS eBooks · doi:10.1142/9781860948961_0007 · Cited by 2,767
Channelrhodopsin-2, a directly light-gated cation-selective membrane channel
Nagel, G., Szellas, T., Huhn, W., Kateriya, S., Adeishvili, N., Berthold, P. R., Ollig, D., Hegemann, P., & Bamberg, E. (2003) · Proceedings of the National Academy of Sciences · doi:10.1073/pnas.1936192100 · Cited by 2,730 · cited 1×
“The expression of Channelrhodopsin-2 (ChR2), a rapidly-gated blue (470 nm) light-sensitive cation channel, in oocytes of Xenopus laevis and mammalian cells introduced a technique to depolarise cells in timescales on the order of milliseconds [20].”
BackgroundStructural basis of long-term potentiation in single dendritic spines
Matsuzaki, M., Honkura, N., Ellis-Davies, G. C. R., & Kasai, H. (2004) · Nature · doi:10.1038/nature02617 · Cited by 2,483 · cited 1×
“It has been used to map the functional synaptic connections in the visual cortex [51], the cerebral cortex [52], and many other areas [53].”
MethodAzobenzene photoswitches for biomolecules
Beharry, A. A., & Woolley, G. A. (2011) · Chemical Society Reviews · doi:10.1039/c1cs15023e · Cited by 1,884 · cited 1×
“These molecules have multiple configurations, which can change upon exposure to light of different wavelengths [17, 18, 48].”
Background
Research works printed but not linked: 1
- [142]Vo-Dinh T Biomedical photonics 2003 handbook CRC Press
Cited by
Sorted by citations
Next-generation probes, particles, and proteins for neural interfacing
Rivnay, J., Wang, H., Fenno, L., Deisseroth, K., & Malliaras, G. G. (2017) · Science Advances · doi:10.1126/sciadv.1601649 · Cited by 514
“For example, short-pulse IR light has been demonstrated for photothermal stimulation as a result of thermally sensitive ion channels or due to a change in cell capacitance (159).”
BackgroundBiological effects and medical applications of infrared radiation
Tsai, S.-R., & Hamblin, M. R. (2017) · Journal of Photochemistry and Photobiology B Biology · doi:10.1016/j.jphotobiol.2017.04.014 · Cited by 497
Optically Stimulated Artificial Synapse Based on Layered Black Phosphorus
Ahmed, T., Kuriakose, S., Mayes, E. L. H., Ramanathan, R., Bansal, V., Bhaskaran, M. C., Sriram, S., & Walia, S. (2019) · Small · doi:10.1002/smll.201900966 · Cited by 335
Multifunctional Optoelectronics via Harnessing Defects in Layered Black Phosphorus
Ahmed, T., Kuriakose, S., Tawfik, S. A., Spencer, M. J. S., Rahman, M. A., Tahir, M., Lu, Y., Sonar, P. M., Bansal, V., Bhaskaran, M. C., et al. (2019) · Advanced Functional Materials · doi:10.1002/adfm.201901991 · Cited by 161
Gold nanoparticles for regulation of cell function and behavior
Bodelón, G., Costas, C., Pérez‐Juste, J., Pastoriza‐Santos, I., & Liz‐Marzán, L. M. (2017) · Nano Today · doi:10.1016/j.nantod.2016.12.014 · Cited by 107
Light-evoked hyperpolarization and silencing of neurons by conjugated polymers
Feyen, P., Colombo, E., Endeman, D., Nova, M., Laudato, L., Martino, N., Antognazza, M. R., Lanzani, G., Benfenati, F., & Ghezzi, D. (2016) · Scientific Reports · doi:10.1038/srep22718 · Cited by 94
Maria, F. D., Lodola, F., Zucchetti, E., Benfenati, F., & Lanzani, G. (2018) · Chemical Society Reviews · doi:10.1039/c7cs00860k · Cited by 98
Graphene biointerfaces for optical stimulation of cells
Savchenko, A. K., Cherkas, V., Liu, C., Braun, G. B., Kleschevnikov, A. M., Miller, Y. I., & Molokanova, E. (2018) · Science Advances · doi:10.1126/sciadv.aat0351 · Cited by 93
Gold Nanoparticles for Modulating Neuronal Behavior
Paviolo, C., & Stoddart, P. R. (2017) · Nanomaterials · doi:10.3390/nano7040092 · Cited by 92
“The use of light to modulate the electrical activity of neuronal cells, as shown schematically in Figure 3a, has attracted growing interest, due to the potential for less invasive neuronal interfaces, improved spatial resolution of stimulation and avoiding electrical artifacts in associated neural recordings [50,51].”
MethodNanomaterial-Enabled Neural Stimulation
Wang, Y., & Guo, L. (2016) · Frontiers in Neuroscience · doi:10.3389/fnins.2016.00069 · Cited by 86
“Such QD-neuron interfaces have been reviewed in the class of optical neural stimulation techniques elsewhere (Bareket-Keren and Hanein, 2014; Thompson et al., 2014).”
BackgroundLet There Be Light—Optoprobes for Neural Implants
Alt, M. T., Fiedler, E., Rudmann, L., Ordonez, J. S., Ruther, P., & Stieglitz, T. (2016) · Proceedings of the IEEE · doi:10.1109/jproc.2016.2577518 · Cited by 63
“The laser parameters depend on the location and application [87], e.”
BackgroundInfluentialSelective inhibition of small-diameter axons using infrared light
Lothet, E. H., Shaw, K. M., Lu, H., Zhuo, J., Wang, Y. T., Gu, S., Stolz, D. B., Jansen, D., Horn, C. C., Chiel, H. J., et al. (2017) · Scientific Reports · doi:10.1038/s41598-017-03374-9 · Cited by 61
Reddy, J. W., Lassiter, M. M., & Chamanzar, M. (2020) · Microsystems & Nanoengineering · doi:10.1038/s41378-020-00186-2 · Cited by 58
Thang, D. C., Wang, Z., Lü, X., & Xing, B. (2019) · Theranostics · doi:10.7150/thno.33888 · Cited by 54
“Such nanomaterials can be targeted to the plasma membrane, allowing precise opto-thermal manipulations of ion channels with minimal tissue damage by excessive heating [107, 108].”
BackgroundStimulation of water and calcium dynamics in astrocytes with pulsed infrared light
Borrachero‐Conejo, A. I., Adams, W. R., Saracino, E., Mola, M. G., Wang, M., Posati, T., Formaggio, F., Bellis, M. D., Frigeri, A., Caprini, M., et al. (2020) · The FASEB Journal · doi:10.1096/fj.201903049r · Cited by 49
“However, pulsed infrared light has been demonstrated using a wide range of laser parameters (53).”
BackgroundGanguly, M., Jenkins, M. W., Jansen, D., & Chiel, H. J. (2019) · Journal of Neural Engineering · doi:10.1088/1741-2552/ab131b · Cited by 48
Pulsed infrared releases Ca2+from the endoplasmic reticulum of cultured spiral ganglion neurons
Barrett, J. N., Sabatino, S. R., Singh, J., Matthewman, C., Pasos, J., Barrett, E. F., & Rajguru, S. M. (2018) · Journal of Neurophysiology · doi:10.1152/jn.00740.2017 · Cited by 47
Photoactive Nanomaterials for Wireless Neural Biomimetics, Stimulation, and Regeneration
Zhao, D. S., Huang, R., Gan, J.-M., & Shen, Q. (2022) · ACS Nano · doi:10.1021/acsnano.2c08543 · Cited by 45
Spectrally distinct channelrhodopsins for two-colour optogenetic peripheral nerve stimulation
Maimon, B. E., Sparks, K., Srinivasan, S. S., Zorzos, A. N., & Herr, H. (2018) · Nature Biomedical Engineering · doi:10.1038/s41551-018-0255-5 · Cited by 44
Maysinger, D., Ji, J. X., Hutter, E., & COOPER, E. (2015) · Frontiers in Neuroscience · doi:10.3389/fnins.2015.00480 · Cited by 45
Optical stimulation of neural tissue
Richardson, R. T., Ibbotson, M. R., Thompson, A. C., Wise, A. K., & Fallon, J. B. (2020) · Healthcare Technology Letters · doi:10.1049/htl.2019.0114 · Cited by 40
Abdullaeva, O. S., Balzer, F., Schulz, M., Parisi, J., Lützen, A., Dedek, K., & Schiek, M. (2018) · Advanced Functional Materials · doi:10.1002/adfm.201805177 · Cited by 39
Pathak, Y. J., Greenleaf, W., Metman, L. V., Kubben, P., Sarma, S. V., Pepin, B., Lautner, D., DeBates, S., Benison, A. M., Balasingh, B., et al. (2021) · Frontiers in Digital Health · doi:10.3389/fdgth.2021.618959 · Cited by 41
“Optical stimulation alludes to the use of light to trigger neurons (81).”
BackgroundAn infrared optical pacing system for screening cardiac electrophysiology in human cardiomyocytes
McPheeters, M. T., Wang, Y. T., Werdich, A. A., Jenkins, M. W., & Laurita, K. R. (2017) · PLoS ONE · doi:10.1371/journal.pone.0183761 · Cited by 38
“Infrared light has been used previously to elicit action potential activity from neurons[36, 37] and cardiac myocytes[17, 18].”
BackgroundGanguly, M., Ford, J. B., Zhuo, J., McPheeters, M. T., Jenkins, M. W., Chiel, H. J., & Jansen, D. (2019) · Neurophotonics · doi:10.1117/1.nph.6.4.040501 · Cited by 37
Infrared neural stimulation in human cerebral cortex.
Pan, L., Ping, A., Schriver, K., Roe, A., Zhu, J.-M., & Xu, K.-D. (2023) · Brain Stimulation · doi:10.1016/j.brs.2023.01.1678 · Cited by 31
“cochlea[51,52], 477 inhibition of nociceptive response in peripheral nerves[53]).”
BackgroundKaszás, A., Szalay, G., Slézia, A., Bojdán, A., Vanzetta, I., Hangya, B., Rózsa, B. J., O'Connor, R. P., & Moreau, D. (2021) · Scientific Reports · doi:10.1038/s41598-021-89163-x · Cited by 34
Thermal damage threshold of neurons during infrared stimulation
Brown, W. G. A., Needham, K., Begeng, J. M., Thompson, A., Nayagam, B. A., Kameneva, T., & Stoddart, P. R. (2020) · Biomedical Optics Express · doi:10.1364/boe.383165 · Cited by 32
Pederson, D. J., Quinkert, C. J., Arafat, M. A., Somann, J. P., Williams, J. D., Bercich, R. A., Wang, Z., Albors, G. O., Jefferys, J. G. R., & Irazoqui, P. P. (2019) · ACM Transactions on Embedded Computing Systems · doi:10.1145/3301310 · Cited by 29
Entrainment of Cerebellar Purkinje Cell Spiking Activity Using Pulsed Ultrasonic Stimulation
Asan, A., Kang, Q., Oralkan, O., & Sahin, M. (2021) · Brain Stimulation · doi:10.1016/j.brs.2021.03.004 · Cited by 25
“Energy in the form of acoustic [1], magnetic [2], optical waves [3] and electric fields [4] can stimulate neurons or modulate their activity.”
BackgroundBiological Considerations of Optical Interfaces for Neuromodulation
Hart, W. L., Kameneva, T., Wise, A. K., & Stoddart, P. R. (2019) · Advanced Optical Materials · doi:10.1002/adom.201900385 · Cited by 25
Duc, D., Stoddart, P. R., McArthur, S. L., Kapsa, R. M. I., Quigley, A. F., Boyd‐Moss, M., & Moulton, S. E. (2019) · Advanced Healthcare Materials · doi:10.1002/adhm.201801321 · Cited by 25
Neuroprosthetics for Human Performance Optimization
Chang, Y.-J., Krishna, G., & Fernandez, B. R. (2019) · Oxford University Press eBooks · doi:10.1093/oso/9780190455132.003.0008 · Cited by 23
Bringing new dimensions to drug discovery screening: impact of cellular stimulation technologies
Molokanova, E., Mercola, M. A., & Savchenko, A. (2017) · Drug Discovery Today · doi:10.1016/j.drudis.2017.01.015 · Cited by 21
Graphene-based cardiac sensors and actuators
Savchenko, A., Kireev, D., Yin, R. T., Efimov, I. R., & Molokanova, E. (2023) · Frontiers in Bioengineering and Biotechnology · doi:10.3389/fbioe.2023.1168667 · Cited by 20
“” The experimental data further confirm that lightinduced heat-mediated effects are unlikely during GraMOS, because 1) a light intensity required for GraMOS is ~1,000 times lower than required for thermal effects (Jenkins et al., 2010; Shapiro et al., 2012; Thompson et al., 2014), 2) the surface temperature of optoele…”
BackgroundAntolík, J., Sabatier, Q., Galle, C., Frégnac, Y., & Benosman, R. B. (2021) · Scientific Reports · doi:10.1038/s41598-021-88960-8 · Cited by 19
Harnessing Intelligence from Brain Cells In Vitro
Kagan, B. J., Habibollahi, F., Watmuff, B., Azadi, S. A., Doensen, F., Loeffler, A., Byun, S. H., Servais, B., Desouza, C., Abu-Bonsrah, K. D., et al. (2025) · The Neuroscientist · doi:10.1177/10738584251321438 · Cited by 20
Biohybrid nanointerfaces for neuromodulation
Filippi, M., Balciunaite, A., & Katzschmann, R. K. (2023) · Nano Today · doi:10.1016/j.nantod.2023.102094 · Cited by 19
One dimensional photonic crystal as an efficient tool for in-vivo optical sensing of neural activity
Sohrabi, F., Hamidi, S. M., Asgari, N., Ansari, M. A., & Gachiloo, R. (2019) · Optical Materials · doi:10.1016/j.optmat.2019.109275 · Cited by 19
Polydimethylsiloxane-based optical waveguides for tetherless powering of floating microstimulators
Erşen, A., & Şahin, M. (2017) · Journal of Biomedical Optics · doi:10.1117/1.jbo.22.5.055005 · Cited by 17
Infrared neurostimulation in ex-vivo rat sciatic nerve using 1470 nm wavelength
Cury, J., Perre, L. V., Smets, H., Stumpp, L. I., Vespa, S., Vanhoestenberghe, A., Doguet, P., Delbeke, J., Tahry, R. E., Gorza, S., et al. (2021) · Journal of Neural Engineering · doi:10.1088/1741-2552/abf28f · Cited by 18
Nanoparticle-based optical interfaces for retinal neuromodulation: a review
Stoddart, P. R., Begeng, J. M., Tong, W., Ibbotson, M. R., & Kameneva, T. (2024) · Frontiers in Cellular Neuroscience · doi:10.3389/fncel.2024.1360870 · Cited by 18
“Conventional INM typically involves laser-evoked heating approaching ∼ 60 ° C for durations generally less than a millisecond (Thompson et al., 2014).”
BackgroundMethodInfluentialLight-neuron interactions: key to understanding the brain
Go, M. A., & Daria, V. (2014) · Journal of Optics · doi:10.1088/2040-8986/19/2/023002 · Cited by 12
Tolstykh, G. P., Olsovsky, C. A., Ibey, B. L., & Beier, H. T. (2017) · Neurophotonics · doi:10.1117/1.nph.4.2.025001 · Cited by 16
Molokanova, E., Zhou, T., Vasupal, P., Cherkas, V., Narute, P., Ferraz, M. S. A., Reiß, M., Almenar‐Queralt, A., Chaldaiopoulou, G., de Souza, J. S., et al. (2025) · Nature Communications · doi:10.1038/s41467-025-62637-6 · Cited by 15
“Critically, light intensities required for GraMOS are ~100 – 1000 times lower than light intensities needed for triggering thermal optocapacitive effects in cells 41,58 .”
MEA Recordings and Cell–Substrate Investigations with Plasmonic and Transparent, Tunable Holey Gold
Hondrich, T. J. J., Lenyk, B., Shokoohimehr, P., Kireev, D., Maybeck, V., Mayer, D., & Offenhäusser, A. (2019) · ACS Applied Materials & Interfaces · doi:10.1021/acsami.9b14948 · Cited by 15
A tissue-engineered neural interface with photothermal functionality
do Nascimento, A. T., Mendes, A. X., Begeng, J. M., Duchi, S., Stoddart, P. R., Quigley, A. F., Kapsa, R. M. I., Ibbotson, M. R., Silva, S. M., & Moulton, S. E. (2023) · Biomaterials Science · doi:10.1039/d3bm00139c · Cited by 14
Microfabrication Technologies for Nanoinvasive and High‐Resolution Magnetic Neuromodulation
Ge, C., Masalehdan, T., Baghini, M. S., Toro, V. D., Signorelli, L., Thomson, H. M., Gregureć, D., & Heidari, H. (2024) · Advanced Science · doi:10.1002/advs.202404254 · Cited by 15
Membrane-targeted push-pull azobenzenes for the optical modulation of membrane potential
Sesti, V., Magni, A., Moschetta, M., Florindi, C., Pfeffer, M. E., DiFrancesco, M. L., Guizzardi, M., Folpini, G., Sala, L., Ritacca, A. G., et al. (2025) · Light Science & Applications · doi:10.1038/s41377-024-01669-x · Cited by 14
Leonard, J. T., Young, E. C., Yonkee, B. P., Cohen, D. A., Shen, C., Margalith, T., Ng, T. K., DenBaars, S. P., Ooi, B. S., Speck, J. S., et al. (2016) · Proceedings of SPIE, the International Society for Optical Engineering/Proceedings of SPIE · doi:10.1117/12.2206211 · Cited by 13
Gold nanorod-assisted near-infrared stimulation of bullfrog sciatic nerve
Mou, Z., You, M., & Xue, W. (2018) · Lasers in Medical Science · doi:10.1007/s10103-018-2554-1 · Cited by 13
Azees, A. A., Thompson, A., Thomas, R., Zhou, J., Ruther, P., Wise, A. K., Ajay, E. A., Garrett, D. J., Quigley, A. F., Fallon, J. B., et al. (2023) · Hearing Research · doi:10.1016/j.heares.2023.108911 · Cited by 12
“…(Wells et al. 2005, Peterson and Tyler 2013, Thompson et al. 2014, Cayce et al. 2014, Chernov and Roe 2014), and in the cochlea the area of excitation has been shown to be more spatially precise compared to electrical stimulation (Richter et al. 2011, Thompson et al. 2014, Agarwal et al. 2021).”
Bioelectronic devices for light-based diagnostics and therapies
Kim, H., Sritandi, W., Xiong, Z., & Ho, J. S. (2023) · Biophysics Reviews · doi:10.1063/5.0102811 · Cited by 12
The effects of temperature on the dynamics of the biological neural network
Jabbari, M. B., & Rezaei, M. (2022) · Journal of Biological Physics · doi:10.1007/s10867-021-09598-1 · Cited by 11
“Since the INS is dependent on thermal changes, proper knowledge of the distribution of heat in the nervous system may improve the production of optical devices for stimulating the neuron [14].”
BackgroundInfrared neuromodulation—a review
Sander, M. Y., & Zhu, X. (2024) · Reports on Progress in Physics · doi:10.1088/1361-6633/ad4729 · Cited by 11
“INS has been reviewed in detail previously by several out-standing review papers [24–26 , 44– 47].”
Ebtehaj, Z., Hatef, A., Malekmohammad, M., & Soltanolkotabi, M. (2018) · The Journal of Physical Chemistry B · doi:10.1021/acs.jpcb.8b02616 · Cited by 12
Response of primary auditory neurons to stimulation with infrared light in vitro
Brown, W. G. A., Needham, K., Begeng, J. M., Thompson, A. C., Nayagam, B. A., Kameneva, T., & Stoddart, P. R. (2021) · Journal of Neural Engineering · doi:10.1088/1741-2552/abe7b8 · Cited by 11
“The estimated SGN stimulation thresholds did not differ remarkably from those observed in other neurons [7], indicating that the mechanism(s) responsible for the low in vivo SGN stimulation threshold are not present in cultured SGNs.”
InfluentialActive Neural Interface Circuits and Systems for Selective Control of Peripheral Nerves: A Review
Habibollahi, M., Jiang, D., Lancashire, H. T., & Demosthenous, A. (2024) · IEEE Transactions on Biomedical Circuits and Systems · doi:10.1109/tbcas.2024.3430038 · Cited by 11
“ChR2 responds to blue (470 nm) lights to depolarise a neuron, and HR exhibits sensitivity toward green light (578 nm) that hyperpolarises the cell, thus inhibiting the propagation of action potentials [107].”
Sardoiwala, M. N., Srivastava, A. K., Karmakar, S., & Choudhury, S. R. (2019) · ACS Chemical Neuroscience · doi:10.1021/acschemneuro.9b00246 · Cited by 10
Current Review of Optical Neural Interfaces for Clinical Applications
Park, Y.-H., Park, S., & Eom, K. (2021) · Micromachines · doi:10.3390/mi12080925 · Cited by 10
“We classified this type of optical neural stimulation as an intrinsic neural stimulation as it requires no neural engineering prior to light irradiation [8].”
BackgroundVagus nerve bundle stimulation using 1505‐nm laser irradiation in an in‐vivo rat model
Yetis, O., Güner, Ö., Akkaya, İ., Güneli, E., Bağrıyanık, A., & Tozburun, S. (2021) · Journal of Biophotonics · doi:10.1002/jbio.202100197 · Cited by 10
Investigations of Astrocyte Calcium Signaling and Imaging with Classical and Nonclassical Light
Spennato, D., Leone, J., Gundhardt, C., Varnavski, O. P., Fabbri, R., Caprini, M., Zamboni, R., Benfenati, V., & Goodson, T. G., III (2024) · The Journal of Physical Chemistry B · doi:10.1021/acs.jpcb.4c03251 · Cited by 8
Emerging trends in the development of flexible optrode arrays for electrophysiology
Almasri, R. M., Ladouceur, F. J., Mawad, D., Esrafilzadeh, D., Firth, J., Lehmann, T., Poole-Warren, L. A., Lovell, N. H., & Abed, A. A. (2023) · APL Bioengineering · doi:10.1063/5.0153753 · Cited by 7
You, M., Zhou, R., & Mou, Z. (2019) · Biomedical Microdevices · doi:10.1007/s10544-019-0428-3 · Cited by 7
Multi‐Channel Neural Interface for Neural Recording and Neuromodulation
Kim, E.-M., Chung, W. G., Kim, E., Oh, M., Paek, J., Lee, T., Kim, D., An, S. H., Kim, S., & Park, J. (2025) · Small Methods · doi:10.1002/smtd.202501227 · Cited by 9
Hutchinson, M. R., Stoddart, P. R., & Mahadevan-Jansen, A. M. (2018) · Neurophotonics · doi:10.1117/1.nph.5.4.040402 · Cited by 6
“The past 15 years has seen a rapid growth of interest in optical techniques for interfacing with the nervous system, including methods, such as optogenetics and infrared neural modulation.(32) In the context of infrared neural modulation, the ability to thermally inhibit neural activity with high spatial precision has…”
MethodLee, W.-E., Tsou, C., Liao, Z.-X., Lu, P.-Y., Lin, T., Lee, S.-Y., Lin, C. K., & Shieh, G.-S. (2021) · IEEE Access · doi:10.1109/access.2021.3083772 · Cited by 6
“Based on the above discussion, combining electrical and optogenetic stimulation in one system seems reasonable [19].”
BackgroundGuo, X.-J., Zhao, Z., Chang, J., He, L., Su, W.-N., Feng, T., Zhao, C., Xu, M., & Rao, J. (2023) · Frontiers in Neuroscience · doi:10.3389/fnins.2023.1282558 · Cited by 6
Lin, H.-Y., Nurunnabi, M., Chen, W., & Huang, C.-H. (2019) · Elsevier eBooks · doi:10.1016/b978-0-12-815889-0.00016-7 · Cited by 6
Moorthy, V. M., Parthasarathy, V., & Daniel, R. J. (2020) · Biosurface and Biotribology · doi:10.1049/bsbt.2019.0045 · Cited by 5
“It is obvious because, direct light-induced, heat-mediated effects are unlikely in our setup for the following reasons: (i) high light intensity would be required for these effects [26, 29] and (ii) light-induced heat, usually produces a gradual changing cellular response during continuous light exposure [30], whereas…”
BackgroundJiang, C., Fujita, T., & Kumamoto, E. (2016) · Biochemistry and Biophysics Reports · doi:10.1016/j.bbrep.2016.06.011 · Cited by 5
“In order to know what is a final response on SG neurons after physiological release of oxytocin, it would be necessary to be examined how synaptic responses recorded from SG neurons using the in vivo patch-clamp technique [25] are affected by electrically or optogenetically [26] stimulating hypothalamic neurons contai…”
MethodOptonongenetic enhancement of activity in primary cortical neurons
Ghirga, S., Pagani, F., Rosito, M., Angelantonio, S. D., Ruocco, G., & Leonetti, M. (2020) · Journal of the Optical Society of America A · doi:10.1364/josaa.385832 · Cited by 5
Signal processing and stimulation potential within the ascending auditory pathway: a review
Quimby, A. E., Wei, K., Adewole, D. O., Eliades, S. J., Cullen, D. K., & Brant, J. A. (2023) · Frontiers in Neuroscience · doi:10.3389/fnins.2023.1277627 · Cited by 4
“A photoelectric effect, whereby heating of cochlear fluids generates fluid pressure waves akin to acoustic stimuli, may also contribute to neuronal responses to light stimulation within the cochlea (Thompson et al., 2014).”
BackgroundAbdollahiyan, P., Sui, K., Li, G., Berg, R. W., Meneghetti, M., & Markos, C. (2025) · Journal of Neuroscience Methods · doi:10.1016/j.jneumeth.2025.110484 · Cited by 4
“In contrast to INS, it needs the incorporation of light-sensitive ion channels (opsins) into neurons, making them responsive to visible light (Thompson et al., 2014).”
Integrated Photonic Arrays as a Platform for Infrared Neural Stimulation
Kossey, M. R., Alt, S., Rizk, C. G., & Foster, A. C. (2017) · Optics in the Life Sciences · doi:10.1364/boda.2017.bos2a.8 · Cited by 4
Lewis, T. H. J., Zhuo, J., McClellan, J. X., Getsy, P. M., Ryan, R. M., Jenkins, M. J., & Lewis, S. J. (2023) · Frontiers in Physiology · doi:10.3389/fphys.2023.1219998 · Cited by 4
Nazari, S., & Karim Faez, A. (2018) · Soft Computing · doi:10.1007/s00500-018-03671-z · Cited by 4
Adams, W. R., Borrachero‐Conejo, A. I., Rasiah, P. K., Saracino, E., Zamboni, R., Jansen, D., Benfenati, V., & Mahadevan-Jansen, A. M. (2025) · Advanced Biology · doi:10.1002/adbi.202500269 · Cited by 3
Gold Nanomaterial-Enabled Optical Neural Stimulation
Wang, Y. (2020) · Springer eBooks · doi:10.1007/978-3-030-41854-0_14 · Cited by 3
Tian, F., Liu, Y., Chen, M., Schriver, K. E., & Roe, A. W. (2025) · Cell Reports Methods · doi:10.1016/j.crmeth.2024.100961 · Cited by 3
“17,29,65 The leading theory in mammalian brain is that INS induces changes in membrane capacitance, which in turn lead to neuronal action potentials.”
Implantable Glass Waveguides and Coating Materials for Chronic Optical Medical Applications
Alt, M. T., Mittnacht, A., & Stieglitz, T. (2018) · Annual International Conference of the IEEE Engineering in Medicine and Biology Society (EMBC) · doi:10.1109/embc.2018.8513121 · Cited by 2
“In contrast, direct infrared stimulation [2] enables cell activity without prior genome modification.”
BackgroundNeurotechnology for monitoring and restoring sensory, motor, and autonomic functions
Wu, P. C., Knaack, G. L., & Weber, D. J. (2016) · Proceedings of SPIE, the International Society for Optical Engineering/Proceedings of SPIE · doi:10.1117/12.2222967 · Cited by 2
Wan, Y., Wang, M., Zhang, S., & Xie, B. (2021) · Journal of Innovative Optical Health Sciences · doi:10.1142/s1793545821500140 · Cited by 2
Design Considerations for Implantable Neural Circuits and Systems
Hsu, W.-Y., Hsieh, P.-H., & Chen, H. (2023) · Handbook of Neuroengineering · doi:10.1007/978-981-16-5540-1_19 · Cited by 1
Tashiro, H., Popović, M. B., Iramina, K., Terasawa, Y., & Ohta, J. (2019) · Elsevier eBooks · doi:10.1016/b978-0-12-812939-5.00006-9 · Cited by 1
Ebtehaj, Z., Malekmohammad, M., Hatef, A., & Soltanolkotabi, M. (2021) · Advanced Theory and Simulations · doi:10.1002/adts.202000214 · Cited by 1
Electroluminescence of Single InGaN/GaN Micropyramids
Babichev, A. V., Denisov, D. V., Lavenus, P., Jacopin, G., Tchernycheva, M., Julien, F. H., & Zhang, H. (2019) · Optics and Spectroscopy · doi:10.1134/s0030400x19020036 · Cited by 1
Image Processing and Still Image Transferring for Optogenetics Visual Cortical Stimulator
Fattah, N. A., Al‐Atabany, W., & Degenaar, P. A. (2020) · Eurasian Journal of Science and Engineering · doi:10.23918/eajse.v6i2p73 · Cited by 1
Implantable Optical Neural Interface
Jun, S. B., & Lim, Y. (2016) · Springer eBooks · doi:10.1007/978-3-319-33201-7_9
End-Fire Silicon Optical Phased Arrays for Infrared Neural Stimulation Applications
Kossey, M. R., Alt, S., Rizk, C. G., & Foster, A. C. (2017) · Conference on Lasers and Electro-Optics · doi:10.1364/cleo_at.2017.atu1b.4
“067 seconds [6,7] (The exact rise time to 0.”
BackgroundЭлектролюминесценция одиночных InGaN/GaN микропирамид
Babichev, A. V., Denisov, D. V., Lavenus, P., Jacopin, G., Tchernycheva, M., Julien, F. H., & Zhang, H. (2019) · Журнал технической физики · doi:10.21883/os.2019.02.47201.130-18
A Mathematical Modeling of Infrared Neural Stimulation
Alex, C. S. (2020) · Undergraduate Journal of Mathematical Modeling One + Two · doi:10.5038/2326-3652.10.2.4914
PILOTSTUDIE: VNS-ANALYSE BEI NIR-LASER-FELD-THERAPIE MIT CW VERSUS PULSED MODES
Kreisel, V. (2020) · Akupunktur & Aurikulomedizin · doi:10.1007/s15009-020-5675-0
Design Considerations for Implantable Neural Circuits and Systems
Hsu, W.-Y., Hsieh, P.-H., & Chen, H. (2021) · Handbook of Neuroengineering · doi:10.1007/978-981-15-2848-4_19-1
Osborn, L. E., Betthauser, J., & Thakor, N. V. (2019) · Wiley eBooks · doi:10.1002/047134608x.w1424.pub2 · Cited by 2
Editorial: Nanomaterials for Communicating With the Brain
Tong, W., Ibbotson, M. R., & Ghezzi, D. (2022) · Frontiers in Neuroscience · doi:10.3389/fnins.2022.918949
Defect Engineering in Layered Black Phosphorus for Multi-Functional Optoelectronics
Ahmed, T., & Walia, S. (2022) · Royal Society of Chemistry eBooks · doi:10.1039/9781839162909-00033
Frequency demodulation with magnetoelectric coreshells
Narayanan, R. P., Khaleghi, A., & Balasingham, I. (2023) · ACM International Conference on Nanoscale Computing and Communication (NANOCOM) · doi:10.1145/3576781.3608710
Tashiro, H., Herr, H., Popović, M. B., Iramina, K., Terasawa, Y., & Ohta, J. (2024) · Elsevier eBooks · doi:10.1016/b978-0-443-13862-1.00017-5
Automated optical system of integrated photostimulation of the human nervous system
Tymchik, G. S., Skytsiouk, V. I., Klotchko, T. R., Paliy, V. G., Azhibekova, Z., Пінаєва, О., Dzierżak, R., & Massimgaziyeva, A. (2024) · Photonics Applications in Astronomy, Communications, Industry, and High-Energy Physics Experiments (WILGA) · doi:10.1117/12.3054869
“Optical stimulation methods 7 can avoid some of these problems by providing selective stimulation, high spatial resolution, and reduced device invasiveness.”
Metadata
- Authors
- C. Thompson, A., R. Stoddart, P., & Jansen, E. D.
- Venue
- Current Molecular Imaging
- Publisher
- Bentham Science Publishers Ltd.
- Published
- 2015-02-04
- Volume
- 3
- Issue
- 2
- Pages
- 162-177
- ISSN
- 2211-5544 (ISSN-L)
- 2211-5552
- PMC
- PMC4541079
- OpenAlex
- W1967609781
- Cited by
- 105
- References
- 161
- Citations by year
- 2026: 3 · 2025: 8 · 2024: 7 · 2023: 12 · 2022: 4 · 2021: 12 · 2020: 11 · 2019: 18 · 2018: 10 · 2017: 12 · 2016: 7 · 2015: 1
- FWCI
- 3.05
- Type
- journal article
- Language
- en
- Open access
- green
- www.ncbi.nlm.nih.gov
- Licence
- cc-by-nc
- Locations
- Current molecular imaging (publishedVersion)
- Europe PMC (PubMed Central) (publishedVersion, cc-by-nc)
- PubMed Central (publishedVersion, cc-by-nc)
- PubMed (publishedVersion)
- Swinburne figshare (Swinburne University of Technology) (submittedVersion)
- Funders
- National Institute of Neurological Disorders and Stroke (R01NS052407)
- Topics
- Life Sciences › Neuroscience › Cellular and Molecular Neuroscience › Neuroscience and Neural Engineering
- Life Sciences › Neuroscience › Cellular and Molecular Neuroscience › Photoreceptor and optogenetics research
- Health Sciences › Medicine › Radiology, Nuclear Medicine and Imaging › Optical Imaging and Spectroscopy Techniques
- Keywords
- optical neural stimulation, optogenetics, photoactive molecules, infrared neural stimulation, neural interfaces, light delivery, implant-induced inflammation
About these checks
Registry, retraction, Cites and statistics results are computed, not judged, with one exception: a printed reference that no index lists is read once by a model before it counts as a citation error. Claims are extracted by a model and kept only when their quote appears verbatim in the text; each cited source is then checked, with a model’s help, for whether it says what the claim relies on. Those verdicts can be wrong — read the claim’s quote and the cited source before relying on one.
Statistics and arithmetic are recomputed, not judged.
Confidence bands are shown only for fields calibrated on our annotated test set. None is calibrated yet, so no band is shown.
What counts as a claim ›How we measure confidence ›How we check this ›
Are you an author, or do you see a problem with this page? Request a review
