Cited by 29

The DOI matches its Crossref record; 8 of the 8 references it cites were found in a registry or an index.

Assessment and site-specific manipulation of DNA (hydroxy-)methylation during mouse corticogenesis

Noack, Florian, Pataskar, Abhijeet, Schneider, Martin, Buchholz, Frank, Tiwari, Vijay K, Calegari, Federico·2019·Life Science Alliance

Abstract

Dynamic changes in DNA (hydroxy-)methylation are fundamental for stem cell differentiation. However, the signature of these epigenetic marks in specific cell types during corticogenesis is unknown. Moreover, site-specific manipulation of cytosine modifications is needed to reveal the significance and function of these changes. Here, we report the first assessment of (hydroxy-)methylation in neural stem cells, neurogenic progenitors, and newborn neurons during mammalian corticogenesis. We found that gain in hydroxymethylation and loss in methylation occur sequentially at specific cellular transitions during neurogenic commitment. We also found that these changes predominantly occur within enhancers of neurogenic genes up-regulated during neurogenesis and target of pioneer transcription factors. We further optimized the use of dCas9-Tet1 manipulation of (hydroxy-)methylation, locus-specifically, in vivo, showing the biological relevance of our observations for Dchs1, a regulator of corticogenesis involved in developmental malformations and cognitive impairment. Together, our data reveal the dynamics of cytosine modifications in lineage-related cell types, whereby methylation is reduced and hydroxymethylation gained during the neurogenic lineage concurrently with up-regulation of pioneer transcription factors and activation of enhancers for neurogenic genes.

Overview

The claims and statistics of this paper haven’t been checked yet.

Run the check — free, no account needed. It reads the open-access text and checks the sources it cites.

A few free checks a day · papers already verified open instantly · results are public

Integrity signals

Registry

Crossref · 10.26508/lsa.201900331

Cites

8 of 8 references verified0 citation errors · 0 not checkable

Statistics

Figures

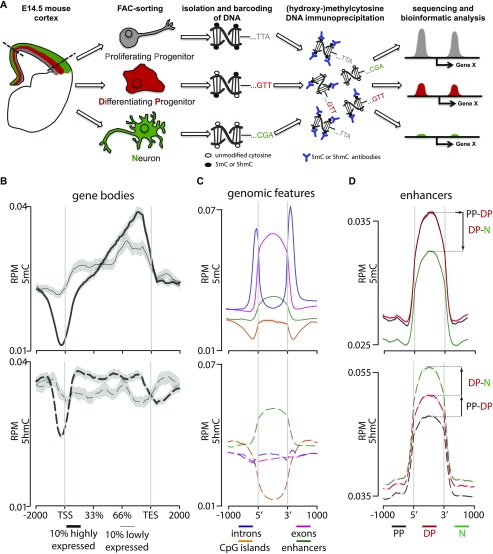
Figure 1. Cell type–specific assessment of 5(h)mC. (A) Drawing depicting the strategy of our study with PP, DP, and neurons (color coded in gray, red, and green, respectively, throughout all figures) FAC-sorted from the E14.5 mouse cortex followed by DNA barcoding, mixture, immunoprecipitation, and sequencing. (B–D) Distribution and abundance (reads per million = RPM) of 5(h)mC of the ±2,000-bp regions across gene bodies of the top 10% more highly or lowly expressed genes (B; thick and thin lines, respectively); genomic regions (C, as indicated); or enhancers in PP, DP, and neurons (D, as indicated). Note that in this and all other figures, 5mC and 5hmC are consistently depicted as continuous (top) or dashed (bottom) lines, respectively. Values for the three cell types were merged together (B, C) or depicted individually (D). Note the characteristic drop in 5(h)mC at the TSS and TES (B) and the bivalent 5(h)mC signatures within enhancers during neurogenic commitment (D). Gray shadows in B represent the standard error of the mean, which was too small to be visibly depicted in (C, D) because of the much higher number of loci in the latter relative to the former plots.
Figure 1. Cell type–specific assessment of 5(h)mC. (A) Drawing depicting the strategy of our study with PP, DP, and neurons (color coded in gray, red, and green, respectively, throughout all figures) FAC-sorted from the E14.5 mouse cortex followed by DNA barcoding, mixture, immunoprecipitation, and sequencing. (B–D) Distribution and abundance (reads per million = RPM) of 5(h)mC of the ±2,000-bp regions across gene bodies of the top 10% more highly or lowly expressed genes (B; thick and thin lines, respectively); genomic regions (C, as indicated); or enhancers in PP, DP, and neurons (D, as indicated). Note that in this and all other figures, 5mC and 5hmC are consistently depicted as continuous (top) or dashed (bottom) lines, respectively. Values for the three cell types were merged together (B, C) or depicted individually (D). Note the characteristic drop in 5(h)mC at the TSS and TES (B) and the bivalent 5(h)mC signatures within enhancers during neurogenic commitment (D). Gray shadows in B represent the standard error of the mean, which was too small to be visibly depicted in (C, D) because of the much higher number of loci in the latter relative to the former plots.CC BY · PubMed Central
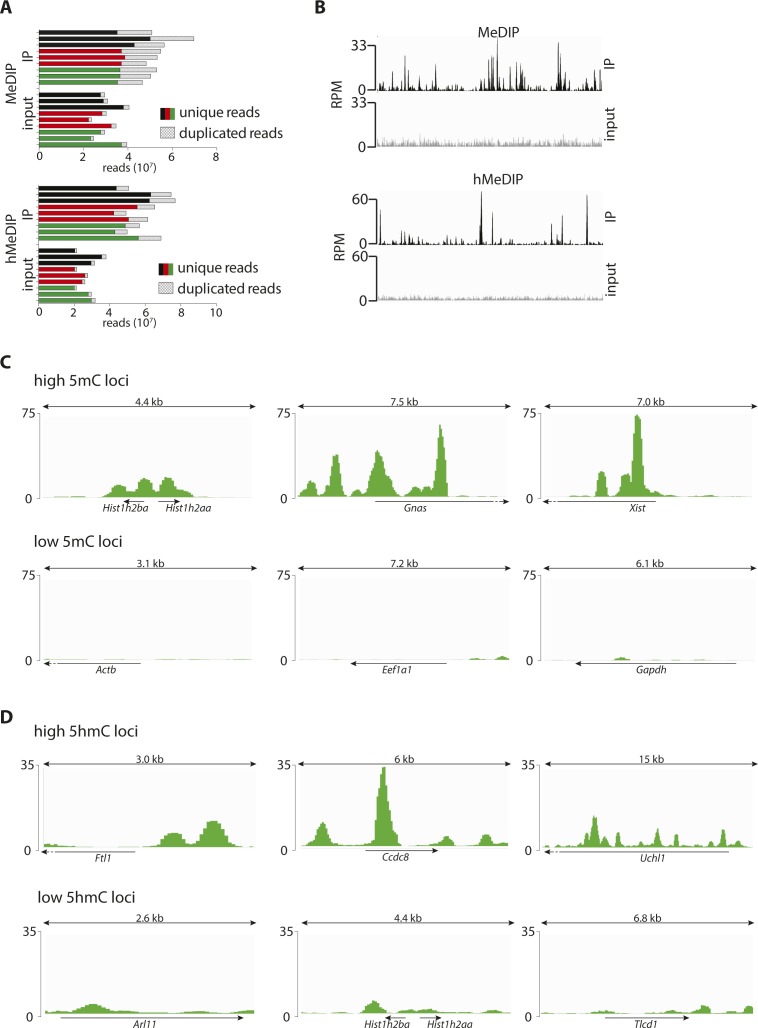
Figure S1. 5(h)mC patterns across control loci. (A) Number of reads (unique/duplicated as indicated) per biological replicate of PP (black), DP (red), and N (green) upon MeDIP (top) or hMeDIP (bottom). (B) Signal distribution across a 1-Mbp region for the merged (all cell types and replicates) immunoprecipitated samples (black) and merged input controls (gray) of MeDIP (top) and hMeDIP (bottom). Note the different peak patterns indicating no detectable cross-reactivity. (C, D) Screenshots (IGV browser) of 5mC (C) or 5hmC (D) profiles in neurons (merged triplicates) representing three known examples of high (top) or low (bottom) (hydroxyl)methylated loci. Scale = normalized coverage.
Figure S1. 5(h)mC patterns across control loci. (A) Number of reads (unique/duplicated as indicated) per biological replicate of PP (black), DP (red), and N (green) upon MeDIP (top) or hMeDIP (bottom). (B) Signal distribution across a 1-Mbp region for the merged (all cell types and replicates) immunoprecipitated samples (black) and merged input controls (gray) of MeDIP (top) and hMeDIP (bottom). Note the different peak patterns indicating no detectable cross-reactivity. (C, D) Screenshots (IGV browser) of 5mC (C) or 5hmC (D) profiles in neurons (merged triplicates) representing three known examples of high (top) or low (bottom) (hydroxyl)methylated loci. Scale = normalized coverage.CC BY · PubMed Central
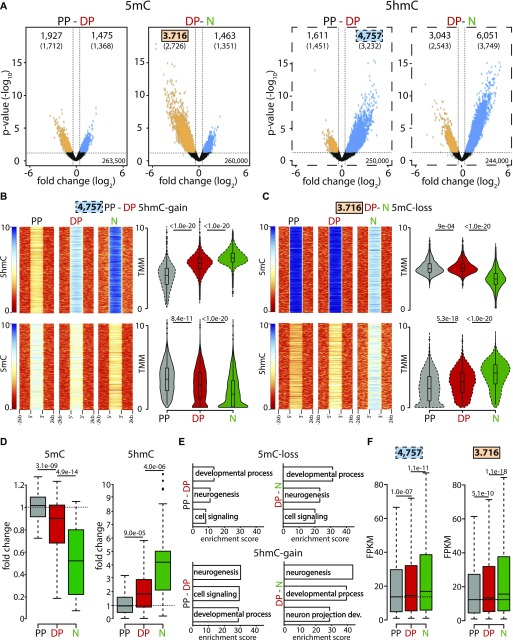
Figure 2. 5mC-loss/5hmC-gain loci characterize neurogenic genes up-regulated during fate commitment. (A) Volcano plots depicting the loss (orange) and gain (blue) in 5mC (left) or 5hmC (right) from PP to DP and DP to neurons (as indicated). Number of significantly (>50% change, P < 0.05) differentially (hydroxy-)methylated loci (top) and nearest genes (parentheses) are indicated. (B, C) Heat maps (left) and violin plots (right) representing 5(h)mC levels within a ±2-kb region across differentially (hydroxy-)methylated loci in each cell type (colors, as above) calculated as log2(ChIP/control) or trimmed mean of M values (TMM), respectively. In this analysis, 5hmC-gain and 5mC-loss loci identified in DP (4,757) or neurons (3,716), respectively, were first taken as a reference (top panels) and the levels of the converse cytosine modification (i.e., 5mC or 5hmC for B and C, respectively) measured within these very same loci (bottom) revealing the extensive correlation in 5(h)mC changes. (D) Whiskers–box plots of 5mC and 5hmC levels (left and right, respectively) calculated for individual cytosines (n = 48) after (oxidative) bisulfite amplicon sequencing of six among all 5mC-loss/5hmC-gain loci (one examples of which is depicted in Fig S2C). Data are plotted as fold change relative to PP. (E, F) DAVID-gene ontology term enrichment (top three terms) (E) and expression levels (FPKM) (F) of 5mC-loss and 5hmC-gain loci in the PP–DP and DP–neuron transitions (as indicated). Note the high enrichment, specificity, and consistency of the GO terms and the highly significant change in gene expression throughout the neurogenic lineage. Statistical test = edgeR-modified t test (A), Wilcoxon rank sum test (B, C, D and F).
Figure 2. 5mC-loss/5hmC-gain loci characterize neurogenic genes up-regulated during fate commitment. (A) Volcano plots depicting the loss (orange) and gain (blue) in 5mC (left) or 5hmC (right) from PP to DP and DP to neurons (as indicated). Number of significantly (>50% change, P < 0.05) differentially (hydroxy-)methylated loci (top) and nearest genes (parentheses) are indicated. (B, C) Heat maps (left) and violin plots (right) representing 5(h)mC levels within a ±2-kb region across differentially (hydroxy-)methylated loci in each cell type (colors, as above) calculated as log2(ChIP/control) or trimmed mean of M values (TMM), respectively. In this analysis, 5hmC-gain and 5mC-loss loci identified in DP (4,757) or neurons (3,716), respectively, were first taken as a reference (top panels) and the levels of the converse cytosine modification (i.e., 5mC or 5hmC for B and C, respectively) measured within these very same loci (bottom) revealing the extensive correlation in 5(h)mC changes. (D) Whiskers–box plots of 5mC and 5hmC levels (left and right, respectively) calculated for individual cytosines (n = 48) after (oxidative) bisulfite amplicon sequencing of six among all 5mC-loss/5hmC-gain loci (one examples of which is depicted in Fig S2C). Data are plotted as fold change relative to PP. (E, F) DAVID-gene ontology term enrichment (top three terms) (E) and expression levels (FPKM) (F) of 5mC-loss and 5hmC-gain loci in the PP–DP and DP–neuron transitions (as indicated). Note the high enrichment, specificity, and consistency of the GO terms and the highly significant change in gene expression throughout the neurogenic lineage. Statistical test = edgeR-modified t test (A), Wilcoxon rank sum test (B, C, D and F).CC BY · PubMed Central
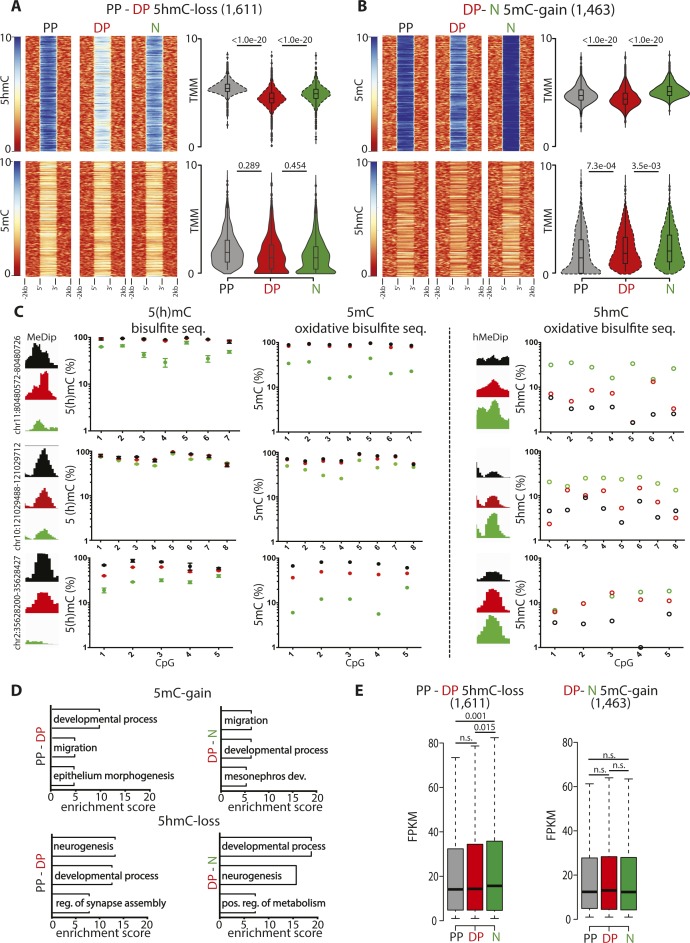
Figure S2. Validation and features of differentially (hydroxy-)methylated loci. (A, B) Heat maps (left) and violin plots (right) representing 5(h)mC levels within a ±2-kb region across differentially (hydroxy-)methylated loci in each cell type (colors, as indicated) and equivalent to Fig 2B and C but considering 5mC-gain/5hmC-loss loci in DP (1,611) or neurons (1,463) rather than the converse 5mC-loss/5hmC-gain loci and revealing the specificity in correlation of the latter but not the former modifications. (C) Distribution of (h)MeDip reads across selected regions showing differential (hydroxy-)methylation and validation at single-nucleotide resolution by (oxidative) bisulfite amplicon sequencing as indicated by each panel. (D, E) DAVID-gene ontology term enrichment (top three) (D) and whiskers–box plots of expression levels (FPKM) (E) of genes containing, or in proximity 5mC-gain/5hmC-loss loci complementary to the converse 5mC-loss/5hmC-gain loci shown in Fig 2E and F and showing the poor GO specificity and lack of correlation. Error bars in (C), left = SD; n = 3. Statistical test = Wilcoxon rank sum test (A, B, and E).
Figure S2. Validation and features of differentially (hydroxy-)methylated loci. (A, B) Heat maps (left) and violin plots (right) representing 5(h)mC levels within a ±2-kb region across differentially (hydroxy-)methylated loci in each cell type (colors, as indicated) and equivalent to Fig 2B and C but considering 5mC-gain/5hmC-loss loci in DP (1,611) or neurons (1,463) rather than the converse 5mC-loss/5hmC-gain loci and revealing the specificity in correlation of the latter but not the former modifications. (C) Distribution of (h)MeDip reads across selected regions showing differential (hydroxy-)methylation and validation at single-nucleotide resolution by (oxidative) bisulfite amplicon sequencing as indicated by each panel. (D, E) DAVID-gene ontology term enrichment (top three) (D) and whiskers–box plots of expression levels (FPKM) (E) of genes containing, or in proximity 5mC-gain/5hmC-loss loci complementary to the converse 5mC-loss/5hmC-gain loci shown in Fig 2E and F and showing the poor GO specificity and lack of correlation. Error bars in (C), left = SD; n = 3. Statistical test = Wilcoxon rank sum test (A, B, and E).CC BY · PubMed Central
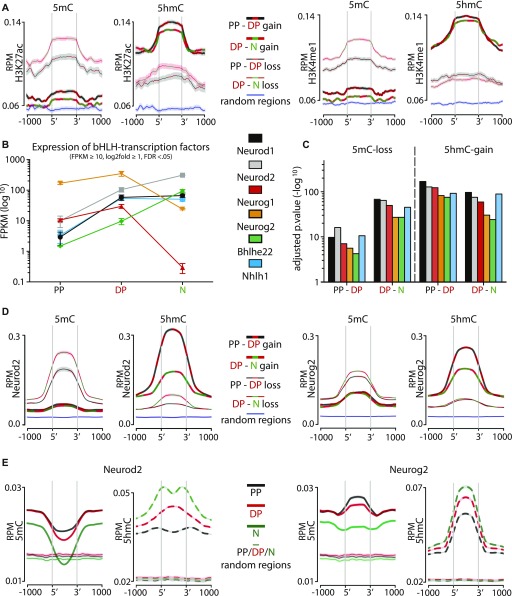
Figure 3. 5mC-loss/5hmC-gain loci are enriched in active enhancers and pioneer factor–binding motifs. (A) Distribution and abundance (RPM) of active enhancer marks including H3K27ac (left) or H3K4me1 (right) as depicted across a ±1-kb region of loci undergoing differential (hydroxy-)methylation. For these plots, all eight possible combinations were considered, namely, gain (thick lines) or loss (thin lines) in 5mC (left) or 5hmC (right) in the PP–DP (black/red lines) or DP–neuron (red/green lines) transition as well as random loci as negative controls (blue lines). Note the increase in both histone marks sharply at the 5′ and 3′ end of 5mC-loss/5hmC-gain, but not 5mC-gain/5hmC-loss, loci (heat maps are also shown in Fig S3A to appreciate individual loci). ChIP-Seq data for H3K27ac and H3K4me1 from the E14.5 mouse cortex were taken from the ENCODE project (Shen et al, 2012). Shadows represent the variance (SD) of the mean that in some cases was too small to be visibly depicted. (B, C) Expression levels (FPKM) of bHLH transcription factors up-regulated from PP to DP (B), and enrichment values of their binding motifs within 5mC-loss/5hmC-gain loci (C) (top five motifs are shown in Fig S3B). (D) Distribution and abundance (RPM) of Neurod2 and Neurog2 ChIP-Seq reads across a ±1-kb region including loci undergoing any of the eight possible combinations of differential (hydroxy-)methylation depicted as in A and including random loci as negative control (variance was too small to be depicted). (E) Converse analysis as in (D) with distribution and abundance (RPM) of 5(h)mC reads of PP (black), DP (red), N (green) plotted across Neurod2 (left)– and Neurog2 (right)–binding sites (bold) and random regions as negative control (left and right; thin lines).
Figure 3. 5mC-loss/5hmC-gain loci are enriched in active enhancers and pioneer factor–binding motifs. (A) Distribution and abundance (RPM) of active enhancer marks including H3K27ac (left) or H3K4me1 (right) as depicted across a ±1-kb region of loci undergoing differential (hydroxy-)methylation. For these plots, all eight possible combinations were considered, namely, gain (thick lines) or loss (thin lines) in 5mC (left) or 5hmC (right) in the PP–DP (black/red lines) or DP–neuron (red/green lines) transition as well as random loci as negative controls (blue lines). Note the increase in both histone marks sharply at the 5′ and 3′ end of 5mC-loss/5hmC-gain, but not 5mC-gain/5hmC-loss, loci (heat maps are also shown in Fig S3A to appreciate individual loci). ChIP-Seq data for H3K27ac and H3K4me1 from the E14.5 mouse cortex were taken from the ENCODE project (Shen et al, 2012). Shadows represent the variance (SD) of the mean that in some cases was too small to be visibly depicted. (B, C) Expression levels (FPKM) of bHLH transcription factors up-regulated from PP to DP (B), and enrichment values of their binding motifs within 5mC-loss/5hmC-gain loci (C) (top five motifs are shown in Fig S3B). (D) Distribution and abundance (RPM) of Neurod2 and Neurog2 ChIP-Seq reads across a ±1-kb region including loci undergoing any of the eight possible combinations of differential (hydroxy-)methylation depicted as in A and including random loci as negative control (variance was too small to be depicted). (E) Converse analysis as in (D) with distribution and abundance (RPM) of 5(h)mC reads of PP (black), DP (red), N (green) plotted across Neurod2 (left)– and Neurog2 (right)–binding sites (bold) and random regions as negative control (left and right; thin lines).CC BY · PubMed Central
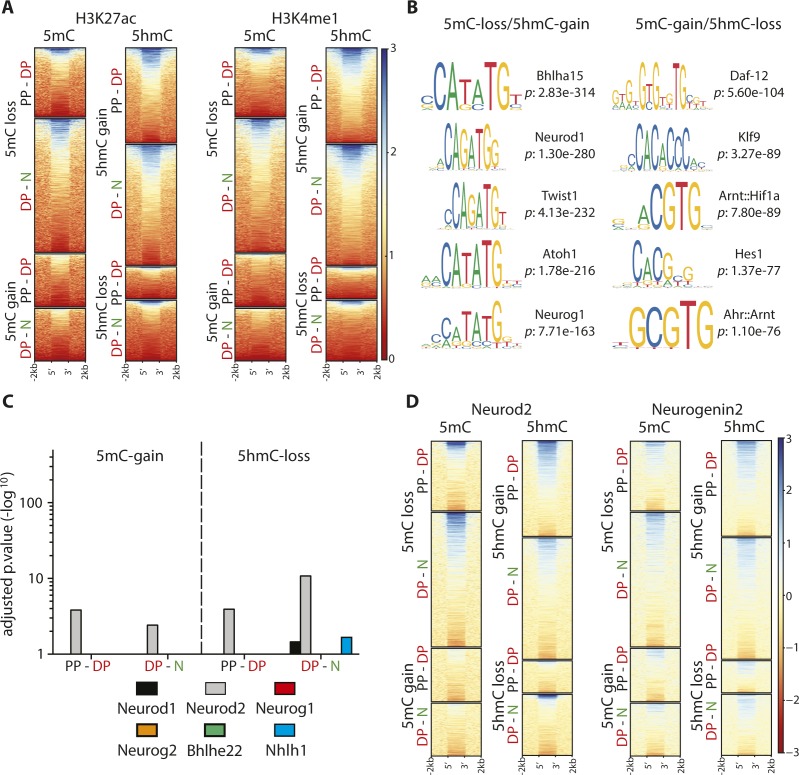
Figure S3. Binding motifs and enrichment of transcription factors. (A, D) Heat maps of H3K27ac and H3K4me (A) and Neurod2 and Neurog2 (D) levels within 5mC-loss/5hmC-gain loci extending the analysis of median levels depicted in Fig 3A and D and showing the extensive correlation in the two types of epigenetic modifications and transcription factors binding, respectively. (B, C) Top five most significantly (hypergeometric test) enriched transcription factor–binding motifs within loci undergoing differential (hydroxy-)methylation (B) and their lack of enrichment within 5mC-gain/5hmC-loss for the six transcription factors up-regulated in the PP–DP transition (C) (data extending the analyses depicted in Fig 3B and C).
Figure S3. Binding motifs and enrichment of transcription factors. (A, D) Heat maps of H3K27ac and H3K4me (A) and Neurod2 and Neurog2 (D) levels within 5mC-loss/5hmC-gain loci extending the analysis of median levels depicted in Fig 3A and D and showing the extensive correlation in the two types of epigenetic modifications and transcription factors binding, respectively. (B, C) Top five most significantly (hypergeometric test) enriched transcription factor–binding motifs within loci undergoing differential (hydroxy-)methylation (B) and their lack of enrichment within 5mC-gain/5hmC-loss for the six transcription factors up-regulated in the PP–DP transition (C) (data extending the analyses depicted in Fig 3B and C).CC BY · PubMed Central
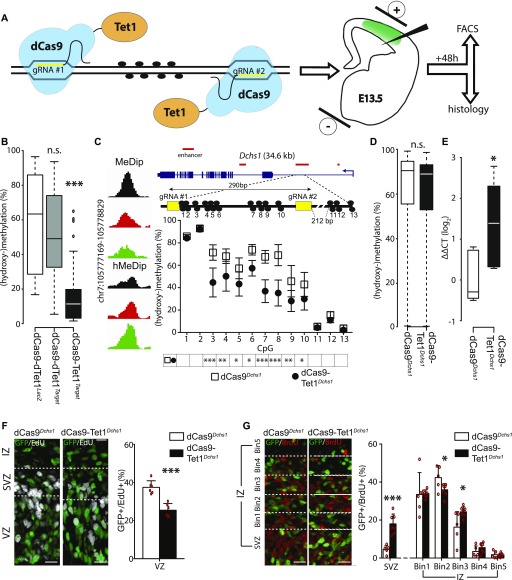
Figure 4. Site-specific manipulation of (hydroxy-)methylation. (A) Drawing depicting dCas9-Tet1 targeting of a locus of interest through the use of two gRNAs (yellow) to manipulate 5(h)mC at CpG dinucleotides (black circles) by in utero electroporation (right) of a vector including all components of interest plus GFP as reporter. (B) Whiskers–box plots depicting 5(h)mC levels of FAC-sorted GFP+ cells 48 h after in utero electroporation as assessed by bisulfite sequencing of 48 cytosines within four loci (individual loci and values are shown in Fig S4A). Note the major reduction in 5(h)mC upon use of dCas9-TetTarget constructs. (C) Screenshot of 5(h)mC levels in cell types (left) and drawing (in scale) of the Dchs1 locus and regions targeted by dCas9-TetDchs1 vectors (top). Assessment of 5(h)mC in GFP+ cells 48 h after in utero electroporation was performed as described in Figs 4B and S4A (bottom). (D) Whiskers–box plots depicting 5(h)mC levels assessed by bisulfite sequencing at top 10 predicted off-target regions (5 for each gRNA, 51 CpGs total) of FAC-sorted GFP+ cells 48 h after in utero electroporation of dCas9-TetDchs1 or dCas9Dchs1. (E) Dchs1 expression levels (ΔΔCT) calculated by qRT–PCR on GFP+ cells as described in (C). Note the ∼2.5-fold increase expression upon demethylation. (F, G) Pictures of the E15.5 mouse cortex (left) and quantifications (right) 24 h after electroporation under different conditions followed by (immuno-)labeling for GFP, EdU, or BrdU (as indicated). Boundaries of the SVZ with the VZ and IZ were assessed by Tbr2 staining (not shown) or equidistant bins through the IZ are indicated (dashed lines in E and F, respectively) in which GFP+ cells were expressed as proportion of their total number. Scale bar = 50 μm; bars = SD (SEM in C); n ≥ 6 (E and F); statistical test = t test; *P < 0.05; **P < 0.01; ***P < 0.001.
Figure 4. Site-specific manipulation of (hydroxy-)methylation. (A) Drawing depicting dCas9-Tet1 targeting of a locus of interest through the use of two gRNAs (yellow) to manipulate 5(h)mC at CpG dinucleotides (black circles) by in utero electroporation (right) of a vector including all components of interest plus GFP as reporter. (B) Whiskers–box plots depicting 5(h)mC levels of FAC-sorted GFP+ cells 48 h after in utero electroporation as assessed by bisulfite sequencing of 48 cytosines within four loci (individual loci and values are shown in Fig S4A). Note the major reduction in 5(h)mC upon use of dCas9-TetTarget constructs. (C) Screenshot of 5(h)mC levels in cell types (left) and drawing (in scale) of the Dchs1 locus and regions targeted by dCas9-TetDchs1 vectors (top). Assessment of 5(h)mC in GFP+ cells 48 h after in utero electroporation was performed as described in Figs 4B and S4A (bottom). (D) Whiskers–box plots depicting 5(h)mC levels assessed by bisulfite sequencing at top 10 predicted off-target regions (5 for each gRNA, 51 CpGs total) of FAC-sorted GFP+ cells 48 h after in utero electroporation of dCas9-TetDchs1 or dCas9Dchs1. (E) Dchs1 expression levels (ΔΔCT) calculated by qRT–PCR on GFP+ cells as described in (C). Note the ∼2.5-fold increase expression upon demethylation. (F, G) Pictures of the E15.5 mouse cortex (left) and quantifications (right) 24 h after electroporation under different conditions followed by (immuno-)labeling for GFP, EdU, or BrdU (as indicated). Boundaries of the SVZ with the VZ and IZ were assessed by Tbr2 staining (not shown) or equidistant bins through the IZ are indicated (dashed lines in E and F, respectively) in which GFP+ cells were expressed as proportion of their total number. Scale bar = 50 μm; bars = SD (SEM in C); n ≥ 6 (E and F); statistical test = t test; *P < 0.05; **P < 0.01; ***P < 0.001.CC BY · PubMed Central
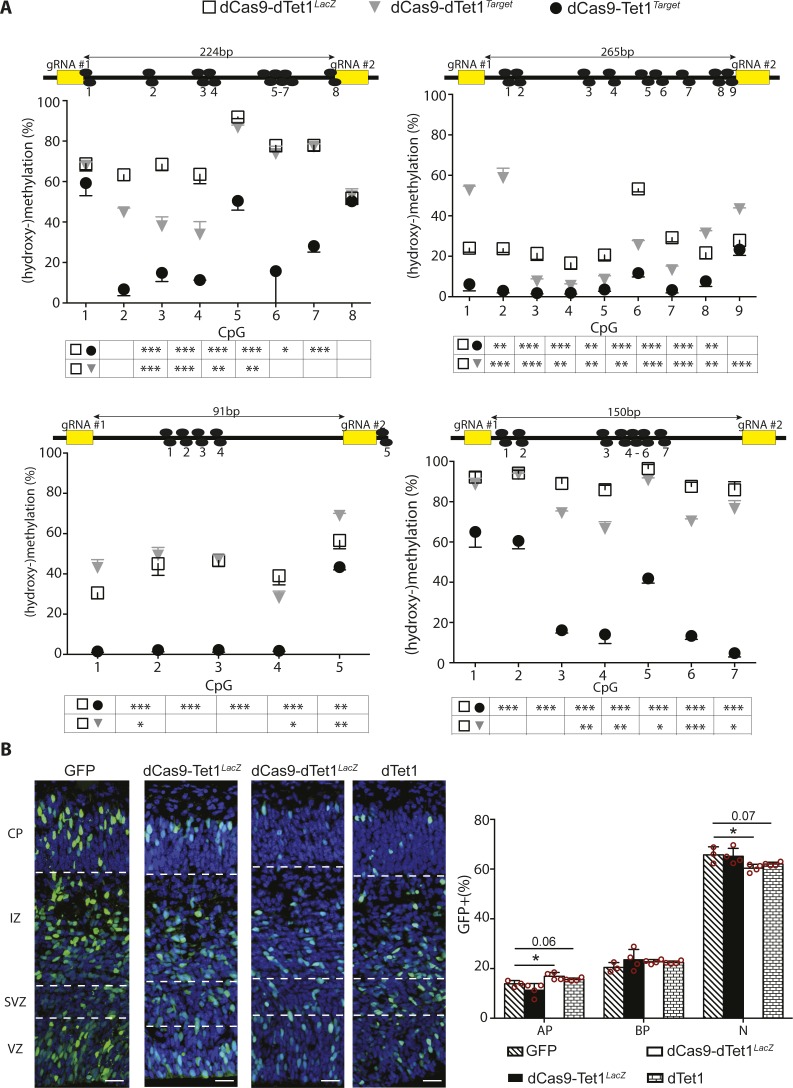
Figure S4. Locus-specific manipulation of methylation. (A) Drawing (in scale) of four loci (top) and assessment of 5(h)mC levels (bottom) by bisulfite sequencing upon electroporation in different conditions (legend) and extending the analysis shown in Fig 4B and C. Numbered black circles indicate CpG dinucleotides. (B) Fluorescence picture of the E15.5 mouse cortex 48 h upon electroporation with control vectors (left; as indicated) and immunostaining for GFP (green), Tbr2 (not shown), and DAPI counterstaining (blue) to calculate the proportion of GFP+ cells classified as PP (Tbr2− in the VZ), DP (Tbr2+ cells in the VZ/SVZ), and neurons (Tbr2− cells in the SVZ and all cells in the IZ/CP) (right). Scale bar = 50 μm; bars = SD; n ≥ 4; statistical test = t test; *P < 0.05, **P < 0.01, ***P < 0.001.
Figure S4. Locus-specific manipulation of methylation. (A) Drawing (in scale) of four loci (top) and assessment of 5(h)mC levels (bottom) by bisulfite sequencing upon electroporation in different conditions (legend) and extending the analysis shown in Fig 4B and C. Numbered black circles indicate CpG dinucleotides. (B) Fluorescence picture of the E15.5 mouse cortex 48 h upon electroporation with control vectors (left; as indicated) and immunostaining for GFP (green), Tbr2 (not shown), and DAPI counterstaining (blue) to calculate the proportion of GFP+ cells classified as PP (Tbr2− in the VZ), DP (Tbr2+ cells in the VZ/SVZ), and neurons (Tbr2− cells in the SVZ and all cells in the IZ/CP) (right). Scale bar = 50 μm; bars = SD; n ≥ 4; statistical test = t test; *P < 0.05, **P < 0.01, ***P < 0.001.CC BY · PubMed Central
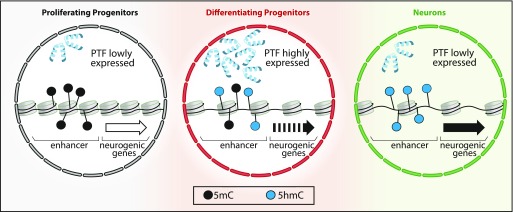
Figure 5. DNA (hydroxy-)methylation in neurogenic commitment. A model emerging from several studies (see text) suggests that pioneer transcription factors (PTFs) drive cell fate commitment and differentiation by remodeling chromatin. In this context, our data suggest that PTF up-regulated during the PP–DP transition are associated with oxidation of 5mC to 5hmC (black to blue dots) within enhancers of neurogenic genes. This results in priming of those genes (dotted to continuous arrow) and fate commitment of DP toward neurogenic division. This process is continued during the next cell division (DP-N) leading to higher levels of 5hmC, reinforced gene expression (continuous to bold arrow), and establishment of neuronal identity despite a possible down-regulation of PTF.
Figure 5. DNA (hydroxy-)methylation in neurogenic commitment. A model emerging from several studies (see text) suggests that pioneer transcription factors (PTFs) drive cell fate commitment and differentiation by remodeling chromatin. In this context, our data suggest that PTF up-regulated during the PP–DP transition are associated with oxidation of 5mC to 5hmC (black to blue dots) within enhancers of neurogenic genes. This results in priming of those genes (dotted to continuous arrow) and fate commitment of DP toward neurogenic division. This process is continued during the next cell division (DP-N) leading to higher levels of 5hmC, reinforced gene expression (continuous to bold arrow), and establishment of neuronal identity despite a possible down-regulation of PTF.CC BY · PubMed Central

Verification

Claims the paper makes

The claims and statistics of this paper haven’t been checked yet.

Run the check — free, no account needed. It reads the open-access text and checks the sources it cites.

A few free checks a day · papers already verified open instantly · results are public

Claims other papers make about this one

Each is checked against this paper’s own text: does it say what the citing paper says it does?

Self-check

Percentages, sums and reported differences re-computed from the paper’s own numbers.

The self-check needs the paper’s full text.

Citations

Cites

Show all 8 references

Research works printed but not linked: 51

  1. 10.1080/23262133.2014.995524 · DOI
  2. 10.1038/emboj.2013.245 · DOI
  3. 10.15252/embj.201490061 · DOI
  4. 10.1038/nrg.2017.57 · DOI
  5. 10.1016/j.molcel.2013.01.038 · DOI · Paper page
  6. 10.1038/ng.2765 · DOI
  7. 10.1016/j.gdata.2016.02.003 · DOI
  8. 10.1038/s41588-017-0034-3 · DOI
  9. 10.1242/dev.01912 · DOI
  10. 10.1016/j.jsbmb.2012.01.009 · DOI
  11. 10.1007/s13238-016-0267-4 · DOI
  12. 10.1038/nn.2900 · DOI · Paper page
  13. 10.1016/j.celrep.2013.01.011 · DOI
  14. 10.1126/science.1210944 · DOI
  15. 10.1038/nrn2810 · DOI
  16. 10.1016/j.molcel.2014.08.026 · DOI
  17. 10.1038/nn.4181 · DOI · Paper page
  18. 10.1016/j.neuron.2013.08.032 · DOI
  19. 10.1016/j.diff.2015.10.003 · DOI
  20. 10.1016/j.ceb.2013.02.014 · DOI
  21. 10.1038/onc.2010.481 · DOI
  22. 10.1016/j.conb.2012.03.006 · DOI
  23. 10.1101/gad.248005.114 · DOI
  24. 10.1016/j.cell.2011.06.030 · DOI · Paper page
  25. 10.1016/j.celrep.2016.12.001 · DOI · Paper page
  26. 10.1038/nbt.2726 · DOI
  27. 10.1101/gr.211466.116 · DOI
  28. 10.3791/52488 · DOI
  29. 10.1016/j.neuron.2015.05.018 · DOI · Paper page
  30. 10.1038/nbt.3658 · DOI
  31. 10.1002/dvdy.21176 · DOI
  32. 10.1101/gad.1470906 · DOI
  33. 10.15252/embj.201591206 · DOI
  34. 10.1016/j.neuron.2013.08.003 · DOI
  35. 10.1016/j.stem.2018.08.016 · DOI
  36. 10.1016/j.stemcr.2016.09.013 · DOI
  37. 10.1038/nrg3354 · DOI · Paper page
  38. 10.1038/nbt.1732 · DOI
  39. 10.1126/science.1240622 · DOI
  40. 10.3389/fnins.2018.00005 · DOI
  41. 10.1126/science.1170116 · DOI · Paper page
  42. 10.1093/nar/gkt091 · DOI
  43. 10.1146/annurev-cellbio-101011-155801 · DOI
  44. 10.1016/j.stem.2016.11.006 · DOI · Paper page
  45. 10.1093/nar/gkw159 · DOI
  46. 10.1016/j.ygeno.2014.08.020 · DOI
  47. 10.1038/srep07645 · DOI
  48. 10.1038/nrn.2016.70 · DOI
  49. 10.1016/j.stem.2013.05.006 · DOI
  50. 10.1016/j.neuron.2015.11.030 · DOI
  51. 10.1038/nature13990 · DOI

Cited by

Sorted by citations

Metadata

Authors
Noack, F., Pataskar, A., Schneider, M., Buchholz, F., Tiwari, V. K., & Calegari, F.
Affiliations
  • CRTD-Center for Regenerative Therapies, School of Medicine, Technische Universität Dresden, Dresden, Germany
  • Institute of Molecular Biology, Mainz, Germany
  • Medical Systems Biology, School of Medicine, Technische Universität Dresden and Max Planck Institute for Molecular Cell Biology and Genetics, Dresden, Germany
Venue
Life Science Alliance
Published
2019-02-27
Volume
2
Issue
2
Pages
e201900331
ISSN
2575-1077
Cited by
29
References
8
Language
en
Funders
  • CRTD
  • DFG

About these checks

Registry, retraction, Cites and statistics results are computed, not judged, with one exception: a printed reference that no index lists is read once by a model before it counts as a citation error. Claims are extracted by a model and kept only when their quote appears verbatim in the text; each cited source is then checked, with a model’s help, for whether it says what the claim relies on. Those verdicts can be wrong — read the claim’s quote and the cited source before relying on one.

Statistics and arithmetic are recomputed, not judged.

Confidence bands are shown only for fields calibrated on our annotated test set. None is calibrated yet, so no band is shown.

What counts as a claim ›How we measure confidence ›How we check this ›

Are you an author, or do you see a problem with this page? Request a review