Cited by 9Bacteriophages and microbial interactionsAdvanced Electron Microscopy Techniques and ApplicationsEnzyme Structure and Function

The DOI matches its Crossref record; 6 of the 6 references it cites were found in a registry or an index.

Molecular mechanism of bacteriophage contraction structure of an S-layer–penetrating bacteriophage

Open access

Published version of a preprint

Abstract

The molecular details of phage tail contraction and bacterial cell envelope penetration remain poorly understood and are completely unknown for phages infecting bacteria enveloped by proteinaceous S-layers. Here, we reveal the extended and contracted atomic structures of an intact contractile-tailed phage (φCD508) that binds to and penetrates the protective S-layer of the Gram-positive human pathogen Clostridioides difficile . The tail is unusually long (225 nm), and it is also notable that the tail contracts less than those studied in related contractile injection systems such as the model phage T4 (∼20% compared with ∼50%). Surprisingly, we find no evidence of auxiliary enzymatic domains that other phages exploit in cell wall penetration, suggesting that sufficient energy is released upon tail contraction to penetrate the S-layer and the thick cell wall without enzymatic activity. Instead, the unusually long tail length, which becomes more flexible upon contraction, likely contributes toward the required free energy release for envelope penetration.

Overview

The claims and statistics of this paper haven’t been checked yet.

Run the check — free, no account needed. It reads the open-access text and checks the sources it cites.

A few free checks a day · papers already verified open instantly · results are public

Integrity signals

Registry

Crossref · 10.26508/lsa.202403088

Cites

6 of 6 references verified0 citation errors · 0 not checkable

Statistics

Figures

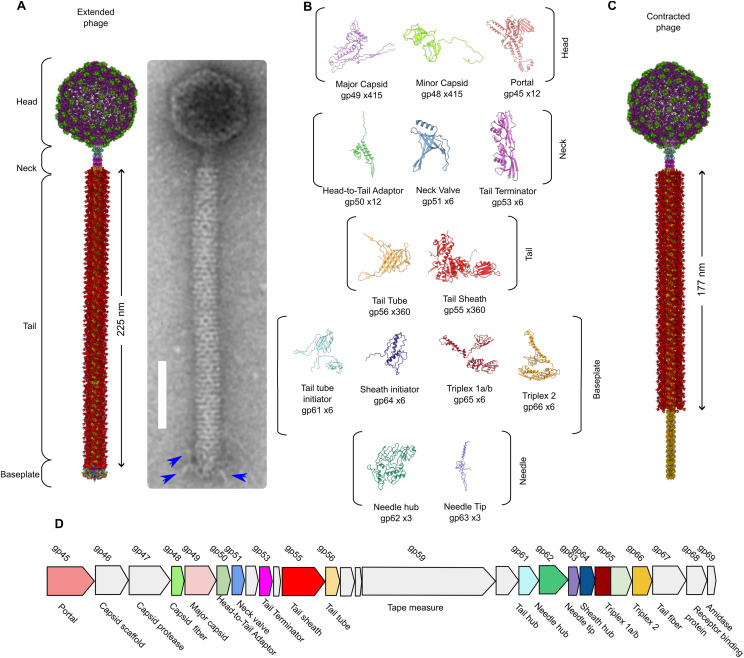
Figure 1. Structural overview of φCD508. (A) Composite model of entire extended φCD508 phage generated from overlapping features of each model (left). Negative stain image of φCD508 with clear tail fibers attached to the baseplate (right). (B) Gallery of proteins built into cryoEM maps of φCD508, with protein name, gene product number, and copy number in the entire extended phage. (C) Composite model of entire contracted φCD508 phage generated from overlapping features of each model. (D) Genome organization of the φCD508 structural cassette consisting of gene products 45–68. Proteins built into cryoEM maps are colored as in the gallery, and proteins, where no model could be built, are colored gray.
Figure 1. Structural overview of φCD508. (A) Composite model of entire extended φCD508 phage generated from overlapping features of each model (left). Negative stain image of φCD508 with clear tail fibers attached to the baseplate (right). (B) Gallery of proteins built into cryoEM maps of φCD508, with protein name, gene product number, and copy number in the entire extended phage. (C) Composite model of entire contracted φCD508 phage generated from overlapping features of each model. (D) Genome organization of the φCD508 structural cassette consisting of gene products 45–68. Proteins built into cryoEM maps are colored as in the gallery, and proteins, where no model could be built, are colored gray.CC BY · PubMed Central
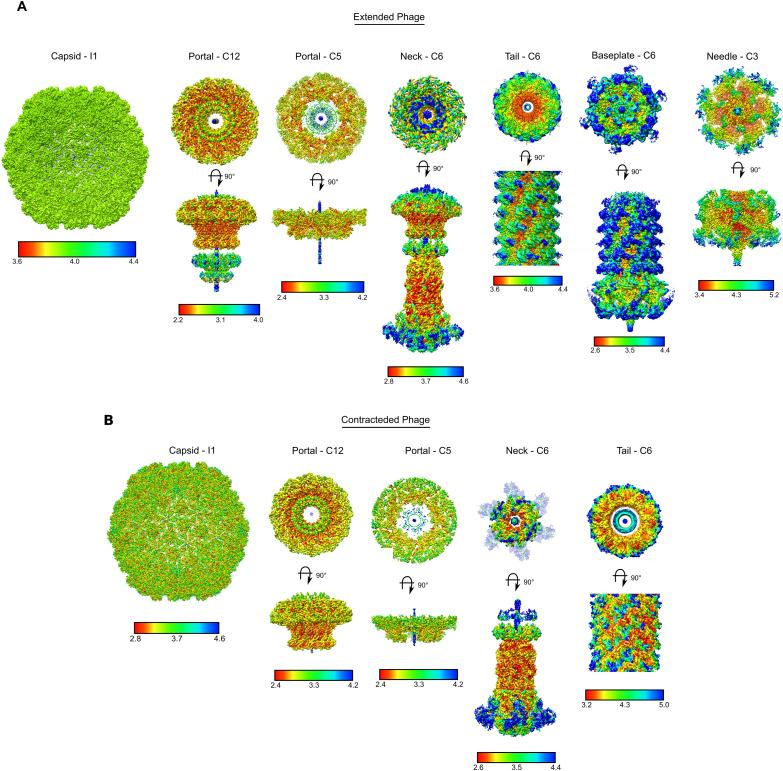
Figure S1. CryoEM map local resolution plots. (A) CryoEM reconstruction maps for extended φCD508 phage, colored based on the resolution estimate at each voxel. (B) CryoEM reconstruction maps for contracted φCD508 phage, colored based on the resolution estimate at each voxel. Plots were calculated using cryoSPARC and colored from low resolution (blue) to high resolution (red) with scales given for each map.
Figure S1. CryoEM map local resolution plots. (A) CryoEM reconstruction maps for extended φCD508 phage, colored based on the resolution estimate at each voxel. (B) CryoEM reconstruction maps for contracted φCD508 phage, colored based on the resolution estimate at each voxel. Plots were calculated using cryoSPARC and colored from low resolution (blue) to high resolution (red) with scales given for each map.CC BY · PubMed Central
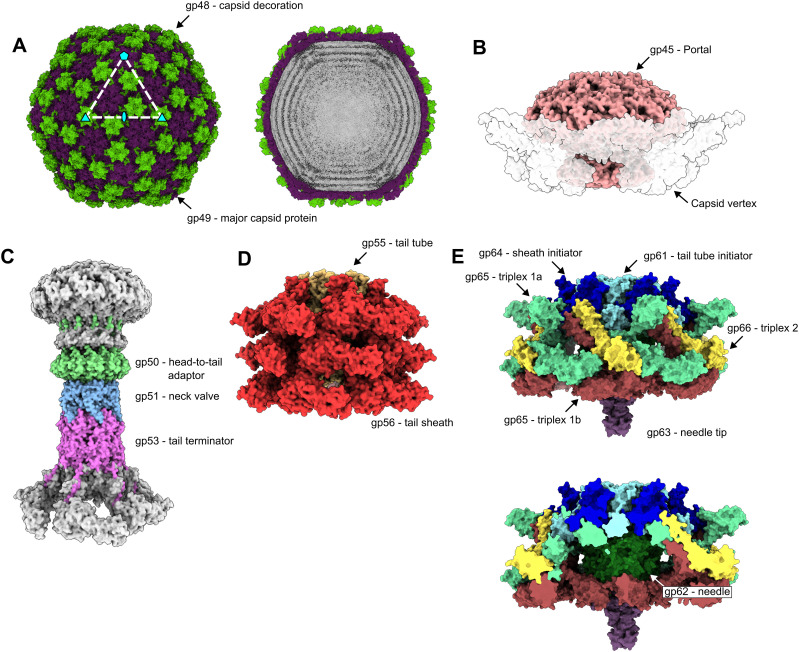
Figure 2. Structural assemblies of φCD508. Shaded surface representation of φCD508 assemblies as determined by single-particle analysis. (A) Capsid consisting of gp48 and gp49. Slice through extended phage capsid shows DNA layers (right). (B) Portal protein dodecamer within the unique pentameric capsid vertex (shown with a transparent surface). (C) Neck proteins shaded by protein identity (head-to-tail adaptor = green, neck valve = blue, tail terminator = pink), with portal and sheath proteins shown in gray for context. (D) Three layers of sheath (red) and tail tube protein (orange) in the extended state. (E) Baseplate and needle assembly with hub (blue and cyan), wedge (yellow, mint, and brown), and needle (green and purple).
Figure 2. Structural assemblies of φCD508. Shaded surface representation of φCD508 assemblies as determined by single-particle analysis. (A) Capsid consisting of gp48 and gp49. Slice through extended phage capsid shows DNA layers (right). (B) Portal protein dodecamer within the unique pentameric capsid vertex (shown with a transparent surface). (C) Neck proteins shaded by protein identity (head-to-tail adaptor = green, neck valve = blue, tail terminator = pink), with portal and sheath proteins shown in gray for context. (D) Three layers of sheath (red) and tail tube protein (orange) in the extended state. (E) Baseplate and needle assembly with hub (blue and cyan), wedge (yellow, mint, and brown), and needle (green and purple).CC BY · PubMed Central
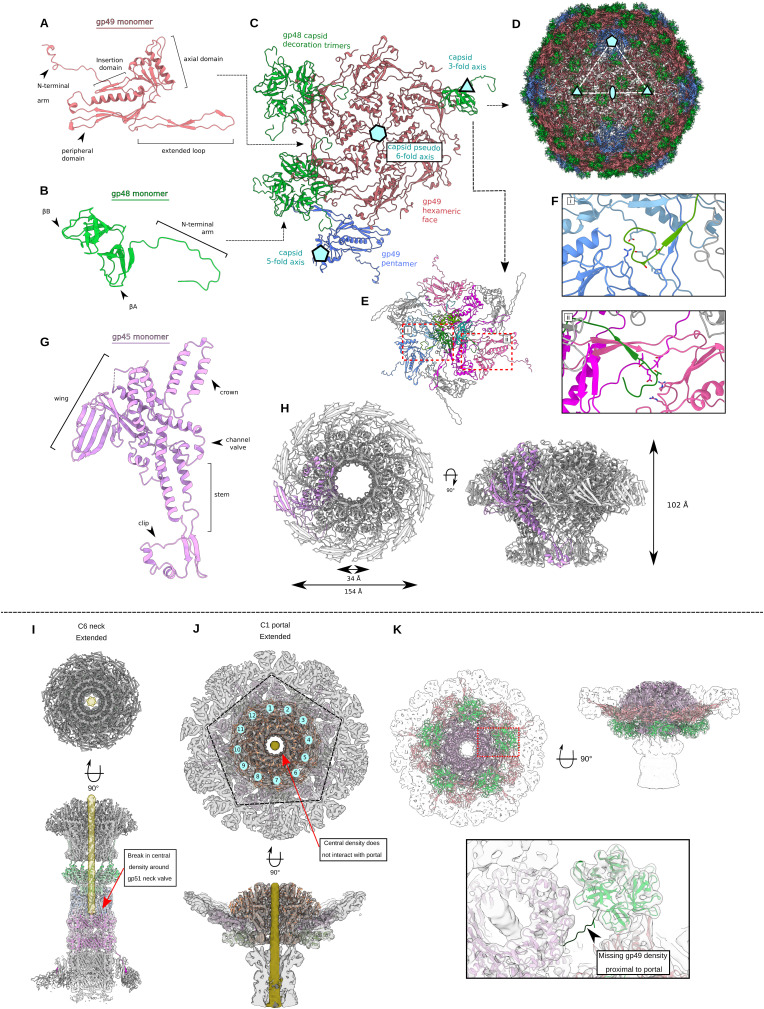
Figure S2. Capsid and portal interactions. (A) Cartoon representation of the gp49 major capsid protein with domain features highlighted. (B) Cartoon representation of the gp48 capsid decoration protein monomer with domain features highlighted. (C) Cartoon representation of the capsomer asymmetric unit with the gp49 penton vertex protein in blue. Symmetry and pseudosymmetry axes are highlighted. (A, B, C, D) Cartoon representation of assembled capsid, colored as in (A, B, C). (E) Organization of nine gp49 capsid proteins that interact with each gp48 trimer. (F) Insets show specific interactions formed between the capsid decoration and major capsid proteins at the (i) pentamer vertex and (ii) hexamer face. (G) Cartoon representation of the gp45 portal protein monomer with domain features highlighted. (H) Portal dodecameric assembly with portal dimensions highlighted. (I) CryoEM density of C6 neck reconstruction with cartoon models also shown. DNA density is highlighted in yellow, shown to stop at the gp51 neck valve assembly. (J) CryoEM density of C1 portal/capsid assembly showing the symmetry mismatch between the pentamer capsid vertex and the dodecameric portal. DNA density shown in yellow does not form interactions with any portal proteins. (K) CryoEM density of C1 portal/capsid assembly showing the symmetry mismatch between gp48 capsid decoration trimers and the dodecameric portal assembly. Inset shows lacking density for the N-terminal arm of one portal-proximal gp48 protein.
Figure S2. Capsid and portal interactions. (A) Cartoon representation of the gp49 major capsid protein with domain features highlighted. (B) Cartoon representation of the gp48 capsid decoration protein monomer with domain features highlighted. (C) Cartoon representation of the capsomer asymmetric unit with the gp49 penton vertex protein in blue. Symmetry and pseudosymmetry axes are highlighted. (A, B, C, D) Cartoon representation of assembled capsid, colored as in (A, B, C). (E) Organization of nine gp49 capsid proteins that interact with each gp48 trimer. (F) Insets show specific interactions formed between the capsid decoration and major capsid proteins at the (i) pentamer vertex and (ii) hexamer face. (G) Cartoon representation of the gp45 portal protein monomer with domain features highlighted. (H) Portal dodecameric assembly with portal dimensions highlighted. (I) CryoEM density of C6 neck reconstruction with cartoon models also shown. DNA density is highlighted in yellow, shown to stop at the gp51 neck valve assembly. (J) CryoEM density of C1 portal/capsid assembly showing the symmetry mismatch between the pentamer capsid vertex and the dodecameric portal. DNA density shown in yellow does not form interactions with any portal proteins. (K) CryoEM density of C1 portal/capsid assembly showing the symmetry mismatch between gp48 capsid decoration trimers and the dodecameric portal assembly. Inset shows lacking density for the N-terminal arm of one portal-proximal gp48 protein.CC BY · PubMed Central
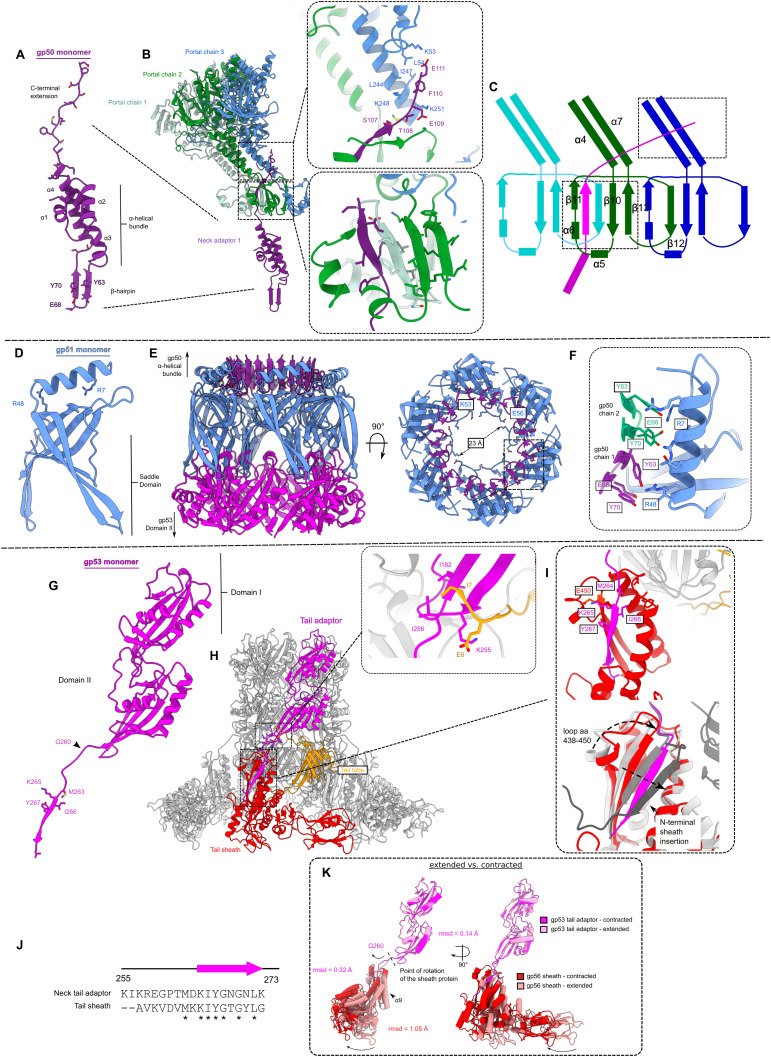
Figure S3. Neck interactions. (A) Cartoon representation of gp50 head-to-tail adaptor protein monomer with domain features highlighted. (B) Cartoon representation of gp51 monomer interacting with three unique portal chains. Insets show specific interactions between (i) C-terminal extension of gp50 and portal chain 2 and 3 stem domains, and (ii) β-sheet formed by insertion of C-terminal extension of gp50 into portal chain 1 and 2 clip domains. (B, C) Schematic representation of interactions highlighted in (B). (D) Cartoon representation of gp51 neck valve protein monomer with domain features highlighted. (E) Cartoon representation of hexameric assembly of gp51, and interactions with gp50 (purple) and gp53 (magenta). (F) Inset shows symmetry mismatch interactions between dodecameric gp50 and hexameric gp51. (G) Cartoon representation of the gp53 portal protein monomer with domain features highlighted. (H) Cartoon representation of hexameric assembly of gp53, and interactions formed with sheath protein (red) and tail tube protein (orange). The inset shows the specific interaction between gp53 and the tail tube protein. (I) Comparison of gp53 β-strand interaction with the terminal sheath protein (top) with intermediate sheath protein mesh network (bottom, gray). (J) Sequence similarity between tail terminator C-terminal strand and sheath protein β-strand. (K) Comparison between the extended (pink) and the contracted (red) state of the neck-proximal sheath proteins, showing that the movement is a rigid body pivot around Gly260.
Figure S3. Neck interactions. (A) Cartoon representation of gp50 head-to-tail adaptor protein monomer with domain features highlighted. (B) Cartoon representation of gp51 monomer interacting with three unique portal chains. Insets show specific interactions between (i) C-terminal extension of gp50 and portal chain 2 and 3 stem domains, and (ii) β-sheet formed by insertion of C-terminal extension of gp50 into portal chain 1 and 2 clip domains. (B, C) Schematic representation of interactions highlighted in (B). (D) Cartoon representation of gp51 neck valve protein monomer with domain features highlighted. (E) Cartoon representation of hexameric assembly of gp51, and interactions with gp50 (purple) and gp53 (magenta). (F) Inset shows symmetry mismatch interactions between dodecameric gp50 and hexameric gp51. (G) Cartoon representation of the gp53 portal protein monomer with domain features highlighted. (H) Cartoon representation of hexameric assembly of gp53, and interactions formed with sheath protein (red) and tail tube protein (orange). The inset shows the specific interaction between gp53 and the tail tube protein. (I) Comparison of gp53 β-strand interaction with the terminal sheath protein (top) with intermediate sheath protein mesh network (bottom, gray). (J) Sequence similarity between tail terminator C-terminal strand and sheath protein β-strand. (K) Comparison between the extended (pink) and the contracted (red) state of the neck-proximal sheath proteins, showing that the movement is a rigid body pivot around Gly260.CC BY · PubMed Central
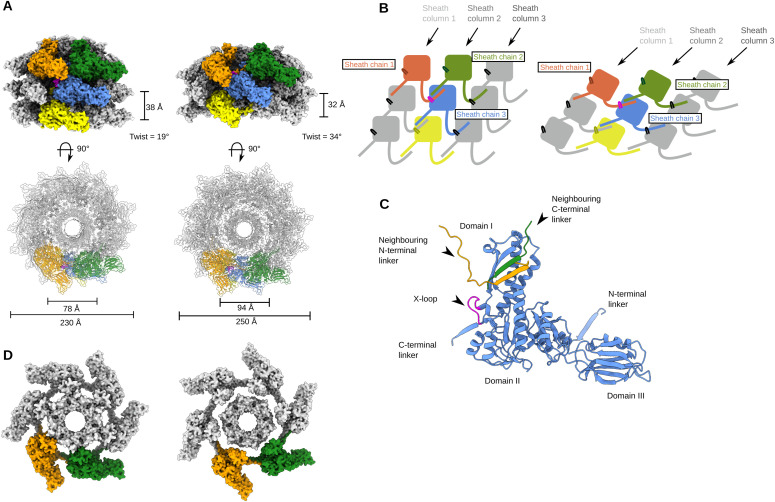
Figure 3. Reduced contraction of the φCD508 sheath, relative to other contractile injection systems. (A) Surface rendering of the extended tail (left) and contracted tail (right), showing helical parameters of sheath proteins and inner and outer sheath dimensions. Four interwoven chains are colored (orange, green, blue, and yellow), and the X-loop for the blue chain is shown in magenta. (A, B) Schematic of the mesh network between sheath layers colored as in (A). (A, C) Cartoon representation of a single sheath protein showing domain architecture and the X-loop region, colored as in (A). Also shown are the C-terminal linker and the N-terminal linker that form the extended mesh between neighboring chains. (A, D) Surface rendering of the top layer of the sheath and tail tube proteins as in (A). In the extended state (left), the sheath forms extensive interactions between the sheath and the tail tube. In the contracted form (right), the modeled tail tube is able to pass through the sheath ring.
Figure 3. Reduced contraction of the φCD508 sheath, relative to other contractile injection systems. (A) Surface rendering of the extended tail (left) and contracted tail (right), showing helical parameters of sheath proteins and inner and outer sheath dimensions. Four interwoven chains are colored (orange, green, blue, and yellow), and the X-loop for the blue chain is shown in magenta. (A, B) Schematic of the mesh network between sheath layers colored as in (A). (A, C) Cartoon representation of a single sheath protein showing domain architecture and the X-loop region, colored as in (A). Also shown are the C-terminal linker and the N-terminal linker that form the extended mesh between neighboring chains. (A, D) Surface rendering of the top layer of the sheath and tail tube proteins as in (A). In the extended state (left), the sheath forms extensive interactions between the sheath and the tail tube. In the contracted form (right), the modeled tail tube is able to pass through the sheath ring.CC BY · PubMed Central
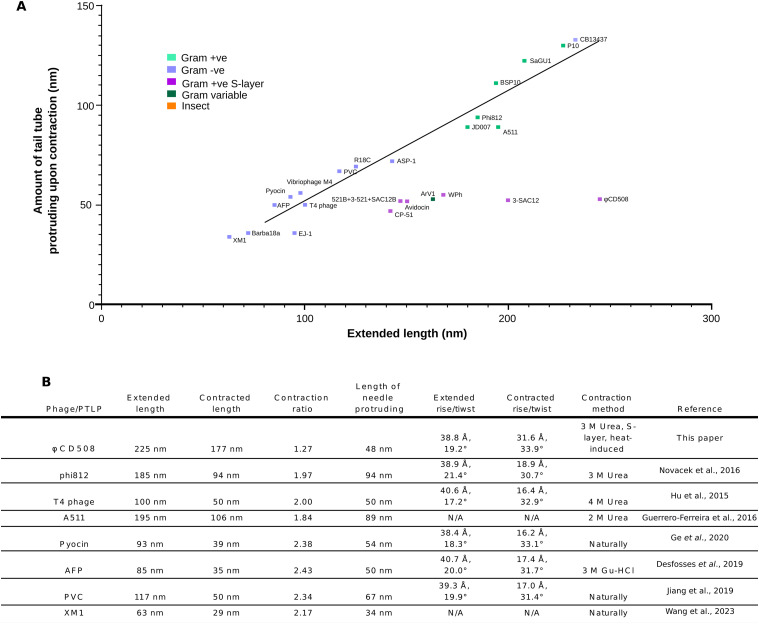
Figure 4. Comparison of contraction parameters in CISs. (A) Graph of the extended tail length versus the amount of tail tube protruding upon contraction for a number of contractile bacteriophage and phage tail-like particles from the literature. Each particle is colored based on the bacterial/insect host type. “Conventional” virions fit well along a trendline (R2 = 0.975), whereas S-layer–penetrating phages and diffocins of Gram-positive bacteria (including CD508 in the current study) have a tail tube protrusion length independent of tail length. (B) Table of tail parameters for bacteriophage and phage tail–like particles for which structural data are available.
Figure 4. Comparison of contraction parameters in CISs. (A) Graph of the extended tail length versus the amount of tail tube protruding upon contraction for a number of contractile bacteriophage and phage tail-like particles from the literature. Each particle is colored based on the bacterial/insect host type. “Conventional” virions fit well along a trendline (R2 = 0.975), whereas S-layer–penetrating phages and diffocins of Gram-positive bacteria (including CD508 in the current study) have a tail tube protrusion length independent of tail length. (B) Table of tail parameters for bacteriophage and phage tail–like particles for which structural data are available.CC BY · PubMed Central
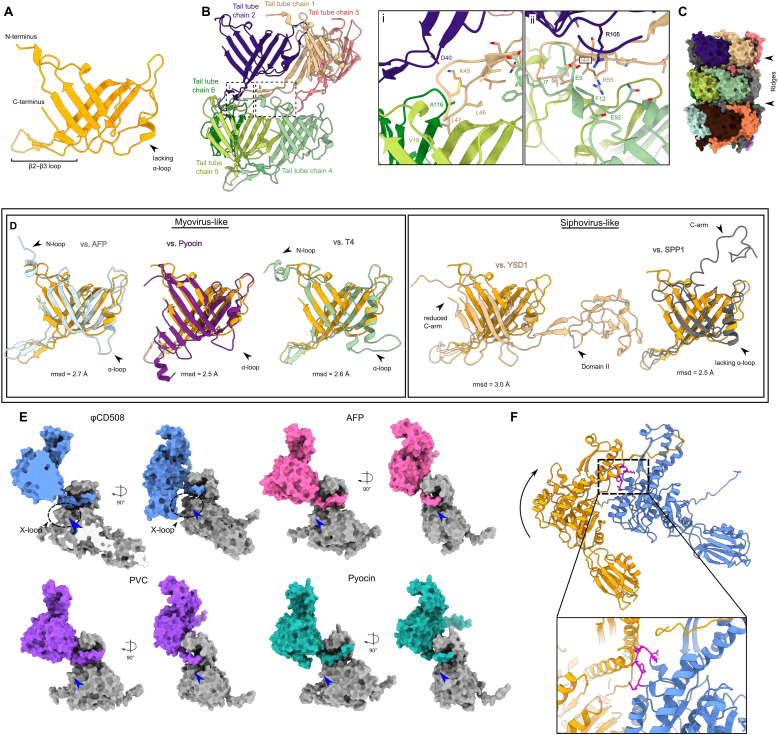
Figure S4. Sheath and tail tube interactions. (A) Cartoon representation of tail tube protein with domain features highlighted. (B) Cartoon representation of extensive interactions formed between each tail tube protein. Insets show (i) interactions between chain 1 and chains 2, 5, and 6, and (ii) the clamp between chains 2 and 4. (C) Surface rendering of three layers of tail tube protein, showing the large ridges formed by the lack of an ɑ-loop in the gp56 tail tube. (D) Comparison between the φCD508 tail tube protein and known structures for myovirus tail tubes (left), and siphovirus tail tubes (right), with features such as N-loop, ɑ-loop, and C-arm highlighted. (E) Surface rendering of the sheath N-terminal linker handshake between neighboring sheath proteins for φCD508 (blue) and myovirus structural homologs. φCD508 contains an X-loop formed of residues 368–378, missing in other known sheath protein structures (blue arrow). (F) Cartoon model of two sheath proteins as colored in Fig 3A fitted onto the contracted structure of pyocin sheath proteins. For the conventional contraction extent of 50%, the X-loop (magenta) clashes severely with the neighboring sheath chain.
Figure S4. Sheath and tail tube interactions. (A) Cartoon representation of tail tube protein with domain features highlighted. (B) Cartoon representation of extensive interactions formed between each tail tube protein. Insets show (i) interactions between chain 1 and chains 2, 5, and 6, and (ii) the clamp between chains 2 and 4. (C) Surface rendering of three layers of tail tube protein, showing the large ridges formed by the lack of an ɑ-loop in the gp56 tail tube. (D) Comparison between the φCD508 tail tube protein and known structures for myovirus tail tubes (left), and siphovirus tail tubes (right), with features such as N-loop, ɑ-loop, and C-arm highlighted. (E) Surface rendering of the sheath N-terminal linker handshake between neighboring sheath proteins for φCD508 (blue) and myovirus structural homologs. φCD508 contains an X-loop formed of residues 368–378, missing in other known sheath protein structures (blue arrow). (F) Cartoon model of two sheath proteins as colored in Fig 3A fitted onto the contracted structure of pyocin sheath proteins. For the conventional contraction extent of 50%, the X-loop (magenta) clashes severely with the neighboring sheath chain.CC BY · PubMed Central
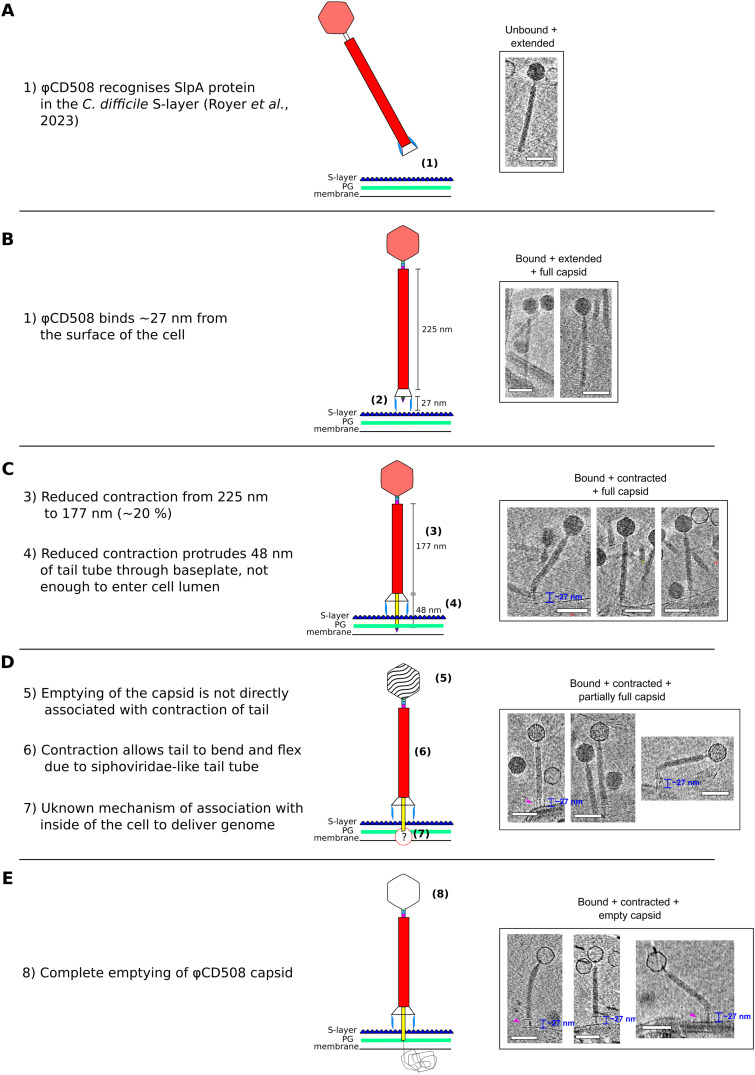
Figure 5. Model for φCD508 reduced contraction. Schematic model and description of φCD508 infection, with a gallery of φCD508 bacteriophage bound to S-layer fragments from cryoelectron tomograms. The order of images follows the predicted model of phage infection, building on the known stages of phage contraction for other phages, as well as highlighting novel stages for φCD508 and speculative stages requiring more study. (A, B, C, D, E) These include well-characterized stages of free extended phage (A), attachment to the S-layer surface (Royer et al, 2023) (B), contraction but no DNA release from the capsid (C), partial emptying of the capsid (D), and empty capsids (E). Stages ii-v show examples where the phage is able to bend once contracted. Scale bar = 100 nm.
Figure 5. Model for φCD508 reduced contraction. Schematic model and description of φCD508 infection, with a gallery of φCD508 bacteriophage bound to S-layer fragments from cryoelectron tomograms. The order of images follows the predicted model of phage infection, building on the known stages of phage contraction for other phages, as well as highlighting novel stages for φCD508 and speculative stages requiring more study. (A, B, C, D, E) These include well-characterized stages of free extended phage (A), attachment to the S-layer surface (Royer et al, 2023) (B), contraction but no DNA release from the capsid (C), partial emptying of the capsid (D), and empty capsids (E). Stages ii-v show examples where the phage is able to bend once contracted. Scale bar = 100 nm.CC BY · PubMed Central
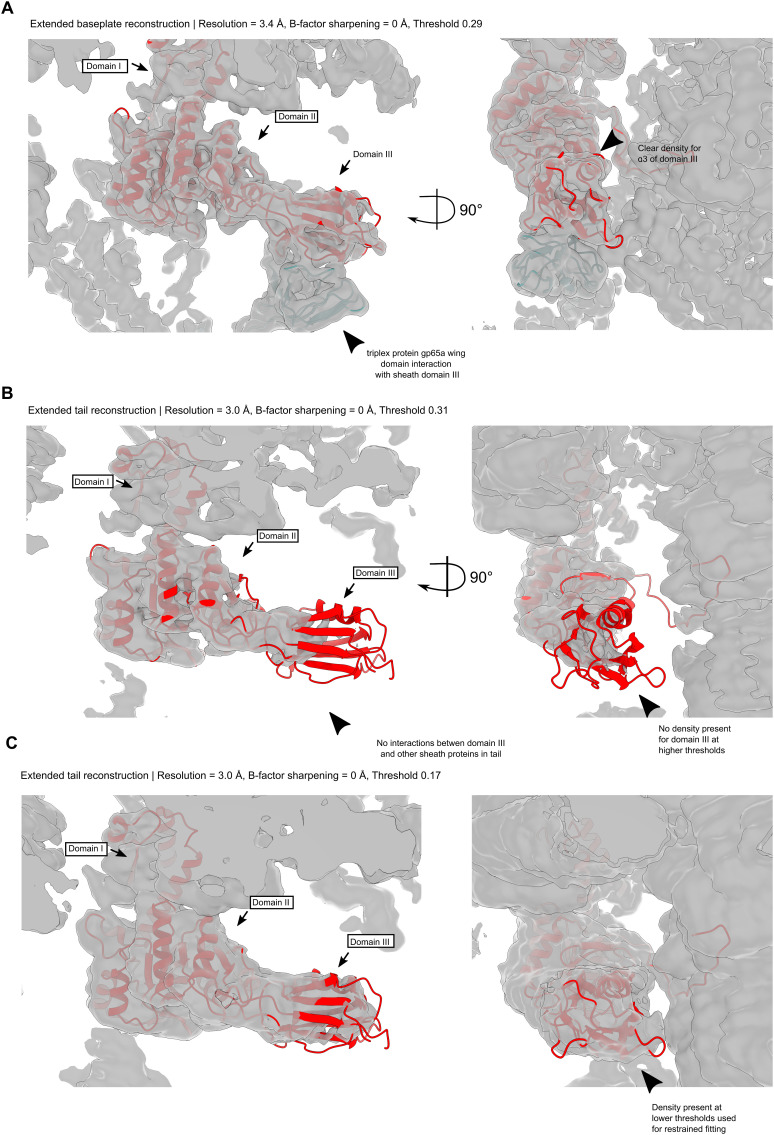
Figure S5. Sheath cryoEM map density fits. (A) Unsharpened sheath protein cryoEM density for the baseplate-proximal sheath layer, thresholded at σ = 0.29. The association of domain III with the triplex protein gp65a wing domain increases the order of the region such that good density is present for domain III. (B) Unsharpened sheath protein cryoEM density for the tail reconstruction, thresholded at σ = 0.17. Some density is apparent for flexible fitting of the baseplate-proximal sheath model, but not for de novo model building. (C) Unsharpened sheath protein cryoEM density for the tail reconstruction, thresholded at σ = 0.31. Domains I and II reside in strong density, but domain III lacks density because of flexibility in the region.
Figure S5. Sheath cryoEM map density fits. (A) Unsharpened sheath protein cryoEM density for the baseplate-proximal sheath layer, thresholded at σ = 0.29. The association of domain III with the triplex protein gp65a wing domain increases the order of the region such that good density is present for domain III. (B) Unsharpened sheath protein cryoEM density for the tail reconstruction, thresholded at σ = 0.17. Some density is apparent for flexible fitting of the baseplate-proximal sheath model, but not for de novo model building. (C) Unsharpened sheath protein cryoEM density for the tail reconstruction, thresholded at σ = 0.31. Domains I and II reside in strong density, but domain III lacks density because of flexibility in the region.CC BY · PubMed Central
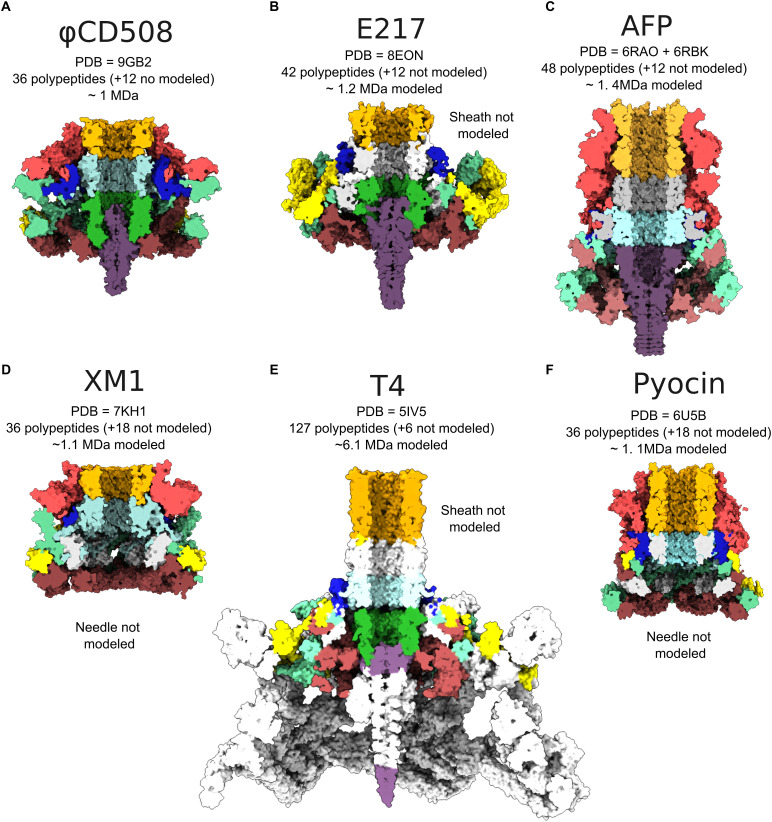
Figure S6. Baseplate comparison between φCD508 and other tailed phages. (A) Central slice through surface representation of φCD508 as colored in Fig 1. (B, C, D, E, F) Baseplate of (B) pyocin (PDB 6U5B), (C) AFP (PDB 6RBK and 6RAO combined), (D) XM1 (7KH1), (E) T4 phage (PDB 5IV5), and (F) E217 (PDB 8EON) colored corresponding to equivalent proteins in φCD508. Proteins with no similar structure in φCD508 are colored in gray. PDB accessions, numbers of baseplate (not including the tail sheath or tail tube) polypeptides modeled and unmodeled, and approximate modeled baseplate molecular weight are given for each example.
Figure S6. Baseplate comparison between φCD508 and other tailed phages. (A) Central slice through surface representation of φCD508 as colored in Fig 1. (B, C, D, E, F) Baseplate of (B) pyocin (PDB 6U5B), (C) AFP (PDB 6RBK and 6RAO combined), (D) XM1 (7KH1), (E) T4 phage (PDB 5IV5), and (F) E217 (PDB 8EON) colored corresponding to equivalent proteins in φCD508. Proteins with no similar structure in φCD508 are colored in gray. PDB accessions, numbers of baseplate (not including the tail sheath or tail tube) polypeptides modeled and unmodeled, and approximate modeled baseplate molecular weight are given for each example.CC BY · PubMed Central
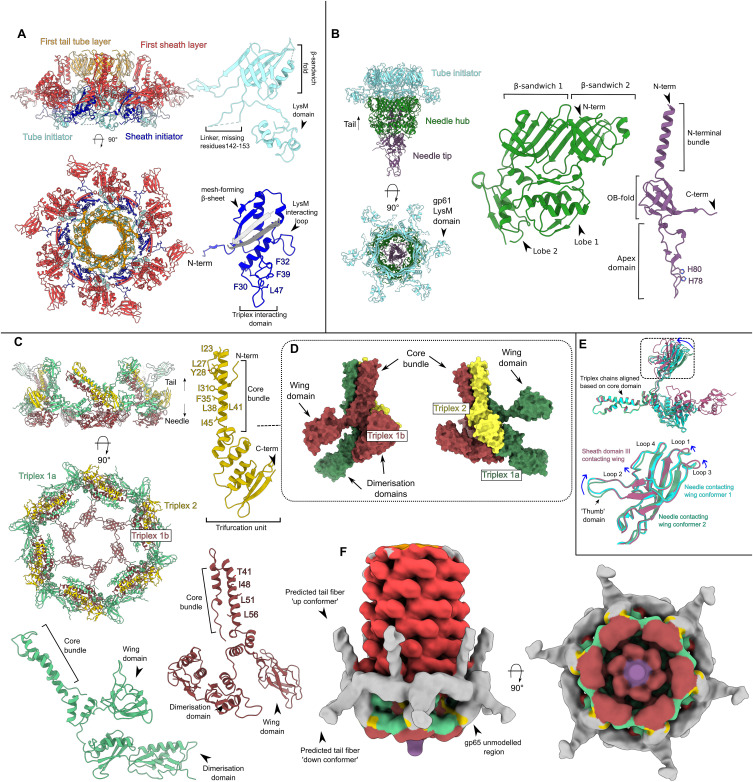
Figure S7. Baseplate interactions. (A) Cartoon representation of baseplate hub proteins assembled (left) including the first layer of tail tube protein (orange) and sheath protein (red), and in monomeric representation with domain features highlighted (right). (B) Cartoon representation of needle proteins assembled (left), with the tail tube initiator proteins also present (cyan) for reference, and in monomeric representations (right) with domain features highlighted. (C) Cartoon representation of baseplate wedge proteins assembled (left) and in monomeric representations with domain features highlighted. (D) Surface rendering of triplex complex showing the three main features. (E) Conformational variability in the wing domain within three conformers of the triplex 1 protein. (F) Baseplate cryoEM reconstruction low-pass–filtered to 20 Å, and thresholded at σ = 0.022, showing density for putative gp65 tail fibers in an upward and downward conformation.
Figure S7. Baseplate interactions. (A) Cartoon representation of baseplate hub proteins assembled (left) including the first layer of tail tube protein (orange) and sheath protein (red), and in monomeric representation with domain features highlighted (right). (B) Cartoon representation of needle proteins assembled (left), with the tail tube initiator proteins also present (cyan) for reference, and in monomeric representations (right) with domain features highlighted. (C) Cartoon representation of baseplate wedge proteins assembled (left) and in monomeric representations with domain features highlighted. (D) Surface rendering of triplex complex showing the three main features. (E) Conformational variability in the wing domain within three conformers of the triplex 1 protein. (F) Baseplate cryoEM reconstruction low-pass–filtered to 20 Å, and thresholded at σ = 0.022, showing density for putative gp65 tail fibers in an upward and downward conformation.CC BY · PubMed Central
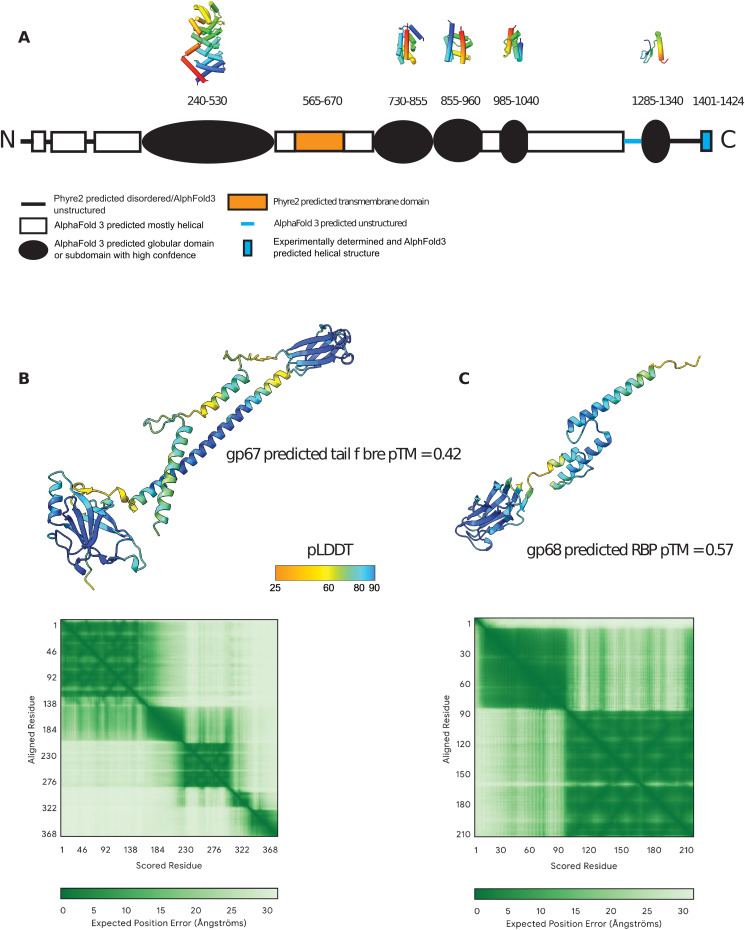
Figure S8. Structure prediction for proteins absent from the CryoEM model. (A) Domain structure of the tape measure protein, gp59, predicted by Phyre2 and/or AlphaFold3 (Kelley et al, 2015; Abramson et al, 2024). The approximate amino acid range for each domain is indicated, along with polypeptide backbone structures from AlphaFold3 predictions of putative globular domains where the pLDDT score is ∼80 or above; color coding is from N-terminal end (blue) to C-terminal end (red). (B) AlphaFold3 prediction of the structure of the putative tail fiber protein, gp67, in its monomeric form (it is likely to be multimeric in the assembled phage). Confidence is highest for pLDDT scores of 80 or above. (B, C) As (B) for the predicted receptor binding protein, gp68, which is also likely to be multimeric and attached to the gp67 multimer.
Figure S8. Structure prediction for proteins absent from the CryoEM model. (A) Domain structure of the tape measure protein, gp59, predicted by Phyre2 and/or AlphaFold3 (Kelley et al, 2015; Abramson et al, 2024). The approximate amino acid range for each domain is indicated, along with polypeptide backbone structures from AlphaFold3 predictions of putative globular domains where the pLDDT score is ∼80 or above; color coding is from N-terminal end (blue) to C-terminal end (red). (B) AlphaFold3 prediction of the structure of the putative tail fiber protein, gp67, in its monomeric form (it is likely to be multimeric in the assembled phage). Confidence is highest for pLDDT scores of 80 or above. (B, C) As (B) for the predicted receptor binding protein, gp68, which is also likely to be multimeric and attached to the gp67 multimer.CC BY · PubMed Central
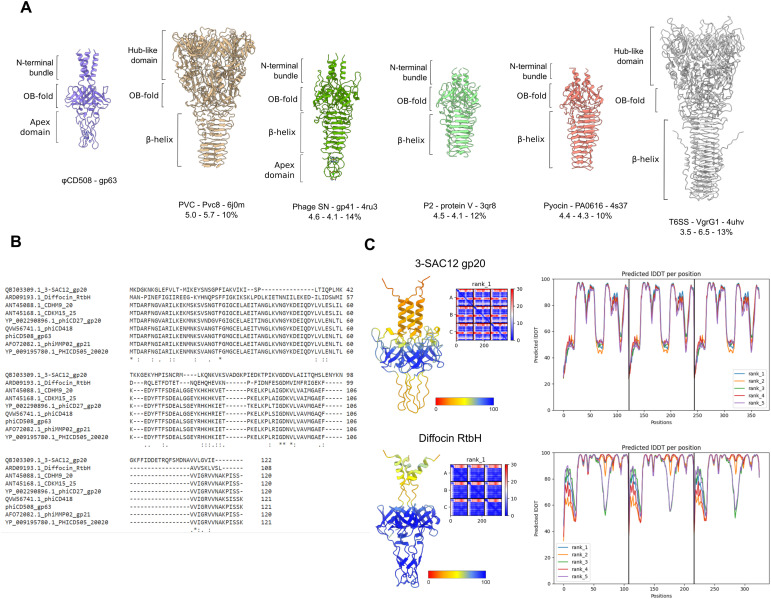
Figure S9. Needle structural homologs and family features. (A) Structural features of the φCD508 needle tip protein gp63 compared with structures determined for homologous needle tip proteins from phage and T6SS, as well as z-score, RMSD, and sequence identity. (B) Sequence alignment between the φCD508 needle tip protein gp63 and phage needle proteins from other bacteriophages infecting S-layer–producing bacterial species. (C) AlphaFold predicted structures of needle tips from L. brevis infecting bacteriophage 3-SAC12, and C. difficile infecting phage-like particle diffocin. Each needle lacks the β-helix, an omission common to bacteriophages infecting S-layer–producing species. Predicted structures are colored based on the pLDDT score, and pLDDT is plotted to show the confidence in the predicted structure (right).
Figure S9. Needle structural homologs and family features. (A) Structural features of the φCD508 needle tip protein gp63 compared with structures determined for homologous needle tip proteins from phage and T6SS, as well as z-score, RMSD, and sequence identity. (B) Sequence alignment between the φCD508 needle tip protein gp63 and phage needle proteins from other bacteriophages infecting S-layer–producing bacterial species. (C) AlphaFold predicted structures of needle tips from L. brevis infecting bacteriophage 3-SAC12, and C. difficile infecting phage-like particle diffocin. Each needle lacks the β-helix, an omission common to bacteriophages infecting S-layer–producing species. Predicted structures are colored based on the pLDDT score, and pLDDT is plotted to show the confidence in the predicted structure (right).CC BY · PubMed Central
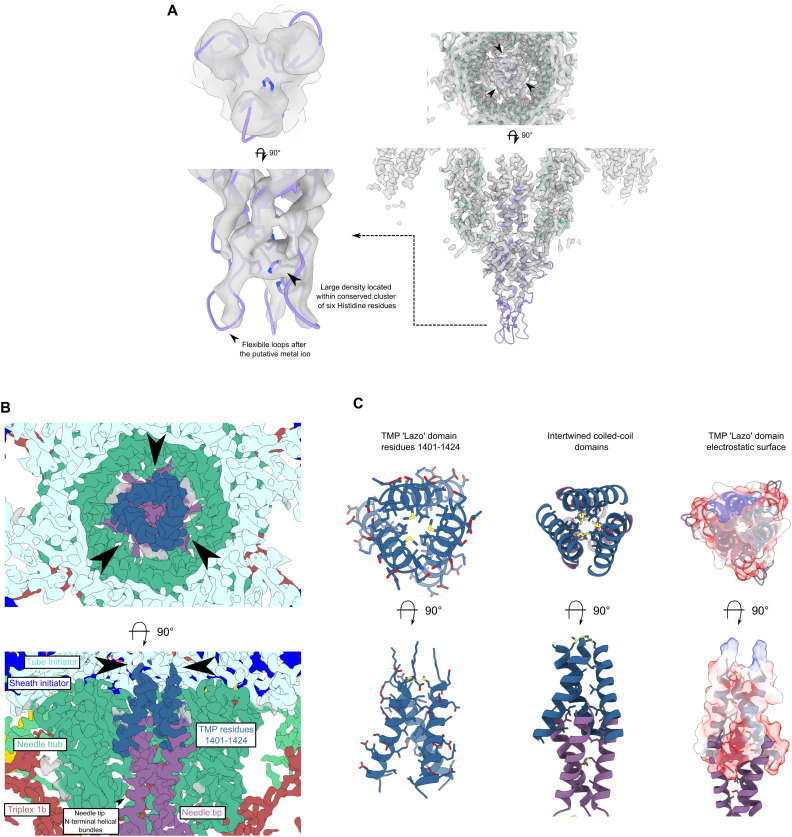
Figure S10. Needle and tape measure protein interactions. (A) CryoEM density map of needle tip apex domain with needle tip trimer (purple) and needle hub (green). Histidine residues surround a strong density feature interpreted as a metal ion. (B) Slices through cryoEM needle C3 reconstruction colored based on the protein. Clear helical density with sidechain density is visible for the TMP lazo domain (dark blue). (C) Cartoon representation of tape measure protein trimer with sidechains shown (left). Interaction between the tape measure protein and the N-terminal bundle domain of the needle tip. The coiled-coils are formed of three interleaved leucine zipper splayed bundles (middle). The electrostatic potential of the tape measure protein lazo domain with strong negative charge present proximal to the needle tip protein is shown.
Figure S10. Needle and tape measure protein interactions. (A) CryoEM density map of needle tip apex domain with needle tip trimer (purple) and needle hub (green). Histidine residues surround a strong density feature interpreted as a metal ion. (B) Slices through cryoEM needle C3 reconstruction colored based on the protein. Clear helical density with sidechain density is visible for the TMP lazo domain (dark blue). (C) Cartoon representation of tape measure protein trimer with sidechains shown (left). Interaction between the tape measure protein and the N-terminal bundle domain of the needle tip. The coiled-coils are formed of three interleaved leucine zipper splayed bundles (middle). The electrostatic potential of the tape measure protein lazo domain with strong negative charge present proximal to the needle tip protein is shown.CC BY · PubMed Central

Verification

Claims the paper makes

The claims and statistics of this paper haven’t been checked yet.

Run the check — free, no account needed. It reads the open-access text and checks the sources it cites.

A few free checks a day · papers already verified open instantly · results are public

Self-check

Percentages, sums and reported differences re-computed from the paper’s own numbers.

The self-check needs the paper’s full text.

Citations

Cites

Research works printed but not linked: 84

  1. 10.1007/s00705-006-0849-1 · DOI
  2. 10.1016/S1357-2725(02)00098-5 · DOI
  3. 10.1038/s41467-017-02049-3 · DOI
  4. 10.1126/science.abj8754 · DOI · Paper page
  5. 10.1089/cmb.2012.0021 · DOI
  6. 10.1038/s41467-020-16669-9 · DOI
  7. 10.1128/JVI.02033-13 · DOI
  8. 10.1101/2024.09.19.613683 · DOI
  9. 10.1016/j.tcb.2017.05.003 · DOI
  10. 10.1016/j.str.2011.12.009 · DOI
  11. 10.1038/s41467-024-51038-w · DOI · Paper page
  12. 10.1101/SQB.1962.027.001.005 · DOI
  13. 10.1073/pnas.1708483114 · DOI
  14. 10.1093/bioinformatics/bty560 · DOI · Paper page
  15. 10.1089/phage.2021.0007 · DOI
  16. 10.1107/S2059798318002425 · DOI
  17. 10.1038/s41564-019-0530-6 · DOI
  18. 10.1016/0022-2836(72)90341-5 · DOI
  19. 10.3390/v10080397 · DOI
  20. 10.1107/S0907444904019158 · DOI · Paper page
  21. 10.1038/nrmicro3213 · DOI
  22. 10.3390/v11050393 · DOI
  23. 10.4161/bact.28281 · DOI
  24. 10.1073/pnas.0400444101 · DOI
  25. 10.1016/j.jmb.2013.02.012 · DOI
  26. 10.1126/sciadv.abf9601 · DOI
  27. 10.1038/nsmb.2995 · DOI
  28. 10.1038/s41586-020-2186-z · DOI
  29. 10.1128/JB.01272-12 · DOI
  30. 10.15252/embj.201899455 · DOI
  31. 10.1136/bmj.l4609 · DOI
  32. 10.1042/BST20210799 · DOI
  33. 10.3389/fmicb.2014.00184 · DOI
  34. 10.1128/JVI.01340-15 · DOI
  35. 10.1016/j.jsb.2017.02.003 · DOI
  36. 10.1074/jbc.M113.456145 · DOI
  37. 10.1073/pnas.1501064112 · DOI
  38. 10.1038/nprot.2006.432 · DOI
  39. 10.1016/j.cell.2019.02.020 · DOI
  40. 10.1128/JVI.00023-17 · DOI
  41. 10.1038/nprot.2015.053 · DOI · Paper page
  42. 10.1126/scitranslmed.aah6813 · DOI
  43. 10.1371/journal.ppat.1008314 · DOI
  44. 10.1016/j.virol.2014.06.012 · DOI
  45. 10.1016/j.chom.2019.01.014 · DOI
  46. 10.1006/jsbi.1996.0013 · DOI
  47. 10.1016/j.cell.2015.01.037 · DOI
  48. 10.1038/s41467-022-28196-w · DOI
  49. 10.1007/s00253-017-8224-6 · DOI
  50. 10.1186/1743-422X-7-355 · DOI
  51. 10.1073/pnas.0812407106 · DOI
  52. 10.1038/s41467-023-39756-z · DOI
  53. 10.1107/S2059798319011471 · DOI · Paper page
  54. 10.1186/1471-2164-15-1027 · DOI
  55. 10.1038/s41592-022-01488-1 · DOI · Paper page
  56. 10.1016/0022-2836(73)90200-3 · DOI
  57. 10.1128/AAC.01774-15 · DOI
  58. 10.3390/antibiotics7010013 · DOI
  59. 10.1073/pnas.1605883113 · DOI
  60. 10.1002/pro.3943 · DOI
  61. 10.3389/fmicb.2022.998215 · DOI
  62. 10.1038/nmeth.4169 · DOI · Paper page
  63. 10.1038/s41564-018-0238-z · DOI
  64. 10.1016/j.jsb.2015.08.008 · DOI
  65. 10.1128/spectrum.03894-22 · DOI
  66. 10.1093/bioinformatics/btu153 · DOI
  67. 10.1128/AEM.00237-14 · DOI
  68. 10.1128/mBio.00019-20 · DOI
  69. 10.1038/s42003-023-05292-1 · DOI
  70. 10.1074/jbc.M112.444901 · DOI
  71. 10.1038/ncomms8548 · DOI
  72. 10.1016/j.jsb.2006.05.009 · DOI
  73. 10.1038/nature17971 · DOI
  74. 10.1111/mmi.13921 · DOI
  75. 10.1038/s42003-019-0437-z · DOI
  76. 10.1038/s41564-017-0020-7 · DOI
  77. 10.3390/v15081673 · DOI
  78. 10.1002/pro.3330 · DOI · Paper page
  79. 10.1128/JB.188.6.2254-2261.2006 · DOI
  80. 10.1073/pnas.1914677117 · DOI · Paper page
  81. 10.1073/pnas.2213727120 · DOI
  82. 10.1038/nmeth.4193 · DOI
  83. 10.1016/j.str.2017.06.017 · DOI
  84. 10.1038/s41467-020-19611-1 · DOI

Metadata

Authors
Wilson, J. S., Fortier, L.-C., Fagan, R. P., & Bullough, P. A.
Affiliations
  • University of Sheffield (GB)
  • Université de Sherbrooke (CA)
Corresponding author
  • Fagan, Robert P
  • Bullough, Per A
Venue
Life Science Alliance
Published
2025-03-26
Volume
8
Issue
6
Pages
e202403088
ISSN
2575-1077 (ISSN-L)
OpenAlex
W4408869599
Cited by
9
References
6
Citations by year
2026: 5 · 2025: 4
FWCI
4.75
Type
journal article
Language
en
Open access
Locations
  • Life Science Alliance (publishedVersion, cc-by)
  • bioRxiv (Cold Spring Harbor Laboratory) (acceptedVersion, cc-by-nc-nd)
  • Europe PMC (PubMed Central) (publishedVersion, cc-by)
  • PubMed Central (publishedVersion, cc-by)
  • PubMed (publishedVersion)
  • White Rose Research Online (University of Leeds, The University of Sheffield, University of York) (acceptedVersion, cc-by)
  • White Rose Research Online (University of Leeds, The University of Sheffield, University of York) (submittedVersion, cc-by)
  • DOAJ (DOAJ: Directory of Open Access Journals) (submittedVersion, cc-by-sa)
Funders
  • UKRI | Biotechnology and Biological Sciences Research Council (BB/P02002X/1)
  • UK National Electron Bio-Imaging Centre (EM19832)
  • Natural Sciences and Engineering Research Council of Canada (RGPIN-2020-05776)
Topics
  • Life Sciences › Immunology and Microbiology › Virology › Bacteriophages and microbial interactions
  • Life Sciences › Biochemistry, Genetics and Molecular Biology › Structural Biology › Advanced Electron Microscopy Techniques and Applications
  • Life Sciences › Biochemistry, Genetics and Molecular Biology › Structural Biology › Enzyme Structure and Function
Keywords
contractile tail, S-layer, Clostridium difficile, Gram-positive bacteria, phage tail structure, phage-host interactions
MeSH terms
Bacteriophages, Cell Wall, Models, Molecular, Clostridioides difficile, Bacteriophage T4, Viral Tail Proteins

About these checks

Registry, retraction, Cites and statistics results are computed, not judged, with one exception: a printed reference that no index lists is read once by a model before it counts as a citation error. Claims are extracted by a model and kept only when their quote appears verbatim in the text; each cited source is then checked, with a model’s help, for whether it says what the claim relies on. Those verdicts can be wrong — read the claim’s quote and the cited source before relying on one.

Statistics and arithmetic are recomputed, not judged.

Confidence bands are shown only for fields calibrated on our annotated test set. None is calibrated yet, so no band is shown.

What counts as a claim ›How we measure confidence ›How we check this ›

Are you an author, or do you see a problem with this page? Request a review