Cited by 47

The DOI matches its Crossref record; 5 of the 5 references it cites were found in a registry or an index.

miR-144/451 represses the LKB1/AMPK/mTOR pathway to promote red cell precursor survival during recovery from acute anemia

Fang, Xiao, Shen, Feiyang, Lechauve, Christophe, Xu, Peng, Zhao, Guowei, Itkow, Jacobi, Wu, Fan, Hou, Yaying, Wu, Xiaohui, Yu, Lingling, Xiu, Huiqing, Wang, Mengli, Zhang, Ruiling, Wang, Fangfang, Zhang, Yanqing, Wang, Daxin, Weiss, Mitchell J., Yu, Duonan·2018·Haematologica

Overview

The claims and statistics of this paper haven’t been checked yet.

Run the check — free, no account needed. It reads the open-access text and checks the sources it cites.

A few free checks a day · papers already verified open instantly · results are public

Integrity signals

Registry

Crossref · 10.3324/haematol.2017.177394

Cites

5 of 5 references verified0 citation errors · 0 not checkable

Statistics

Figures

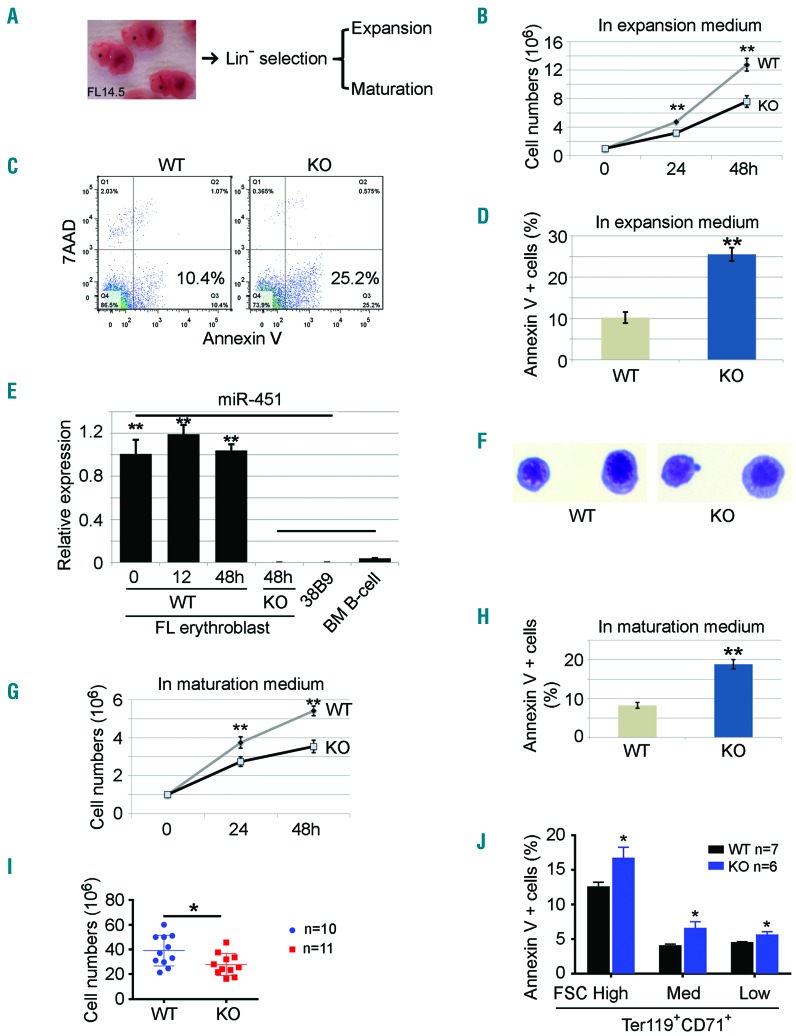
Figure 1. Increased apoptosis of miR-144/451−/− erythroblasts during erythropoietic stress. (A) miR-144/451−/− progenitor cells were isolated from E14.5 fetal liver (FL) erythroblasts and grown in culture in expansion medium or maturation medium. (B) Cell proliferation rates of FL erythroid blasts in expansion medium for 24 and 48 hours (h). n=3 FLs. **P<0.01 (t-test). Experiments were repeated 3 times. (C) Flow cytometry-based analysis of apoptosis using Annexin V. (D) Quantitative analysis of the flow cytometry data from (C). Data from 3 independent experiments. **P<0.01 (t-test). (E) Quantitative PCR analysis of miR-451 expression in FL progenitors grown in expansion medium for different lengths of time. Progenitor cells from miR-144/451−/− FLs, mouse B-lymphoma cell line 38B9, and normal B lymphocytes sorted from mouse bone marrow were used as negative controls. Note: the high miR-451 expression in the 0-h culture suggests the erythroid identity of the progenitors, whereas the lack of a significant increase in miR-451 after 48 h in culture suggests that there is no further differentiation of erythroid progenitors grown in culture. (F) FL progenitors grown in expansion medium for 48 h. Cells were cytospun onto slides and stained with May-Grunwald-Giemsa. (G) Cell proliferation rates of FL erythroid cells in maturation medium for 24 and 48 h. N=3. **P<0.01 (t-test). (H) Percentage of apoptotic cells in maturation medium based on flow cytometric analysis. Data represent 3 independent experiments. **P<0.01 (t-test). (I) Cell numbers in whole E14.5 FLs without in vitro expansion. WT n=10, KO n=11. *P<0.05 (t-test). (J) Percentage of apoptotic cells in different regions gated by CD71/Ter119 staining and FSC intensity. WT n=7, KO n=6. *P<0.05 (t-test).
Figure 1. Increased apoptosis of miR-144/451−/− erythroblasts during erythropoietic stress. (A) miR-144/451−/− progenitor cells were isolated from E14.5 fetal liver (FL) erythroblasts and grown in culture in expansion medium or maturation medium. (B) Cell proliferation rates of FL erythroid blasts in expansion medium for 24 and 48 hours (h). n=3 FLs. **P<0.01 (t-test). Experiments were repeated 3 times. (C) Flow cytometry-based analysis of apoptosis using Annexin V. (D) Quantitative analysis of the flow cytometry data from (C). Data from 3 independent experiments. **P<0.01 (t-test). (E) Quantitative PCR analysis of miR-451 expression in FL progenitors grown in expansion medium for different lengths of time. Progenitor cells from miR-144/451−/− FLs, mouse B-lymphoma cell line 38B9, and normal B lymphocytes sorted from mouse bone marrow were used as negative controls. Note: the high miR-451 expression in the 0-h culture suggests the erythroid identity of the progenitors, whereas the lack of a significant increase in miR-451 after 48 h in culture suggests that there is no further differentiation of erythroid progenitors grown in culture. (F) FL progenitors grown in expansion medium for 48 h. Cells were cytospun onto slides and stained with May-Grunwald-Giemsa. (G) Cell proliferation rates of FL erythroid cells in maturation medium for 24 and 48 h. N=3. **P<0.01 (t-test). (H) Percentage of apoptotic cells in maturation medium based on flow cytometric analysis. Data represent 3 independent experiments. **P<0.01 (t-test). (I) Cell numbers in whole E14.5 FLs without in vitro expansion. WT n=10, KO n=11. *P<0.05 (t-test). (J) Percentage of apoptotic cells in different regions gated by CD71/Ter119 staining and FSC intensity. WT n=7, KO n=6. *P<0.05 (t-test).CC BY-NC · PubMed Central
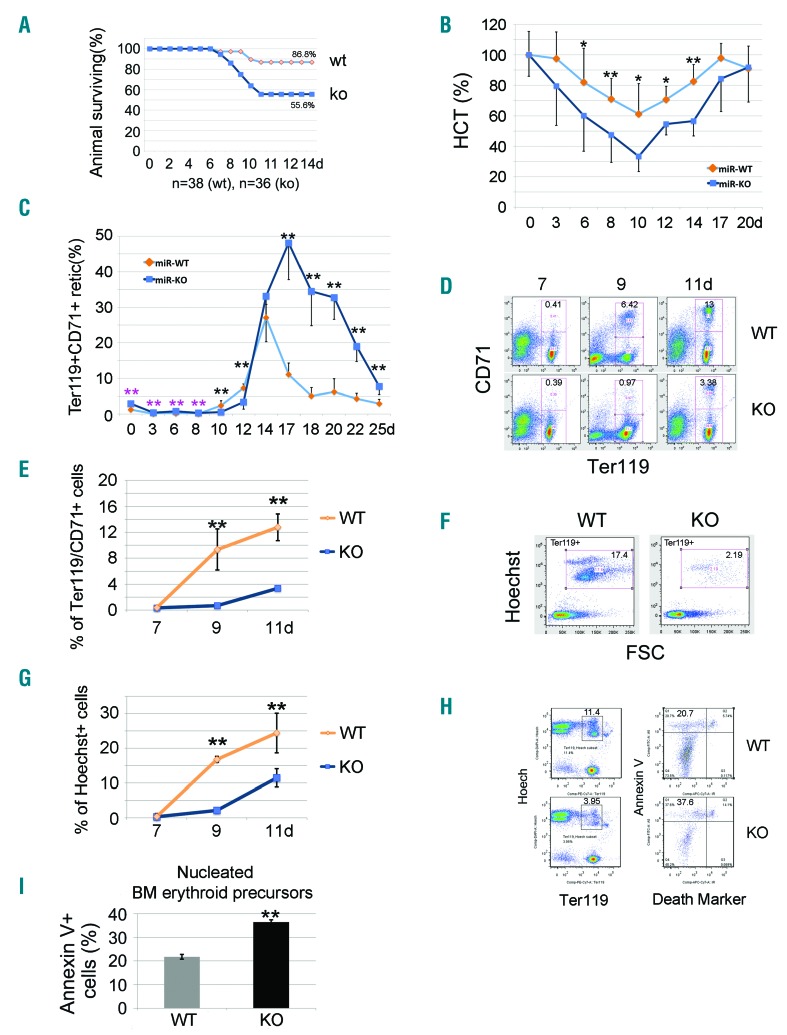
Figure 2. Apoptotic erythroblasts in miR-144/451−/− bone marrow increase after administration of 5-fluorouracil (5-FU) in adult mice. (A) Survival rates after 5-FU treatment for n=38 (wild-type, WT) and n=36 (miR-144/451−/−, KO) mice. (B) Increased hemolysis of miR-144/451−/− erythrocytes after exposure to 5-FU, as determined by serial hematocrit measurement. N=12 miR-144/451−/− and n=12 WT mice were used. *P<0.05; **P<0.01 (t-test). (C) Flow cytometric analysis of Ter119+CD71+ reticulocytes in circulating blood after 5-FU treatment. N=5 mice of each genotype were used. **P<0.01 (t-test). Note: for the first eight days there were relatively more reticulocytes in miR-144/451−/− blood as compared to WT blood, but significantly fewer during days 8 to 12. The number of reticulocytes in miR-144/451−/− blood dramatically increased around day 14, and much higher levels were sustained than in WT animals. (D) Flow cytometric analysis of Ter119+CD71+ erythroid cells in bone marrow after 5-FU administration for 7–11 days. Note: the appearance of Ter119+CD71+ erythroid cells in bone marrow was delayed relative to that in WT mice, indicating a maturation arrest and/or sustained apoptosis of erythroid cells in miR-144/451−/− mice. (E) Quantitated analysis of Ter119+CD71+ erythroid cells in bone marrow after 5-FU administration for 7–11 days. There were n=5 mice of each genotype at each time point. **P<0.01 (t-test). (F) Flow cytometric analysis of nucleated cell numbers in bone marrow after 5-FU administration. All cells shown in the windows were Ter119+. Gated regions represent nucleated erythroblasts (Hoechst+FSChigh). (G) Quantitative analysis of flow cytometry data from (F). There were n=5 mice of each genotype at each time point. **P<0.01 (t-test). Note: there were far fewer nucleated erythroid cells in miR-144/451−/− bone marrow during days 9 to 11, indicating a maturation arrest and/or sustained apoptosis. (H) Flow cytometric analysis of early apoptosis using Annexin V. Ter119+/Hoechst+ cells are nucleated erythroid cells (left). Near-IR cell death marker−/Annexin V+ cells are early apoptotic cells (right). (I) Quantitative analysis of flow cytometry data from (H). We used n=5 mice of each genotype at day 11 after 5-FU treatment. **P<0.01 (t-test).
Figure 2. Apoptotic erythroblasts in miR-144/451−/− bone marrow increase after administration of 5-fluorouracil (5-FU) in adult mice. (A) Survival rates after 5-FU treatment for n=38 (wild-type, WT) and n=36 (miR-144/451−/−, KO) mice. (B) Increased hemolysis of miR-144/451−/− erythrocytes after exposure to 5-FU, as determined by serial hematocrit measurement. N=12 miR-144/451−/− and n=12 WT mice were used. *P<0.05; **P<0.01 (t-test). (C) Flow cytometric analysis of Ter119+CD71+ reticulocytes in circulating blood after 5-FU treatment. N=5 mice of each genotype were used. **P<0.01 (t-test). Note: for the first eight days there were relatively more reticulocytes in miR-144/451−/− blood as compared to WT blood, but significantly fewer during days 8 to 12. The number of reticulocytes in miR-144/451−/− blood dramatically increased around day 14, and much higher levels were sustained than in WT animals. (D) Flow cytometric analysis of Ter119+CD71+ erythroid cells in bone marrow after 5-FU administration for 7–11 days. Note: the appearance of Ter119+CD71+ erythroid cells in bone marrow was delayed relative to that in WT mice, indicating a maturation arrest and/or sustained apoptosis of erythroid cells in miR-144/451−/− mice. (E) Quantitated analysis of Ter119+CD71+ erythroid cells in bone marrow after 5-FU administration for 7–11 days. There were n=5 mice of each genotype at each time point. **P<0.01 (t-test). (F) Flow cytometric analysis of nucleated cell numbers in bone marrow after 5-FU administration. All cells shown in the windows were Ter119+. Gated regions represent nucleated erythroblasts (Hoechst+FSChigh). (G) Quantitative analysis of flow cytometry data from (F). There were n=5 mice of each genotype at each time point. **P<0.01 (t-test). Note: there were far fewer nucleated erythroid cells in miR-144/451−/− bone marrow during days 9 to 11, indicating a maturation arrest and/or sustained apoptosis. (H) Flow cytometric analysis of early apoptosis using Annexin V. Ter119+/Hoechst+ cells are nucleated erythroid cells (left). Near-IR cell death marker−/Annexin V+ cells are early apoptotic cells (right). (I) Quantitative analysis of flow cytometry data from (H). We used n=5 mice of each genotype at day 11 after 5-FU treatment. **P<0.01 (t-test).CC BY-NC · PubMed Central
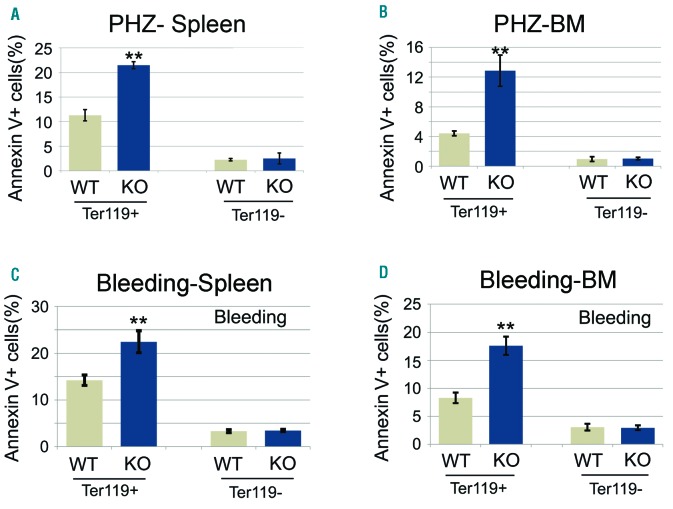
Figure 3. Apoptosis of miR-144/451−/− bone marrow and spleen erythroblasts is increased under other stress conditions. (A and B) Results of flow cytometric analysis of nucleated erythroid cell apoptosis in spleen (A) and bone marrow (B) after phenylhydrazine (PHZ) administration. miR-144/451−/− mice (n=5) and wild-type (WT) littermates (n=5) were treated with PHZ (120 mg/kg) on days 0 and 1. Splenocytes and bone marrow cells were harvested four days after PHZ injection. Ter119+Hoechst+ cells are nucleated erythroid cells. Annexin V+PI− near IR− cells are early apoptotic cells. Ter119− cells are non-erythroid cells. **P<0.01 (t-test). (C and D) Flow cytometric analysis of early apoptosis rates of spleen (C) and bone marrow (D) nucleated erythroblasts after bleeding. miR-144/451−/− mice (n=5) and WT littermates (n=5) had 0.4 mL of blood drawn on two consecutive days. Splenocytes and bone marrow cells were harvested on day 3. **P<0.01 (t-test). Note: more early apoptotic erythroblasts were seen in miR-144/451−/− mice.
Figure 3. Apoptosis of miR-144/451−/− bone marrow and spleen erythroblasts is increased under other stress conditions. (A and B) Results of flow cytometric analysis of nucleated erythroid cell apoptosis in spleen (A) and bone marrow (B) after phenylhydrazine (PHZ) administration. miR-144/451−/− mice (n=5) and wild-type (WT) littermates (n=5) were treated with PHZ (120 mg/kg) on days 0 and 1. Splenocytes and bone marrow cells were harvested four days after PHZ injection. Ter119+Hoechst+ cells are nucleated erythroid cells. Annexin V+PI− near IR− cells are early apoptotic cells. Ter119− cells are non-erythroid cells. **P<0.01 (t-test). (C and D) Flow cytometric analysis of early apoptosis rates of spleen (C) and bone marrow (D) nucleated erythroblasts after bleeding. miR-144/451−/− mice (n=5) and WT littermates (n=5) had 0.4 mL of blood drawn on two consecutive days. Splenocytes and bone marrow cells were harvested on day 3. **P<0.01 (t-test). Note: more early apoptotic erythroblasts were seen in miR-144/451−/− mice.CC BY-NC · PubMed Central
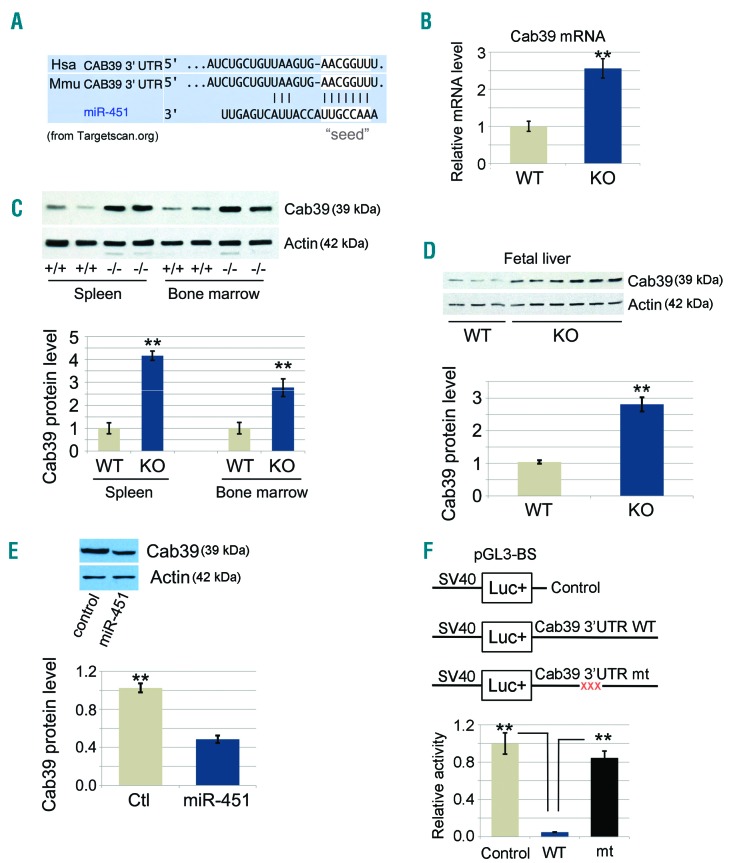
Figure 4. miR-451 targets Cab39 mRNA in erythroblasts. (A) Nucleotide sequence alignments showing partial complementarity between the mouse and human 3′-UTRs of Cab39 mRNAs and miR-451. The miR-451 seed-sequence recognition sites in the mRNAs are boxed in white. (B) Fold change in the Cab39 mRNA level from quantitative RT-PCR analysis. Ter119+ nucleated cells were sorted from bone marrow, and a microarray was performed using an Affymetrix GeneChip.15 N=3 mice were used. **P<0.01 (t-test). (C) Cab39 protein levels in both spleen and bone marrow miR-144/451−/− erythroblasts were increased relative to those in wild-type (+/+, WT) controls (top). Ter119+ cells were purified from bone marrow, and whole-cell lysates were analyzed via Western blots with the Cab39 antibody. Representative results for 2 mice of each genotype are shown. (Bottom) Quantitative image analysis from multiple experiments. (D) Cab39 protein levels in miR-144/451−/− fetal liver (FL) erythroblasts were increased relative to those in WT controls (top). (Bottom) Quantitative image analysis for 3 WT and 6 miR-144/451−/− (KO) FLs. (E) G1E proerythroblast cells were transduced with retrovirus encoding miR-451 or empty vector as control. Transduced cells were selected with puromycin and analyzed for Cab39 via Western blots. (Top) Results of a representative experiment and (Bottom) of a quantitative analysis of the Western blot signal intensity from 3 independent experiments. **P<0.01 (t-test). (F) Interaction between miR-451 and the Cab39 3′-UTR inhibits the expression of a linked reporter gene. Firefly luciferase cDNA was fused to the normal 3′-UTR of Cab39 cDNA or a mutant version (mt) containing a 3-bp mutation within the region complementary to the miR-451 seed sequence. The reporter constructs were cloned into an expression vector and transfected into 293T cells, along with an miR-451 expression construct and a constitutively active Renilla luciferase control plasmid. Luciferase activities were determined 24 hours post transfection. (Bottom) Bars represent the Firefly/Renilla luciferase activity; levels from the reporter vector lacking the Cab39 3′-UTR were assigned an arbitrary value of 1. Results are given as the average of 3 separate experiments. **P<0.01 (t-test). Hsa: human; Mmu: mouse.
Figure 4. miR-451 targets Cab39 mRNA in erythroblasts. (A) Nucleotide sequence alignments showing partial complementarity between the mouse and human 3′-UTRs of Cab39 mRNAs and miR-451. The miR-451 seed-sequence recognition sites in the mRNAs are boxed in white. (B) Fold change in the Cab39 mRNA level from quantitative RT-PCR analysis. Ter119+ nucleated cells were sorted from bone marrow, and a microarray was performed using an Affymetrix GeneChip.15 N=3 mice were used. **P<0.01 (t-test). (C) Cab39 protein levels in both spleen and bone marrow miR-144/451−/− erythroblasts were increased relative to those in wild-type (+/+, WT) controls (top). Ter119+ cells were purified from bone marrow, and whole-cell lysates were analyzed via Western blots with the Cab39 antibody. Representative results for 2 mice of each genotype are shown. (Bottom) Quantitative image analysis from multiple experiments. (D) Cab39 protein levels in miR-144/451−/− fetal liver (FL) erythroblasts were increased relative to those in WT controls (top). (Bottom) Quantitative image analysis for 3 WT and 6 miR-144/451−/− (KO) FLs. (E) G1E proerythroblast cells were transduced with retrovirus encoding miR-451 or empty vector as control. Transduced cells were selected with puromycin and analyzed for Cab39 via Western blots. (Top) Results of a representative experiment and (Bottom) of a quantitative analysis of the Western blot signal intensity from 3 independent experiments. **P<0.01 (t-test). (F) Interaction between miR-451 and the Cab39 3′-UTR inhibits the expression of a linked reporter gene. Firefly luciferase cDNA was fused to the normal 3′-UTR of Cab39 cDNA or a mutant version (mt) containing a 3-bp mutation within the region complementary to the miR-451 seed sequence. The reporter constructs were cloned into an expression vector and transfected into 293T cells, along with an miR-451 expression construct and a constitutively active Renilla luciferase control plasmid. Luciferase activities were determined 24 hours post transfection. (Bottom) Bars represent the Firefly/Renilla luciferase activity; levels from the reporter vector lacking the Cab39 3′-UTR were assigned an arbitrary value of 1. Results are given as the average of 3 separate experiments. **P<0.01 (t-test). Hsa: human; Mmu: mouse.CC BY-NC · PubMed Central
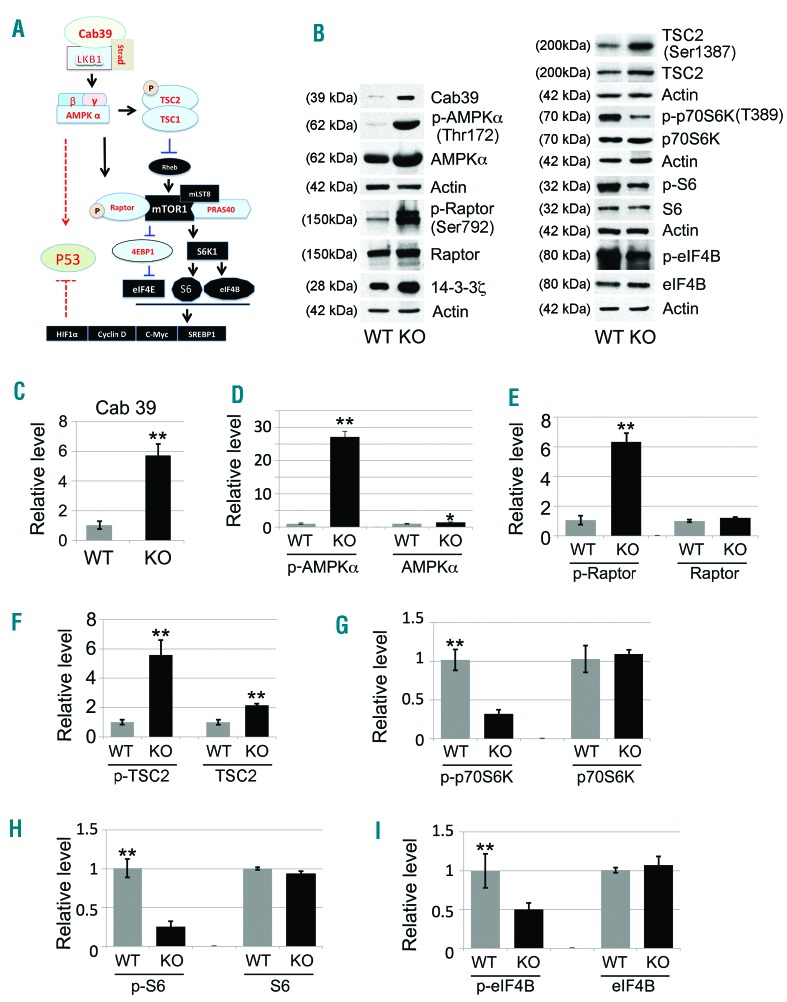
Figure 5. Activation of the Cab39/AMPK/mTOR pathway in miR-144/451−/− erythroblasts. (A) Schematic illustration of the major signaling components in the Cab39/AMPK/mTOR molecular pathway. Cab39 expression leads to increased LKB1 activity in the Cab39/LKB1/STRAD protein complex, which activates its substrate AMPK. AMPK activation is vital for modulation of the mTOR signaling cascade and for potential stabilization of p53 activity, which subsequently governs the fate of the target cells, including their apoptosis, survival, and/or proliferation. (B) Western blot analysis of the expression of Cab39, p-AMPKα, p-Raptor, p-TSC2, p-p70S6K, p-S6, and p-eIF4B, along with their non-phosphorylated counterparts, in fetal liver (FL) erythroblasts grown in maturation medium for 24 hours, when all the cells were nucleated erythroblasts. 14-3-3ζ was used as a positive control, and actin was used as a sample loading control. Quantitative analyses of the protein intensity are shown in (C-I) as follows: (C) Cab39, (D) p-AMPKα/AMPKα, (E) p-Raptor/Raptor, (F) p-TSC2/TSC2, (G) p-p70S6K/p70S6K, (H) p-S6/S6, and (I) p-eIF4B/eIF4B. Signals were normalized to actin. Data are the mean values from 3 separate experiments. *P<0.05; **P<0.01 (t-test).
Figure 5. Activation of the Cab39/AMPK/mTOR pathway in miR-144/451−/− erythroblasts. (A) Schematic illustration of the major signaling components in the Cab39/AMPK/mTOR molecular pathway. Cab39 expression leads to increased LKB1 activity in the Cab39/LKB1/STRAD protein complex, which activates its substrate AMPK. AMPK activation is vital for modulation of the mTOR signaling cascade and for potential stabilization of p53 activity, which subsequently governs the fate of the target cells, including their apoptosis, survival, and/or proliferation. (B) Western blot analysis of the expression of Cab39, p-AMPKα, p-Raptor, p-TSC2, p-p70S6K, p-S6, and p-eIF4B, along with their non-phosphorylated counterparts, in fetal liver (FL) erythroblasts grown in maturation medium for 24 hours, when all the cells were nucleated erythroblasts. 14-3-3ζ was used as a positive control, and actin was used as a sample loading control. Quantitative analyses of the protein intensity are shown in (C-I) as follows: (C) Cab39, (D) p-AMPKα/AMPKα, (E) p-Raptor/Raptor, (F) p-TSC2/TSC2, (G) p-p70S6K/p70S6K, (H) p-S6/S6, and (I) p-eIF4B/eIF4B. Signals were normalized to actin. Data are the mean values from 3 separate experiments. *P<0.05; **P<0.01 (t-test).CC BY-NC · PubMed Central
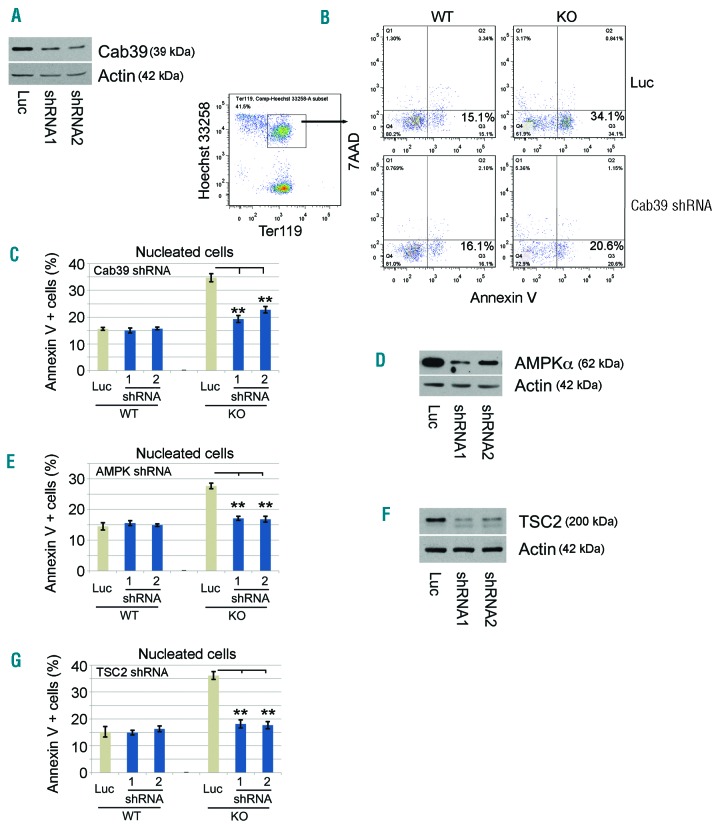
Figure 6. Attenuation of Cab39/AMPK/mTOR signaling rescues erythroid apoptosis after miR-144/451 depletion. (A) shRNA suppression of Cab39 in miR-144/451−/− erythroblasts as shown by Western blot. (B) Apoptosis was measured by flow cytometry, using Annexin V as an indicator. Cab39 shRNA-expressing nucleated erythroblasts were indicated as Ter119+Hoechst+ cells. (C) The apoptotic index in nucleated erythroid cells after knockdown of Cab39. Luciferase (luc) shRNA was used as a negative knockdown control. **P<0.01 (t-test). N=5 fetal liver (FL) erythroblasts of each genotype were used. (D) shRNA suppression of AMPKα in miR-144/451−/− erythroblasts, as shown by Western blot. (E) The percentage of apoptotic nucleated erythroblasts after knockdown of AMPKα. **P<0.01 (t-test). N=4 FLs of each genotype were used. (F) shRNA suppression of TSC2 in miR-144/451−/− erythroblasts, as shown by Western blot. (G) The apoptotic rates of nucleated erythroblasts after knockdown of TSC2. **P<0.01 (t-test). N=4 FLs of each genotype were used.
Figure 6. Attenuation of Cab39/AMPK/mTOR signaling rescues erythroid apoptosis after miR-144/451 depletion. (A) shRNA suppression of Cab39 in miR-144/451−/− erythroblasts as shown by Western blot. (B) Apoptosis was measured by flow cytometry, using Annexin V as an indicator. Cab39 shRNA-expressing nucleated erythroblasts were indicated as Ter119+Hoechst+ cells. (C) The apoptotic index in nucleated erythroid cells after knockdown of Cab39. Luciferase (luc) shRNA was used as a negative knockdown control. **P<0.01 (t-test). N=5 fetal liver (FL) erythroblasts of each genotype were used. (D) shRNA suppression of AMPKα in miR-144/451−/− erythroblasts, as shown by Western blot. (E) The percentage of apoptotic nucleated erythroblasts after knockdown of AMPKα. **P<0.01 (t-test). N=4 FLs of each genotype were used. (F) shRNA suppression of TSC2 in miR-144/451−/− erythroblasts, as shown by Western blot. (G) The apoptotic rates of nucleated erythroblasts after knockdown of TSC2. **P<0.01 (t-test). N=4 FLs of each genotype were used.CC BY-NC · PubMed Central
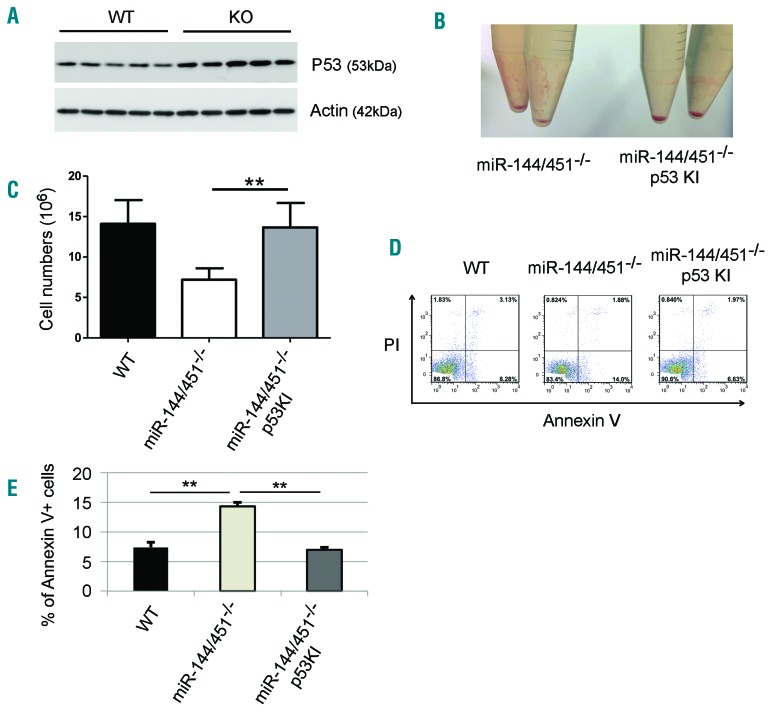
Figure 7. The increased apoptosis of miR-144/451−/− erythroblasts is p53-dependent. (A) Western blot showing the protein levels of the tumor suppressor p53 in wild-type (WT) and miR-144/451−/− (KO) E14.5 fetal liver (FL) cells. Lineage negative-selected WT and KO E14.5 FL cells were grown in culture in erythroid maturation medium, and cells were harvested for Western blot analysis for p53 after 24 hours in culture. Actin was used as the loading control. (B) Gross view of the cell pellets from miR-144/451−/− and miR-144/451−/−/p53 knock-in (KI) double-mutant E14.5 FLs. (C) Total erythroblast number for whole E14.5 FLs from miR-144/451−/− and miR-144/451−/−/p53 KI double-mutant mice. miR-144/451−/− mice were crossed with p53-deficient KI mice.16,31 N=3 WT mice, n=6 KO mice, and n=6 double-mutant mice were used. **P<0.01 (t-test). (D) Flow cytometric analysis of apoptosis for miR-144/451−/− and miR-144/451−/−/p53 KI double-mutant E14.5 FL cells. WT FLs were used as controls. PI−Annexin V+ labeling was taken to indicate early apoptotic cells. (E) Quantitative analysis of flow cytometric data from (D).
Figure 7. The increased apoptosis of miR-144/451−/− erythroblasts is p53-dependent. (A) Western blot showing the protein levels of the tumor suppressor p53 in wild-type (WT) and miR-144/451−/− (KO) E14.5 fetal liver (FL) cells. Lineage negative-selected WT and KO E14.5 FL cells were grown in culture in erythroid maturation medium, and cells were harvested for Western blot analysis for p53 after 24 hours in culture. Actin was used as the loading control. (B) Gross view of the cell pellets from miR-144/451−/− and miR-144/451−/−/p53 knock-in (KI) double-mutant E14.5 FLs. (C) Total erythroblast number for whole E14.5 FLs from miR-144/451−/− and miR-144/451−/−/p53 KI double-mutant mice. miR-144/451−/− mice were crossed with p53-deficient KI mice.16,31 N=3 WT mice, n=6 KO mice, and n=6 double-mutant mice were used. **P<0.01 (t-test). (D) Flow cytometric analysis of apoptosis for miR-144/451−/− and miR-144/451−/−/p53 KI double-mutant E14.5 FL cells. WT FLs were used as controls. PI−Annexin V+ labeling was taken to indicate early apoptotic cells. (E) Quantitative analysis of flow cytometric data from (D).CC BY-NC · PubMed Central

Verification

Claims the paper makes

The claims and statistics of this paper haven’t been checked yet.

Run the check — free, no account needed. It reads the open-access text and checks the sources it cites.

A few free checks a day · papers already verified open instantly · results are public

Claims other papers make about this one

Each is checked against this paper’s own text: does it say what the citing paper says it does?

Self-check

Percentages, sums and reported differences re-computed from the paper’s own numbers.

The self-check needs the paper’s full text.

Citations

Cites

Show all 5 references

Research works printed but not linked: 45

  1. [1]Hosokawa K Muranski P Feng X Identification of novel microRNA signatures linked to acquired aplastic anemia. Haematologica. 2015; 100(12): 1534– 1545. 26354756 PMC4666329
  2. [2]Mendell JT Olson EN MicroRNAs in stress signaling and human disease. Cell. 2012; 148(6): 1172– 1187. 22424228 PMC3308137
  3. [3]Hattangadi SM Wong P Zhang L Flygare J Lodish HF From stem cell to red cell: regulation of erythropoiesis at multiple levels by multiple proteins, RNAs, and chromatin modifications. Blood. 2011; 118(24): 6258– 6268. 21998215 PMC3236116
  4. [4]Huang X Gschweng E Van Handel B Cheng D Mikkola HK Witte ON Regulated expression of microRNAs-126/126* inhibits erythropoiesis from human embryonic stem cells. Blood. 2011; 117(7): 2157– 2165. 21163928 PMC3062325
  5. [5]Wang F Zhu Y Guo L A regulatory circuit comprising GATA1/2 switch and microRNA-27a/24 promotes erythropoiesis. Nucleic Acids Res. 2014; 42(1): 442– 457. 24049083 PMC3874166
  6. [6]Zhai PF Wang F Su R The regulatory roles of microRNA-146b-5p and its target platelet-derived growth factor receptor α (PDGFRA) in erythropoiesis and megakaryocytopoiesis. J Biol Chem. 2014; 289(33): 22600– 22613. 24982425 PMC4132768
  7. [7]Fu YF Du TT Dong M Mir-144 selectively regulates embryonic α-hemoglobin synthesis during primitive erythropoiesis. Blood. 2008; 113(6): 1340– 1349. 18941117
  8. [8]Pase L Layton JE Kloosterman WP Carradice D Waterhouse PM Lieschke GJ miR-451 regulates zebrafish erythroid maturation in vivo via its target gata2. Blood. 2009; 113(8): 1794– 1804. 18849488 PMC2647672
  9. [9]Zhan M Miller CP Papayannopoulou T Stamatoyannopoulos G Song CZ MicroRNA expression dynamics during murine and human erythroid differentiation. Exp Hematol. 2007; 35(7): 1015– 1025. 17588470 PMC1955220
  10. [10]Dore LC Amigo JD Dos Santos CO A GATA-1-regulated microRNA locus essential for erythropoiesis. Proc Natl Acad Sci USA. 2008; 105(9): 3333– 3338. 18303114 PMC2265118
  11. [11]Zhang L Flygare J Wong P Lim B Lodish HF miR-191 regulates mouse erythroblast enucleation by down-regulating Riok3 and Mxi1. Genes Dev. 2011; 25(2): 119– 124. 21196494 PMC3022257
  12. [12]Yang JS Maurin T Robine N Conserved vertebrate mir-451 provides a platform for Dicer-independent, Ago2-mediated microRNA biogenesis. Proc Natl Acad Sci USA. 2010; 107(34): 15163– 15168. 20699384 PMC2930549
  13. [13]Patrick DM Zhang CC Tao Y Defective erythroid differentiation in miR-451 mutant mice mediated by 14-3-3zeta. Genes Dev. 2010; 24(15): 1614– 1619. 20679397 PMC2912559
  14. [14]Rasmussen KD Simmini S Abreu-Goodger C The miR-144/451 locus is required for erythroid homeostasis. J Exp Med. 2010; 207(7): 1351– 1358. 20513743 PMC2901075
  15. [15]Yu D dos Santos CO Zhao G miR-451 protects against erythroid oxidant stress by repressing 14-3-3ζ. Genes Dev. 2010; 24(15): 1620– 1633. 20679398 PMC2912560
  16. [16]Yu D Carroll M Thomas-Tikhonenko A p53 status dictates responses of B lymphomas to monotherapy with proteasome inhibitors. Blood. 2007; 109(11): 4936– 4943. 17284530 PMC1885530
  17. [17]Gregory T Yu C Ma A Orkin SH Blobel GA Weiss MJ GATA-1 and erythropoietin cooperate to promote erythroid cell survival by regulating bcl-xL expression. Blood. 1999; 94(1): 87– 96. 10381501
  18. [18]Khandros E Thom CS D’Souza J Weiss MJ Integrated protein quality-control pathways regulate free α-globin in murine β-thalassemia. Blood. 2012; 119(22): 5265– 5275. 22427201 PMC3369615
  19. [19]Cheng Y Wu W Kumar SA Erythroid GATA1 function revealed by genome-wide analysis of transcription factor occupancy, histone modifications, and mRNA expression. Genome Res. 2009; 19(12): 2172– 2184. 19887574 PMC2792182
  20. [20]Palis J Segel GB Developmental biology of erythropoiesis. Blood Rev. 1998; 12(2): 106– 114. 9661799
  21. [21]Godlewski J Nowicki MO Bronisz A MicroRNA-451 regulates LKB1/AMPK signaling and allows adaptation to metabolic stress in glioma cells. Mol Cell. 2010; 37(5): 620– 632. 20227367 PMC3125113
  22. [23]Hawley SA Boudeau J Reid JL Complexes between the LKB1 tumor suppressor, STRAD α/β and MO25 α/β are upstream kinases in the AMP-activated protein kinase cascade. J Biol. 2003; 2(4): 28. 14511394 PMC333410
  23. [24]An X Schulz VP Li J Global transcriptome analyses of human and murine terminal erythroid differentiation. Blood. 2014; 123(22): 3466– 3477. 24637361 PMC4041167
  24. [25]Dasgupta B Chhipa RR Evolving lessons on the complex role of AMPK in normal physiology and cancer. Trends Pharmacol Sci. 2016; 37(3): 192– 206. 26711141 PMC4764394
  25. [26]Ginion A Auquier J Benton CR Inhibition of the mTOR/p70S6K pathway is not involved in the insulin-sensitizing effect of AMPK on cardiac glucose uptake. Am J Physiol Heart Circ Physiol. 2011; 301(2): H469– H477. 21602475
  26. [27]Laplante M Sabatini DM mTOR signaling in growth control and disease. Cell. 2012; 149(2): 274– 293. 22500797 PMC3331679
  27. [28]Kwon S Jeon JS Ahn C Sung JS Choi I Rapamycin regulates the proliferation of Huh7, a hepatocellular carcinoma cell line, by up-regulating p53 expression. Biochem Biophys Res Commun. 2016; 479(1): 74– 79. 27616194
  28. [29]Lee JY Nakada D Yilmaz OH mTOR activation induces tumor suppressors that inhibit leukemogenesis and deplete hematopoietic stem cells after Pten deletion. Cell Stem Cell. 2010; 7(5): 593– 605. 21040901 PMC2995996
  29. [30]Wang C Gao D Guo K Novel synergistic antitumor effects of rapamycin with bortezomib on hepatocellular carcinoma cells and orthotopic tumor model. BMC Cancer. 2012; 12: 166. 22559167 PMC3469344
  30. [31]Christophorou MA Martin-Zanca D Soucek L Temporal dissection of p53 function in vitro and in vivo. Nat Genet. 2005; 37(7): 718– 726. 15924142
  31. [32]Knight ZA Schmidt SF Birsoy K Tan K Friedman JM A critical role for mTORC1 in erythropoiesis and anemia. Elife. 2014; 3: e01913. 25201874 PMC4179304
  32. [34]Jones RG Plas DR Kubek S AMP-activated protein kinase induces a p53-dependent metabolic checkpoint. Mol Cell. 2005; 18(3): 283– 293. 15866171
  33. [35]Okoshi R Ozaki T Yamamoto H Activation of AMP-activated protein kinase induces p53-dependent apoptotic cell death in response to energetic stress. J Biol Chem. 2008; 283(7): 3979– 3987. 18056705
  34. [36]Tzatsos A Tsichlis PN Energy depletion inhibits phosphatidylinositol 3-kinase/Akt signaling and induces apoptosis via AMP-activated protein kinase-dependent phosphorylation of IRS-1 at Ser-794. J Biol Chem. 2007; 282(25): 18069– 18082. 17459875
  35. [37]Chakraborty A Uechi T Kenmochi N Guarding the ‘translation apparatus’: defective ribosome biogenesis and the p53 signaling pathway. Wiley Interdiscip Rev RNA. 2011; 2(4): 507– 522. 21957040
  36. [40]Augustine JJ Knauss TC Schulak JA Bodziak KA Siegel C Hricik DE Comparative effects of sirolimus and mycophenolate mofetil on erythropoiesis in kidney transplant patients. Am J Transplant. 2004; 4(12): 2001– 2006. 15575902
  37. [41]Ekberg H Bernasconi C Nöldeke J Cyclosporine, tacrolimus and sirolimus retain their distinct toxicity profiles despite low doses in the Symphony study. Nephrol Dial Transplant. 2010; 25(6): 2004– 2010. 20106825
  38. [42]Shameem R Hamid MS Wu S Risk of anemia attributable to everolimus in patients with cancer: a meta-analysis of randomized controlled trials. Anticancer Res. 2015; 35(4): 2333– 2340. 25862897
  39. [43]Diekmann F Rovira J Diaz-Ricart M mTOR inhibition and erythropoiesis: microcytosis or anaemia? Nephrol Dial Transplant. 2012; 27(2): 537– 541. 21785038
  40. [44]Socolovsky M Molecular insights into stress erythropoiesis. Curr Opin Hematol. 2007; 14(3): 215– 224. 17414210
  41. [45]Sankaran VG Weiss MJ Anemia: progress in molecular mechanisms and therapies. Nat Med. 2015; 21(3): 221– 230. 25742458 PMC4452951
  42. [46]Zhang X Camprecios G Rimmele P FOXO3-mTOR metabolic cooperation in the regulation of erythroid cell maturation and homeostasis. Am J Hematol. 2014; 89(10): 954– 963. 24966026 PMC4201594
  43. [47]Green RJ Herget M Outcomes of systemic/strategic team consultation: I. Overview and one-month results. Fam Process. 1989; 28(1): 37– 58. 2703051
  44. [48]Kloosterman WP Wienholds E de Bruijn E Kauppinen S Plasterk RH In situ detection of miRNAs in animal embryos using LNA-modified oligonucleotide probes. Nat Methods. 2006; 3(1): 27– 29. 16369549
  45. [50]Kim M Tan YS Cheng WC Kingsbury TJ Heimfeld S Civin CI MIR144 and MIR451 regulate human erythropoiesis via RAB14. Br J Haematol. 2015; 168(4): 583– 597. 25312678 PMC4314389

Cited by

Sorted by citations

Metadata

Authors
Fang, X., Shen, F., Lechauve, C., Xu, P., Zhao, G., Itkow, J., Wu, F., Hou, Y., Wu, X., Yu, L., Xiu, H., Wang, M., Zhang, R., Wang, F., Zhang, Y., Wang, D., Weiss, M. J., & Yu, D.
Venue
Haematologica
Published
2017-12-21
Volume
103
Issue
3
Pages
406-416
ISSN
  • 0390-6078
  • 1592-8721
Cited by
47
References
5
Language
en

About these checks

Registry, retraction, Cites and statistics results are computed, not judged, with one exception: a printed reference that no index lists is read once by a model before it counts as a citation error. Claims are extracted by a model and kept only when their quote appears verbatim in the text; each cited source is then checked, with a model’s help, for whether it says what the claim relies on. Those verdicts can be wrong — read the claim’s quote and the cited source before relying on one.

Statistics and arithmetic are recomputed, not judged.

Confidence bands are shown only for fields calibrated on our annotated test set. None is calibrated yet, so no band is shown.

What counts as a claim ›How we measure confidence ›How we check this ›

Are you an author, or do you see a problem with this page? Request a review