

The DOI matches its Crossref record; 47 of the 47 references it cites were found in a registry or an index; none of the 65 sources its claims cite is checked for support yet.
A gain-of-function RAC2 mutation is associated with bone-marrow hypoplasia and an autosomal dominant form of severe combined immunodeficiency
Open accessAbstract
Severe combined immunodeficiencies (SCIDs) constitute a heterogeneous group of life-threatening genetic disorders that typically present in the first year of life. They are defined by the absence of autologous T cells and the presence of an intrinsic or extrinsic defect in the B-cell compartment. In three newborns presenting with frequent infections and profound leukopenia, we identified a private, heterozygous mutation in the RAC2 gene (p.G12R). This mutation was de novo in the index case, who had been cured by hematopoietic stem cell transplantation but had transmitted the mutation to her sick daughter. Biochemical assays showed that the mutation was associated with a gain of function. The results of in vitro differentiation assays showed that RAC2 is essential for the survival and differentiation of hematopoietic stem/progenitor cells. Therefore, screening for RAC2 gain-of-function mutations should be considered in patients with a SCID phenotype and who lack a molecular diagnosis.
Overview
CoChat Summary
Written by AI from the paper’s full text.
TL;DR
A heterozygous gain-of-function RAC2 p.G12R mutation was identified in three patients with severe combined immunodeficiency and bone-marrow hypoplasia, inherited in an autosomal dominant pattern. Biochemical and in vitro HSPC assays showed increased active GTP-bound RAC2 and impaired survival/differentiation, linking the mutation to disease.
Key findings
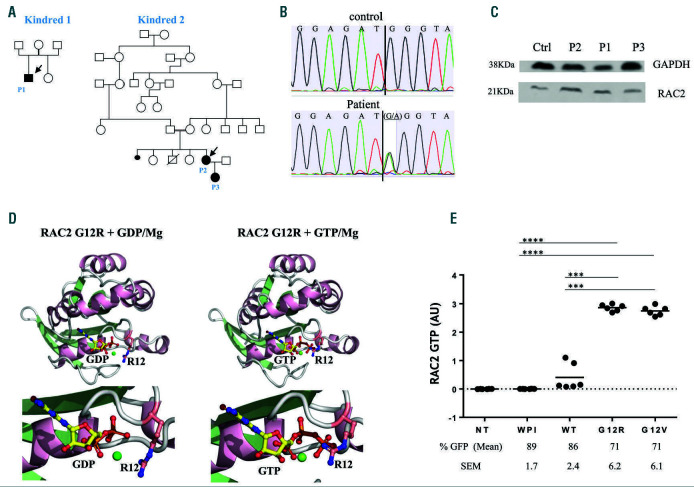
- In three patients from two unrelated kindreds (P1; mother and daughter P2/P3) with a reticular dysgenesis-like SCID phenotype but no deafness, the authors identified a heterozygous c.34G>A, p.G12R mutation in RAC2; it was de novo in the index case and transmitted to her daughter, indicating autosomal dominant inheritance. Patients lacked neutrophils, T and B lymphocytes, and circulating monocytes, with severe bone-marrow hypoplasia; TREC was <5 copies/mL in P3 versus >34 copies for a control.
- The mutation was associated with gain of function: in HEK293T cells, G-LISA showed high levels of active GTP-bound RAC2 for G12R and the positive control G12V, while RAC2 protein expression was not substantially altered in patient fibroblasts.
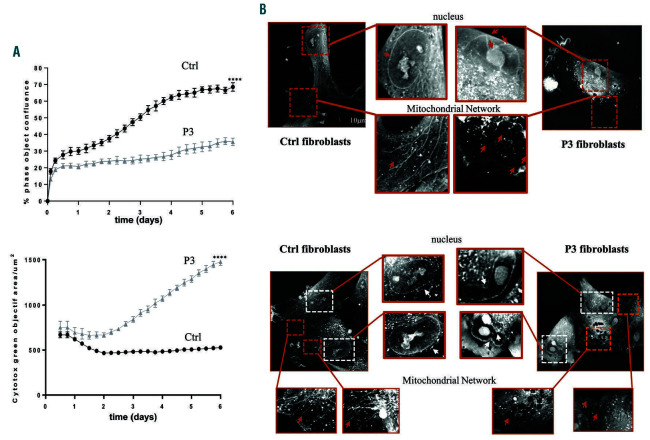
- Patient fibroblasts showed slower proliferation and higher death; mitochondrial networks were fragmented in 35% of P3 fibroblasts versus 10% of controls, and nuclear membranes were highly segmented.
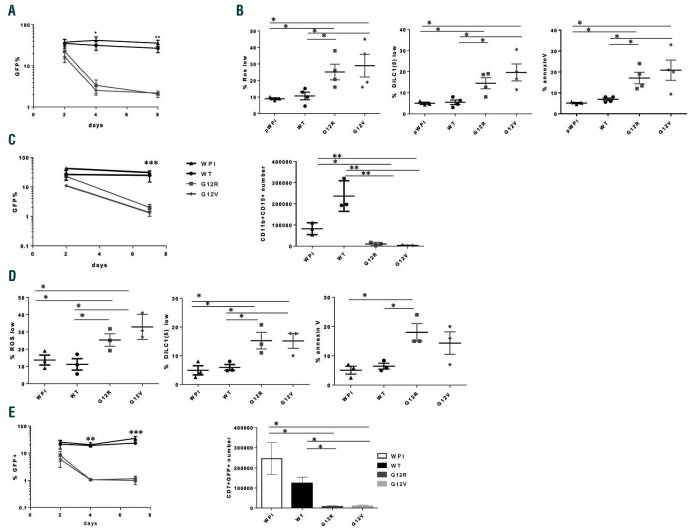
- CD34+ cord blood HSPC transduced with G12R or G12V showed disappearance of GFP+ cells within 4 days, impaired ROS production, mitochondrial membrane depolarization, increased apoptosis, and severely reduced neutrophil and T-cell differentiation; HSCT was successful in P1 and P2 with full donor immune reconstitution at 12 and 21 years after transplant, respectively.
Methods
- Case-based genetic and functional study of three patients from two unrelated kindreds, using primary patient fibroblasts, human cord blood CD34+ HSPC, and HEK293T cells; informed consent and ethics approvals are reported.
- Whole-exome sequencing was performed on patient fibroblasts (the Results text says whole-genome sequencing), with Sanger confirmation; the variant was absent from an in-house database of n=14,154 samples and gnomAD and was predicted deleterious by four in silico tools.
- Functional analyses included RAC2 activation G-LISA, immunoblotting, homology modeling, live-cell imaging, and in vitro HSPC differentiation toward granulocyte, monocyte, and T-lymphoid lineages; statistics used two-tailed unpaired t-tests with P<0.05 and three or more independent experiments.
Limitations
- Stated: no patient bone-marrow samples were available, so CD34+ human cord blood HSPC were used; the RAC2 signaling pathways targeted by G12R are not reported here; some data are limited (TREC tested only in P3, DNA from only P3’s father, and ROS inducer data not shown).
- Evident: the patient sample is very small (n=3), with no independent validation cohort; most functional evidence comes from in vitro or heterologous systems rather than an in vivo model or direct rescue experiment.
Model-written summary. Check it against the paper before relying on it.
Integrity signals
Registry
Cites
Statistics
Figures
Verification
Claims the paper makes
44 Own result · 29 Not checked yet · 27 Own interpretation · 7 Own method
A result the paper reports from its own data — it cites no other source for it, so there is none to check. The quote shows it is in the paper.
In the paper
“In three newborns presenting with frequent infections and profound leukopenia, we identified a private, heterozygous mutation in the RAC2 gene (p.G12R).”
§ A gain-of-function RAC2 mutation is associated with bone marrow hypoplasia and an autosomal dominant form of severe combined immunodeficiency > Abstract
plain- Asserted: passes — The authors put it forward as true.
- Checkable: passes — It can be checked against evidence.
- Load-bearing: passes — The paper’s conclusions depend on it.
- Based: passes — The paper gives a reason why it holds.
A result the paper reports from its own data — it cites no other source for it, so there is none to check. The quote shows it is in the paper.
In the paper
“Biochemical assays showed that the mutation was associated with a gain of function.”
- Also stated in: § G12R mutation in the GDP/GTP-binding domain disrupts cell homeostasis · boosted
“A high level of the active GTPbound RAC2 state was observed for both G12V and G12R (Figure 1E), demonstrating that substitution by arginine at position 12 increases the level of active RAC2 protein; hence, the G12R mutation is associated with GOF.”
§ A gain-of-function RAC2 mutation is associated with bone marrow hypoplasia and an autosomal dominant form of severe combined immunodeficiency > Abstract
boostedstates an association- Asserted: passes — The authors put it forward as true.
- Checkable: passes — It can be checked against evidence.
- Load-bearing: passes — The paper’s conclusions depend on it.
- Based: passes — The paper gives a reason why it holds.
- Also stated in: § G12R mutation in the GDP/GTP-binding domain disrupts cell homeostasis · boosted
A result the paper reports from its own data — it cites no other source for it, so there is none to check. The quote shows it is in the paper.
In the paper
“We have identified an autosomal dominant (AD) missense mutation in the RAC2 gene (coding for Ras-related C3 botulinum toxin substrate 2 [RAC2]) in three SCID patients whose clinical presentation overlaps with the RD SCID but who lack AK2 mutations and deafness.”
§ A gain-of-function RAC2 mutation is associated with bone marrow hypoplasia and an autosomal dominant form of severe combined immunodeficiency > Introduction
plainstates an associationn = 3- Asserted: passes — The authors put it forward as true.
- Checkable: passes — It can be checked against evidence.
- Load-bearing: passes — The paper’s conclusions depend on it.
- Based: passes — The paper gives a reason why it holds.
A result the paper reports from its own data — it cites no other source for it, so there is none to check. The quote shows it is in the paper.
In the paper
“This variant (confirmed by Sanger sequencing) was not annotated in our in-house database (n=14,154 samples in the cohort) or in the human Genome Aggregation Database, and was predicted to be deleterious by four different in silico prediction software tools, including Combined Annotation Dependent Depletion (Online Supplementary Figure S1B).”
§ A gain-of-function RAC2 mutation is associated with bone marrow hypoplasia and an autosomal dominant form of severe combined immunodeficiency > Results > A missense mutation (G12R) in the RAC2 GTPase protein leads to a severe combined immunodeficiencies phenotype
plain- Asserted: passes — The authors put it forward as true.
- Checkable: passes — It can be checked against evidence.
- Load-bearing: passes — The paper’s conclusions depend on it.
- Based: passes — The paper gives a reason why it holds.
A result the paper reports from its own data — it cites no other source for it, so there is none to check. The quote shows it is in the paper.
In the paper
“A high level of the active GTPbound RAC2 state was observed for both G12V and G12R (Figure 1E), demonstrating that substitution by arginine at position 12 increases the level of active RAC2 protein; hence, the G12R mutation is associated with GOF.”
§ A gain-of-function RAC2 mutation is associated with bone marrow hypoplasia and an autosomal dominant form of severe combined immunodeficiency > Results > G12R mutation in the GDP/GTP-binding domain disrupts cell homeostasis
boosted- Asserted: passes — The authors put it forward as true.
- Checkable: passes — It can be checked against evidence.
- Load-bearing: passes — The paper’s conclusions depend on it.
- Based: passes — The paper gives a reason why it holds.
- It may state two separate claims as one. 29
- Probably not a substantial claim. 23
- The quote only partly states this claim. 1
Create a free account to see these claims.
Create a free account to see these assumptions.
55 more claims
Create a free account to see all 107 claims and to verify the 65 references still open.
Self-check
Percentages, sums and reported differences re-computed from the paper’s own numbers.
Each contradiction between two passages listed here was confirmed by an independent check.
Rated minor: it would not touch a result — a value no result rests on, a p-value that stays on the same side of the significance level, or a conflict that is clerical, resolved elsewhere in the paper, or outside its own findings.
In the paper
§ A gain-of-function RAC2 mutation is associated with bone marrow hypoplasia and an autosomal dominant form of severe combined immunodeficiency > Methods > Statistical analysis
“For all analyses, three or more independent experiments were performed.”
§ A gain-of-function RAC2 mutation is associated with bone marrow hypoplasia and an autosomal dominant form of severe combined immunodeficiency > Results > G12R mutation inhibits hematopoietic stem/progenitor cell proliferation and differentiation
“The graph is representative of two independent experiments.”
Rated minor: it would not touch a result — a value no result rests on, a p-value that stays on the same side of the significance level, or a conflict that is clerical, resolved elsewhere in the paper, or outside its own findings.
In the paper
§ A gain-of-function RAC2 mutation is associated with bone marrow hypoplasia and an autosomal dominant form of severe combined immunodeficiency > Results > G12R mutation inhibits hematopoietic stem/progenitor cell proliferation and differentiation
“(C) Neutrophil differentiation in a 7-day culture.”
§ A gain-of-function RAC2 mutation is associated with bone marrow hypoplasia and an autosomal dominant form of severe combined immunodeficiency > Results > G12R mutation inhibits hematopoietic stem/progenitor cell proliferation and differentiation
“Flow cytometry was used to analyze the change over time in the percentage (%) of GFP+ cells from day 2 (when the transduction efficiency is measured) until day 8 (end of the culture)”
Rated minor: it would not touch a result — a value no result rests on, a p-value that stays on the same side of the significance level, or a conflict that is clerical, resolved elsewhere in the paper, or outside its own findings.
In the paper
§ A gain-of-function RAC2 mutation is associated with bone marrow hypoplasia and an autosomal dominant form of severe combined immunodeficiency > Methods > Gene sequencing and gene expression in the patient's fibroblasts
“Whole-exome sequencing was performed with an Illumina TruSeq exome enrichment kit (Illumina), using 100 bp paired-end reads.”
§ A gain-of-function RAC2 mutation is associated with bone marrow hypoplasia and an autosomal dominant form of severe combined immunodeficiency > Results > A missense mutation (G12R) in the RAC2 GTPase protein leads to a severe combined immunodeficiencies phenotype
“By performing whole-genome sequencing on the patients’ fibroblasts (the only available cell source, since the patients underwent HSCT early in life), we identified a heterozygous missense mutation (c.34G>A, p.G12R) in the RAC2 gene”
Citations
Cites
Pïcard, C., Gaspar, H. B., Al–Herz, W., Bousfiha, A. A., Casanova, J., Chatila, T. A., Crow, Y. J., Cunningham‐Rundles, C., Etzioni, A., Franco, J. L., et al. (2017) · Journal of Clinical Immunology · doi:10.1007/s10875-017-0464-9 · Cited by 816
Self-citationBiochemical and Structural Analysis of Common Cancer-Associated KRAS Mutations
Hunter, J. C., Manandhar, A., Carrasco, M. A., Gurbani, D., Gondi, S., & Westover, K. D. (2015) · Molecular Cancer Research · doi:10.1158/1541-7786.mcr-15-0203 · Cited by 786
Stem cells and the impact of ROS signaling
Bigarella, C. L., Liang, R. H.-S., & Ghaffari, S. (2014) · Development · doi:10.1242/dev.107086 · Cited by 664
Ježek, J., Cooper, K. F., & Strich, R. (2018) · Antioxidants · doi:10.3390/antiox7010013 · Cited by 539
Hematopoietic Cell Regulation by Rac1 and Rac2 Guanosine Triphosphatases
Gu, Y., Filippi, M.-D., Cancelas, J. A., Siefring, J. E., Williams, E. P., Jasti, A. C., Harris, C. E., Lee, A. W., Prabhakar, R., Atkinson, S. J., et al. (2003) · Science · doi:10.1126/science.1088485 · Cited by 510
Human neutrophil immunodeficiency syndrome is associated with an inhibitory Rac2 mutation
Ambruso, D. R., Knall, C., Abell, A. N., Panepinto, J., Kurkchubasche, A., Thurman, G., Gonzalez-Aller, C., Hiester, A., deBoer, M., Harbeck, R. J., et al. (2000) · Proceedings of the National Academy of Sciences · doi:10.1073/pnas.080074897 · Cited by 407
The mitochondrial respiratory chain is essential for haematopoietic stem cell function
Ansó, E., Weinberg, S. E., Diebold, L. P., Thompson, B. J., Malinge, S., Schumacker, P. T., Liu, X., Zhang, Y., Shao, Z., Steadman, M., et al. (2017) · Nature Cell Biology · doi:10.1038/ncb3529 · Cited by 328
Moore, A. S., Wong, Y. C., Simpson, C. L., & Holzbaur, E. L. F. (2016) · Nature Communications · doi:10.1038/ncomms12886 · Cited by 264
Human RAG mutations: biochemistry and clinical implications
Notarangelo, L. D., Kim, M., Walter, J. E., & Lee, Y. N. (2016) · Nature reviews. Immunology · doi:10.1038/nri.2016.28 · Cited by 241
Pannicke, U., Hönig, M., Hess, I., Friesen, C., Holzmann, K., Rump, E.-M., Barth, T. F., Rojewski, M. T., Schulz, A., Boehm, T., et al. (2009) · Nature Genetics · doi:10.1038/ng.265 · Cited by 237
Cited by
Single-cell transcriptomic and spatial landscapes of the developing human pancreas
Olaniru, O. E., Kadolsky, U. D., Kannambath, S., Vaikkinen, H., Fung, K., Dhami, P., & Persaud, S. J. (2022) · Cell Metabolism · doi:10.1016/j.cmet.2022.11.009 · Cited by 150
RAC2 and primary human immune deficiencies
Lougaris, V., Baronio, M., Gazzurelli, L., Benvenuto, A., & Plebani, A. (2020) · Journal of Leukocyte Biology · doi:10.1002/jlb.5mr0520-194rr · Cited by 59
Sprenkeler, E. G. G., Webbers, S. D. S., & Kuijpers, T. W. (2021) · Journal of Innate Immunity · doi:10.1159/000509717 · Cited by 54
Roos, D., van Leeuwen, K., Hsu, A. P., Priel, D. L., Begtrup, A. H., Brandon, R. C., Rawat, A. K., Vignesh, P., Madkaikar, M. R., Stasia, M. J., et al. (2021) · Blood Cells Molecules and Diseases · doi:10.1016/j.bcmd.2021.102596 · Cited by 46
Clinical and functional spectrum of RAC2-related immunodeficiency
Donkó, Á., Sharapova, S. O., Kabat, J., Ganesan, S., Hauck, F. H., Bergerson, J. R. E., Marois, L., Abbott, J., Moshous, D., Williams, K. W., et al. (2024) · Blood · doi:10.1182/blood.2023022098 · Cited by 32
Self-citationB- and T-Cell Subset Abnormalities in Monogenic Common Variable Immunodeficiency
Fekrvand, S., Khanmohammadi, S., Abolhassani, H., & Yazdani, R. (2022) · Frontiers in Immunology · doi:10.3389/fimmu.2022.912826 · Cited by 31
Host genetics of innate immune system in infection
Hsu, A. P., & Holland, S. M. (2022) · Current Opinion in Immunology · doi:10.1016/j.coi.2021.11.003 · Cited by 23
Hsu, A. P. (2023) · Clinical & Experimental Immunology · doi:10.1093/cei/uxad001 · Cited by 19
A novel RAC2 variant presenting as severe combined immunodeficiency
Stern, H., Donkó, A., Shapiro, T., Hsu, A. P., Leto, T. L., Holland, S. M., & Andreae, D. A. (2021) · Journal of Clinical Immunology · doi:10.1007/s10875-020-00915-2 · Cited by 15
Amirifar, P., Yazdani, R., Azizi, G., Ranjouri, M. R., Durandy, A., Plebani, A., Lougaris, V., Hammarström, L. L. G., Aghamohammadi, A., & Abolhassani, H. (2021) · Pediatric Allergy and Immunology · doi:10.1111/pai.13589 · Cited by 16
Combined Immunodeficiency Caused by a Novel De Novo Gain-of-Function RAC2 Mutation
Zhang, L., Chen, Z., Li, W., Liu, Q., Wang, Y., Chen, X., Tian, Z., Yang, Q., An, Y., Zhang, Z., et al. (2022) · Journal of Clinical Immunology · doi:10.1007/s10875-022-01288-4 · Cited by 14
RAC2 gain-of-function variants causing inborn error of immunity drive NLRP3 inflammasome activation
Doye, A., Chaintreuil, P., Lagresle-Peyrou, C., Batistic, L., Marion, V., Munro, P., Loubatier, C., Chirara, R., Sorel, N., Bessot, B., et al. (2024) · Journal of Experimental Medicine · doi:10.1084/jem.20231562 · Cited by 12
Self-citationStasia, M. J., & Roos, D. (2023) · Springer eBooks · doi:10.1007/978-3-031-23752-2_32 · Cited by 12
A Novel RAC2 Mutation Causing Combined Immunodeficiency
Zhang, L., Lv, G., Peng, Y., Yang, L., Chen, J., An, Y., Zhang, Z., Tang, X., Li, Z., & Zhao, X. (2022) · Journal of Clinical Immunology · doi:10.1007/s10875-022-01373-8 · Cited by 10
Lauri, A., Fasano, G., Venditti, M., Dallapiccola, B., & Tartaglia, M. (2021) · Frontiers in Cell and Developmental Biology · doi:10.3389/fcell.2021.642235 · Cited by 7
Duan, X., Shen, F., Deng, Y., Zhang, J. C., Fang, F., Luo, Z., Chen, Y., & Yang, Y. (2022) · Journal of Clinical Immunology · doi:10.1007/s10875-022-01411-5 · Cited by 4
Case Report: Profound newborn leukopenia related to a novel RAC2 variant
Hall, G., Donkó, Á., Pratt, C. M., Kim-Chang, J. J., Martin, P. L., Stallings, A. P., Sleasman, J. W., Holland, S. M., Hsu, A. P., Leto, T. L., et al. (2024) · Frontiers in Pediatrics · doi:10.3389/fped.2024.1365187 · Cited by 2
Rubin, T. S., Williams, K. W., & Lawrence, M. G. (2024) · Wiley eBooks · doi:10.1002/9781683674023.ch66 · Cited by 2
Allergic manifestations of actinopathies: A review
Gard, C. N., Freigeh, G. E., & Janssen, E. (2025) · Journal of Allergy and Clinical Immunology · doi:10.1016/j.jaci.2025.06.030 · Cited by 1
How Functional Variants Reconfigure the Rac2 Conformational Landscape
Haspel, N., Jang, H., & Nussinov, R. (2026) · The Journal of Physical Chemistry B · doi:10.1021/acs.jpcb.6c02540 · Cited by 1
Quantitative changes in blood cells
MBBS, F. B. J. B. (2021) · Wiley eBooks · doi:10.1002/9781119820307.ch6 · Cited by 1
Immunology of the Fetus and Newborn
Weitkamp, J.-H., Lewis, D. B., & Levy, O. (2023) · Elsevier eBooks · doi:10.1016/b978-0-323-82823-9.00032-5 · Cited by 1
Infectious Complications of Cell-Mediated Immunity Other Than AIDS
Gernez, Y., & Lewis, D. B. (2022) · Elsevier eBooks · doi:10.1016/b978-0-323-75608-2.00105-1
Gain-of-function RAC2 variants presenting as autoinflammatory phenotypesPreprint
Zhang, L., Lv, G., Li, Z., & Zhao, X. (2023) · Research Square · doi:10.21203/rs.3.rs-2731222/v1
Phenotypic spectrum in a family with a novel RAC2 p.I21S dominant‐activating mutation
Ashby, L. V., Chan, L., Winterbourn, C. C., Woon, S., Keating, P. E., Heller, R., Ameratunga, R., Chua, I. C., & Hsiao, K. (2024) · Clinical & Translational Immunology · doi:10.1002/cti2.1493
Overview of Immunodeficiency (Encyclopedie d’Immunologie)
Cavazzana, M. (2024) · Elsevier eBooks · doi:10.1016/b978-0-128-24465-4.00041-7
Self-citationBergerson, J., Freeman, A. F., Mace, E. M., & Sacco, K. A. (2024) · Wiley eBooks · doi:10.1002/9781683674023.ch69
Quantitative changes in blood cells
(2025) · Wiley eBooks · doi:10.1002/9781394332083.ch6
Immunodeficiencies Affecting Cellular and Humoral Immunity
Bucciol, G., Roifman, C. M., & Meyts, I. (2025) · Springer eBooks · doi:10.1007/978-3-032-01547-1_2
A Novel Gain‐of‐Function RAC2 Variant (p.Y64H) Associated With Lymphopenia and Leukopenia
Haliloğlu, Y., Boyer, L., Doye, A., Gök, V., Bişgin, A., Özcan, A., Canatan, H., Yilmaz, E. A., Karakükçü, M., Eken, A., et al. (2026) · Pediatric Blood & Cancer · doi:10.1002/1545-5017.70106
Self-citationDesjardins, A., Marois, L., Donkó, Á., Cros, G., Bédard, M.-A., Paul, M.-L., Hsu, A. P., Darbinian, E., Gosse, G., Leto, T., et al. (2026) · Frontiers in Immunology · doi:10.3389/fimmu.2026.1723142
Hsu, A. P. (2026) · Springer eBooks · doi:10.1007/978-3-032-21135-4_20
Wajed, S., Ferrandez, Y., Zeghouf, M., Ghasemi, R., Puertas, C., Nawrotek, A., & Gesbert, F. (2026) · Biochemical Journal · doi:10.1042/bcj20260225
Human inborn errors of the phagocyte respiratory burst: Chronic granulomatous disease and beyond
Neehus, A., Sankaran, V. G., Casanova, J., & Bustamante, J. C. (2026) · Journal of Human Immunity · doi:10.70962/jhi.20260106
Self-citationRAC2 orchestrates immune cell actin remodeling and migration
Berthiaume Fox, K. A., Galvin, E. R., Gurtner, G. C., & Chen, K. (2026) · Frontiers in Immunology · doi:10.3389/fimmu.2026.1917716
Metadata
- Authors
- Lagresle-Peyrou, C., Olichon, A., Sadek, H., Roche, P., Tardy, C., Silva, C. D., Garrigue, A., Fischer, A., Moshous, D., Collette, Y., Picard, C., Casanova, J. L., André, I., & Cavazzana, M.
- Affiliations
- Université Toulouse III - Paul Sabatier (FR)
- Inserm (FR)
- Aix-Marseille Université (FR)
- Hôpitaux Universitaires Paris-Ouest (FR)
- Hôpital Necker-Enfants Malades (FR)
- Institut des Maladies Génétiques Imagine (FR)
- Corresponding author
- Marina Cavazzana
- ORCID
- Venue
- Haematologica
- Published
- 2020-01-09
- Volume
- 106
- Issue
- 2
- Pages
- 404-411
- ISSN
- 0390-6078 (ISSN-L)
- 1592-8721
- PMC
- PMC7849581
- OpenAlex
- W3000320124
- Semantic Scholar
- ea1a25fb299bd7b691d4b411ef124d4dbb05bfbf
- Cited by
- 35
- References
- 47
- Citations by year
- 2026: 7 · 2025: 3 · 2024: 7 · 2023: 4 · 2022: 7 · 2021: 4 · 2020: 3
- FWCI
- 1.55
- Type
- journal article
- Language
- en
- Open access
- gold
- doi.org
- Licence
- Locations
- Haematologica (publishedVersion, cc-by-nc)
- Europe PMC (PubMed Central) (publishedVersion, cc-by-nc)
- PubMed (publishedVersion)
- PubMed Central (publishedVersion, cc-by-nc)
- HAL (submittedVersion, other-oa)
- DOAJ (DOAJ: Directory of Open Access Journals) (submittedVersion)
- Funders
- Institut des maladies génétiques Imagine
- Topics
- Life Sciences › Immunology and Microbiology › Immunology › Immunodeficiency and Autoimmune Disorders
- Health Sciences › Medicine › Hematology › Blood disorders and treatments
- Health Sciences › Medicine › Hematology › Hematopoietic Stem Cell Transplantation
- Keywords
- Rac2, severe combined immunodeficiency, gain-of-function mutations, bone marrow hypoplasia, hematopoietic stem cell transplantation, hematopoietic stem and progenitor cells, de novo mutations, leukopenia, T cell deficiency, B cell deficiency, genetic screening
- MeSH terms
- Gain of Function Mutation, Bone Marrow Failure Disorders, RAC2 GTP-Binding Protein, Bone Marrow, Female, Humans, Infant, Newborn, Mutation, Severe Combined Immunodeficiency, Hematopoietic Stem Cell Transplantation, rac GTP-Binding Proteins
About these checks
Registry, retraction, Cites and statistics results are computed, not judged, with one exception: a printed reference that no index lists is read once by a model before it counts as a citation error. Claims are extracted by a model and kept only when their quote appears verbatim in the text; each cited source is then checked, with a model’s help, for whether it says what the claim relies on. Those verdicts can be wrong — read the claim’s quote and the cited source before relying on one.
A language model drew the claims from the paper on 2026-11-12, under version 3 of the claim definition (model deepseek-v4.1-flash, prompt extract-v3).
A second model labelled each claim on 2026-11-12 (model jev-1.13-20260917, definition revision gold-guideline-v0.2).
Statistics and arithmetic are recomputed, not judged.
Confidence bands are shown only for fields calibrated on our annotated test set. None is calibrated yet, so no band is shown.
What counts as a claim ›How we measure confidence ›How we check this ›
Are you an author, or do you see a problem with this page? Request a review
