

The DOI matches its Crossref record; 44 of the 44 references it cites were found in a registry or an index.
Induction of Robust B Cell Responses after Influenza mRNA Vaccination Is Accompanied by Circulating Hemagglutinin-Specific ICOS+ PD-1+ CXCR3+ T Follicular Helper Cells
Open accessAbstract
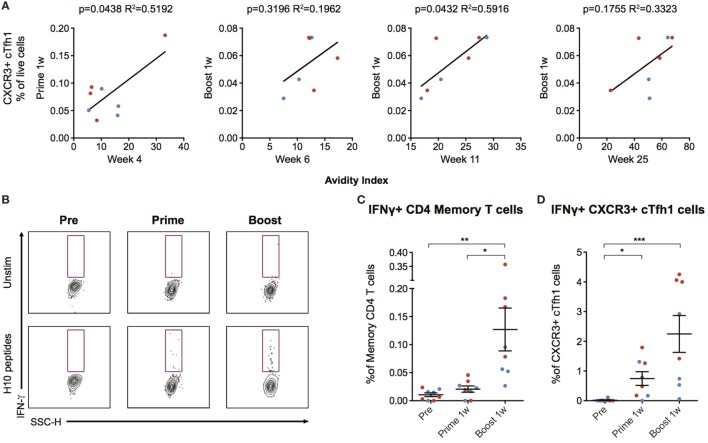
Modified mRNA vaccines have developed into an effective and well-tolerated vaccine platform that offers scalable and precise antigen production. Nevertheless, the immunological events leading to strong antibody responses elicited by mRNA vaccines are largely unknown. In this study, we demonstrate that protective levels of antibodies to hemagglutinin were induced after two immunizations of modified non-replicating mRNA encoding influenza H10 encapsulated in lipid nanoparticles (LNP) in non-human primates. While both intradermal (ID) and intramuscular (IM) administration induced protective titers, ID delivery generated this response more rapidly. Circulating H10-specific memory B cells expanded after each immunization, along with a transient appearance of plasmablasts. The memory B cell pool waned over time but remained detectable throughout the 25-week study. Following prime immunization, H10-specific plasma cells were found in the bone marrow and persisted over time. Germinal centers were formed in vaccine-draining lymph nodes along with an increase in circulating H10-specific ICOS+ PD-1+ CXCR3+ T follicular helper cells, a population shown to correlate with high avidity antibody responses after seasonal influenza vaccination in humans. Collectively, this study demonstrates that mRNA/LNP vaccines potently induce an immunological repertoire associated with the generation of high magnitude and quality antibodies.
Overview
The claims and statistics of this paper haven’t been checked yet.
Run the check — free, no account needed. It reads the open-access text and checks the sources it cites.
Integrity signals
Registry
Cites
Statistics
Figures
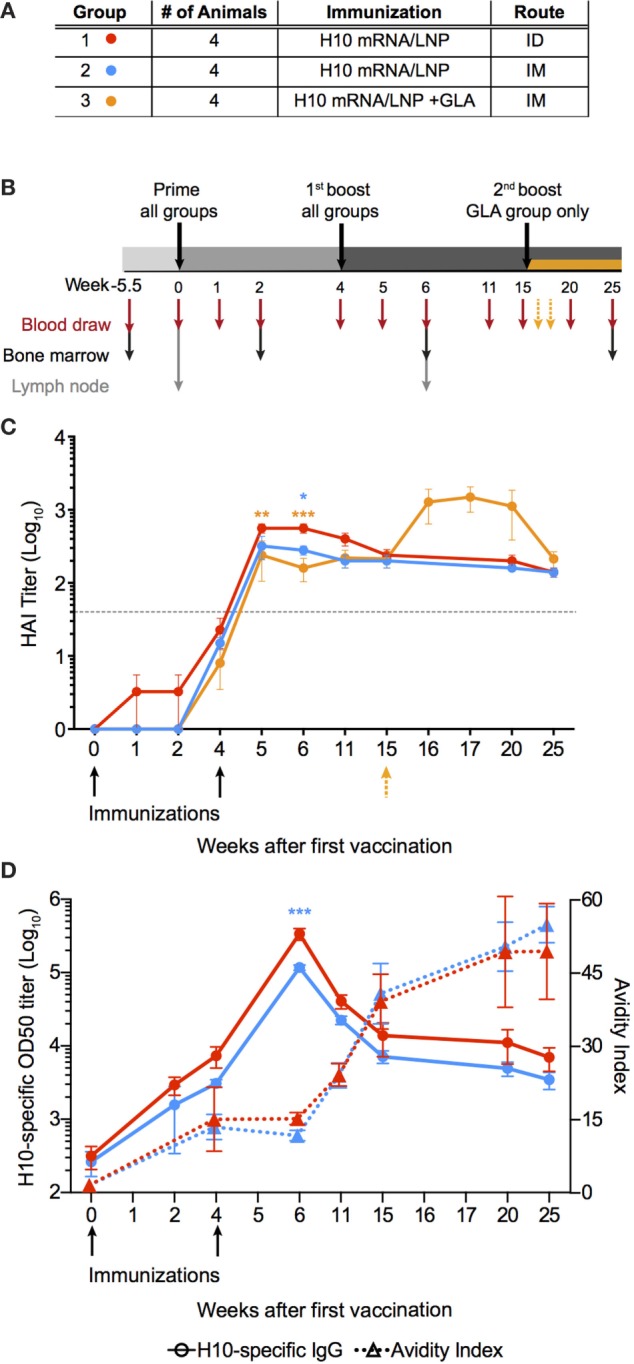
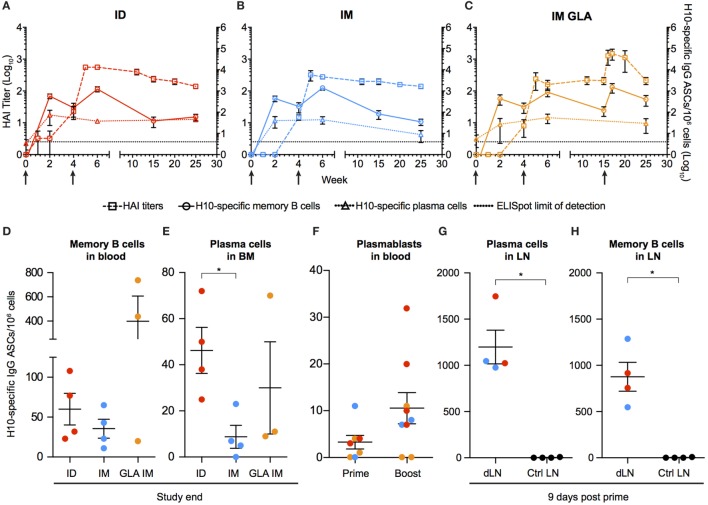
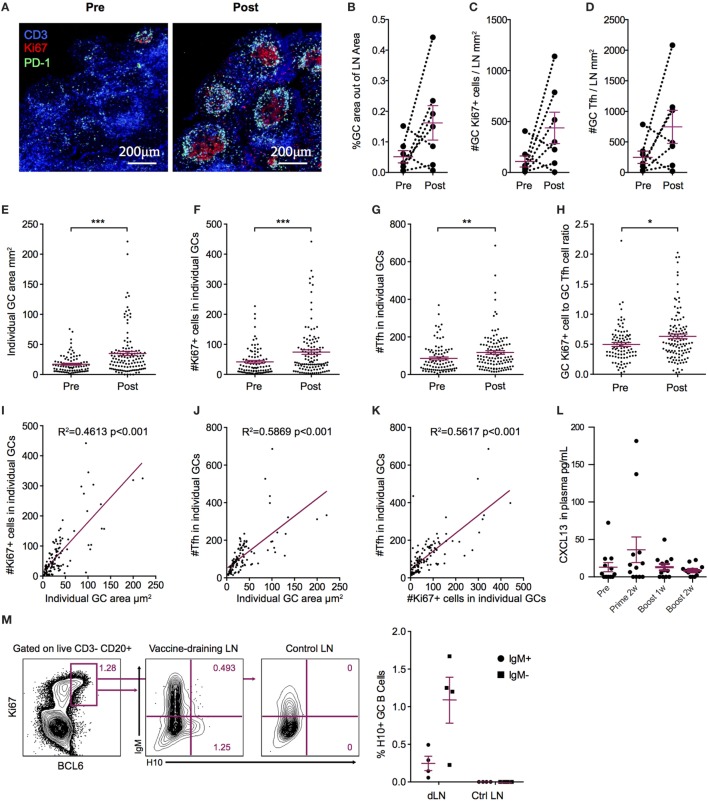
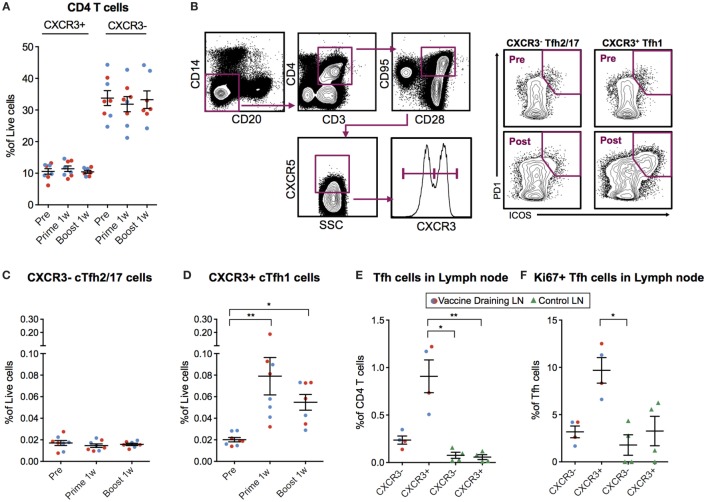
Verification
Claims the paper makes
The claims and statistics of this paper haven’t been checked yet.
Run the check — free, no account needed. It reads the open-access text and checks the sources it cites.
Claims other papers make about this one
Each is checked against this paper’s own text: does it say what the citing paper says it does?
In the citing paper
“several studies have shown that i.m. delivery of 1mΨ-modified mRNA vaccines results in the rapid and potent induction of follicular T helper cells (Tfh) [71,72].”
From The dawn of mRNA vaccines: the COVID-19 case (2021) · cites this paper as [71]
In the citing paper
“Additionally, the robust and sustained antigen expression of nucleoside-modified mRNA was associated with more optimal antibody responses compared to unmodified mRNA [12,13].”
From Three decades of messenger RNA vaccine development (2019) · cites this paper as [13]
Self-check
Percentages, sums and reported differences re-computed from the paper’s own numbers.
The self-check needs the paper’s full text.
Citations
Cites
Follicular Helper CD4 T Cells (T FH )
Crotty, S. (2011) · Annual Review of Immunology · doi:10.1146/annurev-immunol-031210-101400 · Cited by 2,738
mRNA-based therapeutics--developing a new class of drugs
Sahin, U., Karikó, K., & Türeci, Ö. (2014) · Nature Reviews Drug Discovery · doi:10.1038/nrd4278 · Cited by 2,474
Interferon-γ and B Cell Stimulatory Factor-1 Reciprocally Regulate Ig Isotype Production
Snapper, C. M., & Paul, W. E. (1987) · Science · doi:10.1126/science.3107127 · Cited by 1,927
Victora, G. D., & Nussenzweig, M. C. (2012) · Annual Review of Immunology · doi:10.1146/annurev-immunol-020711-075032 · Cited by 1,878
Systemic RNA delivery to dendritic cells exploits antiviral defence for cancer immunotherapy
Kranz, L. M., Diken, M., Haas, H., Kreiter, S., Loquai, C., Reuter, K. C., Meng, M., Fritz, D., Vascotto, F., Hefesha, H., et al. (2016) · Nature · doi:10.1038/nature18300 · Cited by 1,819
Efficacy and effectiveness of influenza vaccines: a systematic review and meta-analysis
Osterholm, M. T., Kelley, N. S., Sommer, A., & Belongia, E. A. (2012) · The Lancet Infectious Diseases · doi:10.1016/s1473-3099(11)70295-x · Cited by 1,789
Correlates of protection induced by vaccination
Plotkin, S. A. (2010) · Clinical and Vaccine Immunology · doi:10.1128/cvi.00131-10 · Cited by 1,745
The generation of antibody-secreting plasma cells
Nutt, S. L., Hodgkin, P. D., Tarlinton, D. M., & Corcoran, L. M. (2015) · Nature reviews. Immunology · doi:10.1038/nri3795 · Cited by 1,565
Morita, R., Schmitt, N., Bentebibel, S.-E., Ranganathan, R., Bourdery, L., Zurawski, G., Foucat, E., Dullaers, M., Oh, S., Sabzghabaei, N., et al. (2011) · Immunity · doi:10.1016/j.immuni.2010.12.012 · Cited by 1,563
Safety and efficacy of RNAi therapy for transthyretin amyloidosis
Coelho, T., Adams, D., Silva, A., Lozeron, P., Hawkins, P. N., Mant, T., Perez, J., Chiesa, J., Warrington, S., Tranter, E., et al. (2013) · New England Journal of Medicine · doi:10.1056/nejmoa1208760 · Cited by 971
Cited by
Sorted by citations
Alameh, M.-G., Tombácz, I., Bettini, E., Lederer, K., Ndeupen, S., Sittplangkoon, C., Wilmore, J. R., Gaudette, B. T., Soliman, O. Y., Pine, M., et al. (2021) · Immunity · doi:10.1016/j.immuni.2021.11.001 · Cited by 775
Advances in mRNA Vaccines for Infectious Diseases
Zhang, C., Maruggi, G., Shan, H., & Li, J. (2019) · Frontiers in Immunology · doi:10.3389/fimmu.2019.00594 · Cited by 696
Lipid nanoparticles for nucleic acid delivery: Current perspectives
Samaridou, E., Heyes, J. A., & Lutwyche, P. (2020) · Advanced Drug Delivery Reviews · doi:10.1016/j.addr.2020.06.002 · Cited by 609
New Vaccine Technologies to Combat Outbreak Situations
Rauch, S., Jasny, E., Schmidt, K. E., & Petsch, B. (2018) · Frontiers in Immunology · doi:10.3389/fimmu.2018.01963 · Cited by 579
Pardi, N., Hogan, M. J., Naradikian, M. S., Parkhouse, K., Cain, D. W., Jones, L., Moody, M. A., Verkerke, H. P., Myles, A., Willis, E., et al. (2018) · Journal of Experimental Medicine · doi:10.1084/jem.20171450 · Cited by 530
Metadata
- Authors
- Lindgren, G., Ols, S., Liang, F., Thompson, E. A., Lin, A., Hellgren, F., Bahl, K., John, S., Yuzhakov, O., Hassett, K. J., Brito, L. A., Salter, H., Ciaramella, G., & Loré, K.
- Affiliations
- Karolinska Institutet (SE)
- Moderna Therapeutics (United States) (US)
- Corresponding author
- Loré, Karin
- ORCID
- Venue
- Frontiers in Immunology
- Publisher
- Frontiers Media SA
- Published
- 2017-11-13
- Volume
- 8
- Pages
- 1539-1539
- ISSN
- 1664-3224 (ISSN-L)
- PMC
- PMC5693886
- OpenAlex
- W2767992446
- Cited by
- 132
- References
- 44
- Citations by year
- 2026: 3 · 2025: 13 · 2024: 9 · 2023: 16 · 2022: 25 · 2021: 37 · 2020: 15 · 2019: 10 · 2018: 4
- FWCI
- 6.21
- Type
- journal article
- Language
- en
- Update notices
- corrigendum (2019-04-02)
- Open access
- gold
- doi.org
- Licence
- cc-by
- Locations
- Frontiers in Immunology (publishedVersion, cc-by)
- PubMed Central (publishedVersion, cc-by)
- PubMed (publishedVersion)
- DOAJ (DOAJ: Directory of Open Access Journals) (submittedVersion, cc-by-sa)
- Funders
- Karolinska Institutet
- Vetenskapsrådet
- China Scholarship Council
- Topics
- Health Sciences › Medicine › Epidemiology › Influenza Virus Research Studies
- Life Sciences › Immunology and Microbiology › Immunology › Immunotherapy and Immune Responses
- Life Sciences › Immunology and Microbiology › Immunology › Immune responses and vaccinations
- Keywords
- T follicular helper cells, ICOS, PD-1, CXCR3, memory B cells, plasma cells, germinal center, intradermal vaccination, intramuscular vaccination, non-human primates, vaccine immunogenicity
About these checks
Registry, retraction, Cites and statistics results are computed, not judged, with one exception: a printed reference that no index lists is read once by a model before it counts as a citation error. Claims are extracted by a model and kept only when their quote appears verbatim in the text; each cited source is then checked, with a model’s help, for whether it says what the claim relies on. Those verdicts can be wrong — read the claim’s quote and the cited source before relying on one.
Statistics and arithmetic are recomputed, not judged.
Confidence bands are shown only for fields calibrated on our annotated test set. None is calibrated yet, so no band is shown.
What counts as a claim ›How we measure confidence ›How we check this ›
Are you an author, or do you see a problem with this page? Request a review
