

The DOI matches its Crossref record; 36 of the 36 references it cites were found in a registry or an index.
Alzheimer’s Risk Gene TREM2 Determines Functional Properties of New Type of Human iPSC-Derived Microglia
Abstract
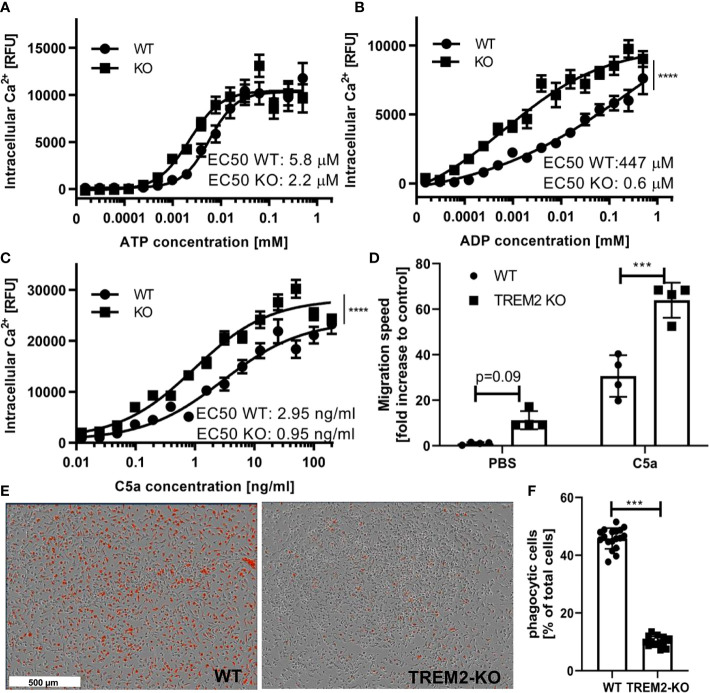
Microglia are key in the homeostatic well-being of the brain and microglial dysfunction has been implicated in neurodegenerative disorders such as Alzheimer’s disease (AD). Due to the many limitations to study microglia in situ or isolated for large scale drug discovery applications, there is a high need to develop robust and scalable human cellular models of microglia with reliable translatability to the disease. Here, we describe the generation of microglia-like cells from human induced pluripotent stem cells (iPSC) with distinct phenotypes for mechanistic studies in AD. We started out from an established differentiation protocol to generate primitive macrophage precursors mimicking the yolk sac ontogeny of microglia. Subsequently, we tested 36 differentiation conditions for the cells in monoculture where we exposed them to various combinations of media, morphogens, and extracellular matrices. The optimized protocol generated robustly ramified cells expressing key microglial markers. Bulk mRNA sequencing expression profiles revealed that compared to cells obtained in co-culture with neurons, microglia-like cells derived from a monoculture condition upregulate mRNA levels for Triggering Receptor Expressed On Myeloid Cells 2 (TREM2), which is reminiscent to the previously described disease-associated microglia. TREM2 is a risk gene for AD and an important regulator of microglia. The regulatory function of TREM2 in these cells was confirmed by comparing wild type with isogenic TREM2 knock-out iPSC microglia. The TREM2-deficient cells presented with stronger increase in free cytosolic calcium upon stimulation with ATP and ADP, as well as stronger migration towards complement C5a, compared to TREM2 expressing cells. The functional differences were associated with gene expression modulation of key regulators of microglia. In conclusion, we have established and validated a work stream to generate functional human iPSC-derived microglia-like cells by applying a directed and neuronal co-culture independent differentiation towards functional phenotypes in the context of AD. These cells can now be applied to study AD-related disease settings and to perform compound screening and testing for drug discovery.
Overview
The claims and statistics of this paper haven’t been checked yet.
Run the check — free, no account needed. It reads the open-access text and checks the sources it cites.
Integrity signals
Registry
Cites
Statistics
Figures
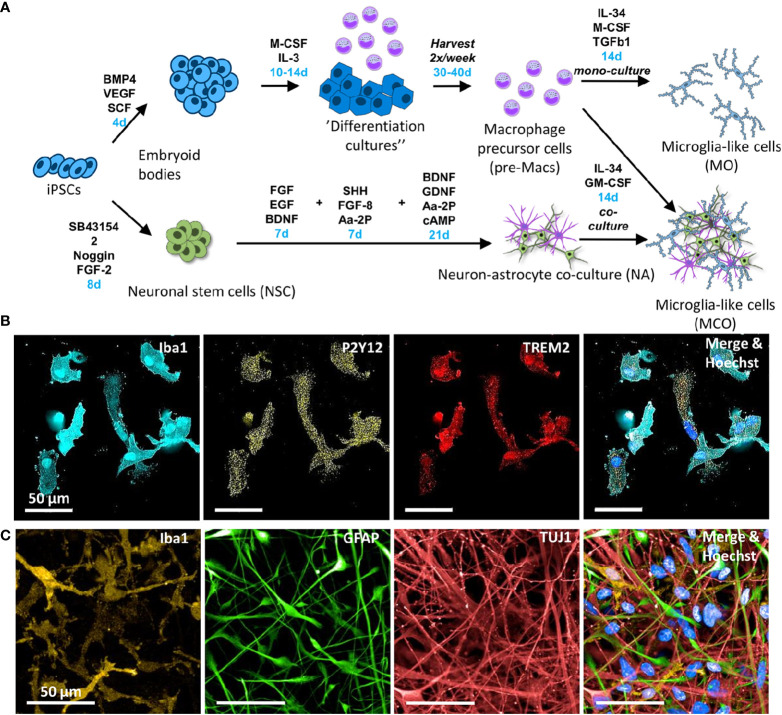
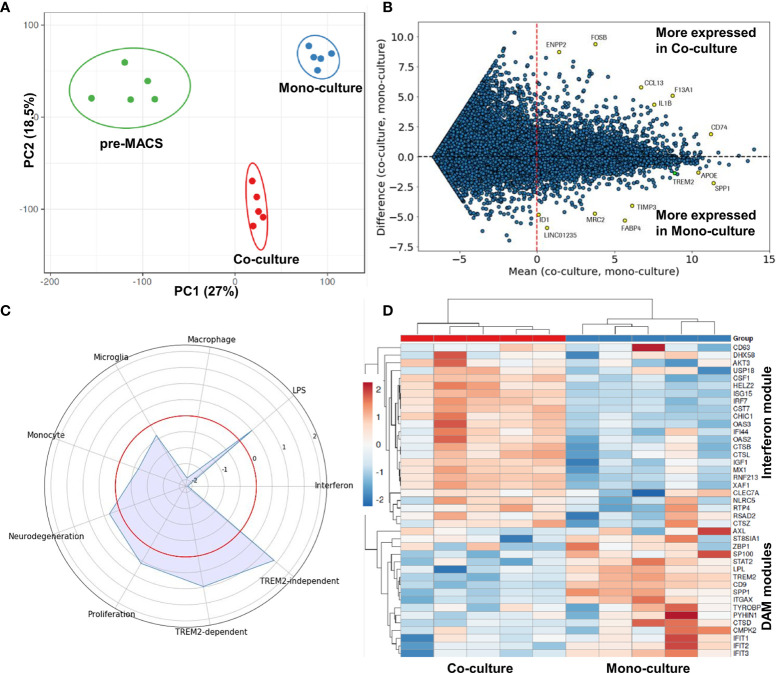
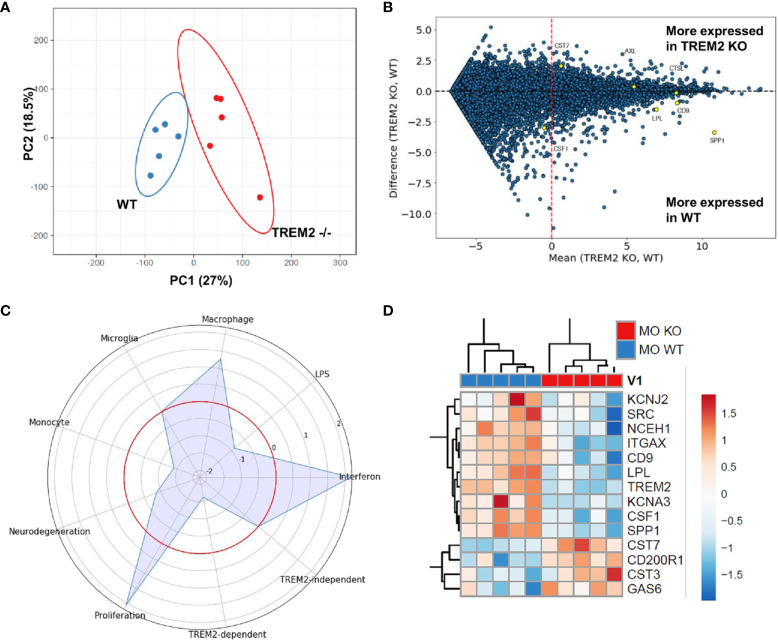
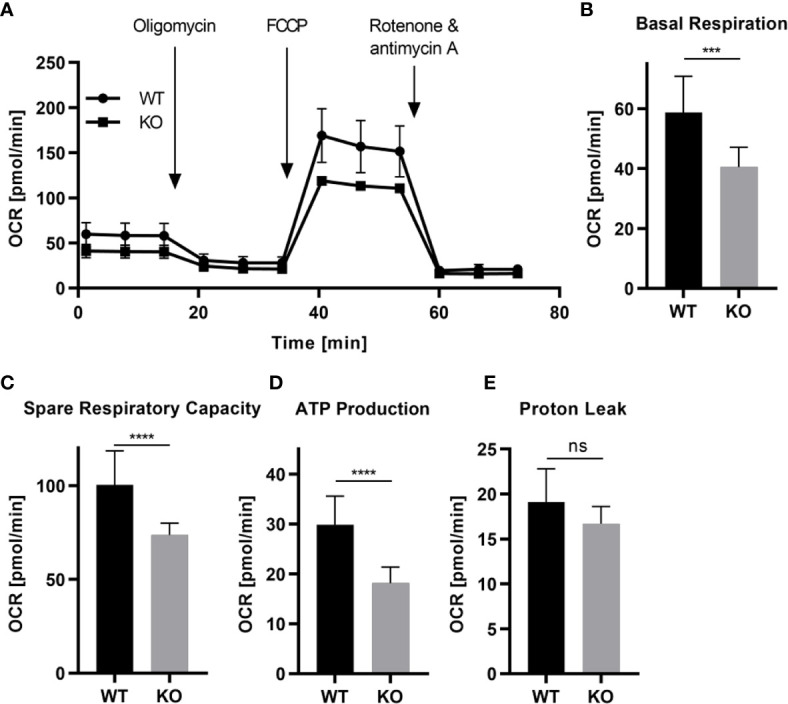
Verification
Claims the paper makes
The claims and statistics of this paper haven’t been checked yet.
Run the check — free, no account needed. It reads the open-access text and checks the sources it cites.
Claims other papers make about this one
Each is checked against this paper’s own text: does it say what the citing paper says it does?
The source backs part of the claim, not all of it — or backs it for a different population, condition or comparison.
In the citing paper
“Similarly, although both groups could perform phagocytosis, both the percentage of phagocytic cells and the phagocytic index were lower in AD than in healthy control iMGs (Fig. 2H, Supplementary Fig. 2F), as has been previously reported in human iPSC-derived microglia with altered expression of AD risk genes [60–64].”
From microRNA-132 attenuates inflammation in induced pluripotent stem cell-derived microglia from Alzheimer’s disease patients (2026) · cites this paper as [63]
Experimental — accuracy not yet measuredThe source backs part of the claim, not all of it — or backs it for a different population, condition or comparison.
In the citing paper
“Notable shared features include reduced phagocytosis, previously reported in human iPSC-derived microglia with altered expression of AD risk genes [60–64], and increased expression of inflammatory genes (such as complement C3), consistent with findings from human AD brain and APOE4/4 iPSC-derived microglia [52, 60, 61].”
From microRNA-132 attenuates inflammation in induced pluripotent stem cell-derived microglia from Alzheimer’s disease patients (2026) · cites this paper as [63]
Experimental — accuracy not yet measuredThe source backs part of the claim, not all of it — or backs it for a different population, condition or comparison.
In the citing paper
“Notably, iPSC-derived microglia with altered expression of the sAD risk genes APOE4 and TREM2 display pronounced phenotypic differences from control microglia, such as impaired phagocytosis, whereas mutations involved in familial AD have a more limited impact on microglial function [51, 60–63, 119–122].”
From microRNA-132 attenuates inflammation in induced pluripotent stem cell-derived microglia from Alzheimer’s disease patients (2026) · cites this paper as [63]
Experimental — accuracy not yet measured
Self-check
Percentages, sums and reported differences re-computed from the paper’s own numbers.
The self-check needs the paper’s full text.
Citations
Cites
Microglia Sculpt Postnatal Neural Circuits in an Activity and Complement-Dependent Manner
Schafer, D. P., Lehrman, E. K., Kautzman, A. G., Koyama, R., Mardinly, A. R., Yamasaki, R., Ransohoff, R. M., Greenberg, M. E., Barres, B. A., & Stevens, B. (2012) · Neuron · doi:10.1016/j.neuron.2012.03.026 · Cited by 4,089
Krasemann, S., Madore, C., Cialic, R., Baufeld, C., Calcagno, N., El Fatimy, R., Beckers, L., O’Loughlin, E., Xu, Y., Fanek, Z., et al. (2017) · Immunity · doi:10.1016/j.immuni.2017.08.008 · Cited by 2,979
Variant of TREM2 Associated with the Risk of Alzheimer's Disease
Jonsson, T., Stefansson, H., Steinberg, S., Jonsdottir, I., Jonsson, P. V., Snaedal, J., Bjornsson, S., Huttenlocher, J., Levey, A. I., Lah, J. J., et al. (2013) · New England Journal of Medicine · doi:10.1056/nejmoa1211103 · Cited by 2,558
Identification of a unique TGF-β–dependent molecular and functional signature in microglia
Butovsky, O., Jedrychowski, M. P., Moore, C. S., Cialic, R., Lanser, A. J., Gabriely, G., Koeglsperger, T., Dake, B., Wu, P. M., Doykan, C. E., et al. (2014) · Nature Neuroscience · doi:10.1038/nn.3599 · Cited by 2,543
Tissue-resident macrophages originate from yolk-sac-derived erythro-myeloid progenitors
Gomez Perdiguero, E., Klapproth, K., Schulz, C., Busch, K., Azzoni, E., Crozet, L., Garner, H., Trouillet, C., de Bruijn, M. F., Geissmann, F., et al. (2015) · Nature · doi:10.1038/nature13989 · Cited by 2,339
Hammond, T. R., Dufort, C., Dissing-Olesen, L., Giera, S., Young, A., Wysoker, A., Walker, A. J., Segel, M., Nemesh, J., Saunders, A., et al. (2018) · doi:10.1101/406140 · Cited by 2,225
Microglia Shape Adult Hippocampal Neurogenesis through Apoptosis-Coupled Phagocytosis
Sierra, A., Encinas, J. M., Deudero, J. J. P., Chancey, J. H., Enikolopov, G., Overstreet-Wadiche, L. S., Tsirka, S. E., & Maletic-Savatic, M. (2010) · Cell Stem Cell · doi:10.1016/j.stem.2010.08.014 · Cited by 1,622
The P2Y12 receptor regulates microglial activation by extracellular nucleotides
Haynes, S. E., Hollopeter, G., Yang, G., Kurpius, D., Dailey, M. E., Gan, W.-B., & Julius, D. (2006) · Nature Neuroscience · doi:10.1038/nn1805 · Cited by 1,542
Disease-Associated Microglia: A Universal Immune Sensor of Neurodegeneration
Deczkowska, A., Keren-Shaul, H., Weiner, A., Colonna, M., Schwartz, M., & Amit, I. (2018) · Cell · doi:10.1016/j.cell.2018.05.003 · Cited by 1,474
Microglia emerge from erythromyeloid precursors via Pu.1- and Irf8-dependent pathways
Kierdorf, K., Erny, D., Goldmann, T., Sander, V., Schulz, C., Perdiguero, E. G., Wieghofer, P., Heinrich, A., Riemke, P., Hölscher, C., et al. (2013) · Nature Neuroscience · doi:10.1038/nn.3318 · Cited by 1,457
Research works printed but not linked: 49
- Ousman, 2012, Immune surveillance in the central nervous system, Nat Neurosci, 15, 10.1038/nn.3161 · DOI
- Paolicelli, 2011, Synaptic Pruning by Microglia Is Necessary for Normal Brain Development, Science, 333, 10.1126/science.1202529 · DOI · Paper page
- Parkhurst, 2013, Microglia promote learning-dependent synapse formation through brain-derived neurotrophic factor, Cell, 155, 10.1016/j.cell.2013.11.030 · DOI · Paper page
- Shigemoto-Mogami, 2014, Microglia Enhance Neurogenesis and Oligodendrogenesis in the Early Postnatal Subventricular Zone, J Neurosci, 34, 10.1523/JNEUROSCI.1619-13.2014 · DOI
- Zhou, 2019, Microglia Are Indispensable for Synaptic Plasticity in the Spinal Dorsal Horn and Chronic Pain, Cell Rep, 27, 3844, 10.1016/j.celrep.2019.05.087 · DOI · Paper page
- Sierra, 2019, Cien Anos de Microglia: Milestones in a Century of Microglial Research, Trends Neurosci, 42, 10.1016/j.tins.2019.09.004 · DOI
- Kunkle, 2019, Genetic meta-analysis of diagnosed Alzheimer’s disease identifies new risk loci and implicates Aβ, tau, immunity and lipid processing, Nat Genet, 51, 10.1038/s41588-019-0358-2 · DOI · Paper page
- Lambert, 2013, Meta-analysis of 74,046 individuals identifies 11 new susceptibility loci for Alzheimer’s disease, Nat Genet, 45, 10.1038/ng.2802 · DOI · Paper page
- Henn, 2009, The suitability of BV2 cells as alternative model system for primary microglia cultures or for animal experiments examining brain inflammation, ALTEX, 26, 83, 10.14573/altex.2009.2.83 · DOI · Paper page
- Lund, 2006, The dynamics of the LPS triggered inflammatory response of murine microglia under different culture and in vivo conditions, J Neuroimmunol, 180, 71, 10.1016/j.jneuroim.2006.07.007 · DOI
- Mizee, 2017, Isolation of primary microglia from the human post-mortem brain: effects of ante- and post-mortem variables, Acta Neuropathologica Commun, 5, 16, 10.1186/s40478-017-0418-8 · DOI
- Olah, 2012, An optimized protocol for the acute isolation of human microglia from autopsy brain samples, Glia, 60, 96, 10.1002/glia.21251 · DOI
- Timmerman, 2018, An Overview of in vitro Methods to Study Microglia, Front Cell Neurosci, 242, 10.3389/fncel.2018.00242 · DOI
- Melief, 2016, Characterizing primary human microglia: A comparative study with myeloid subsets and culture models, Glia, 64, 10.1002/glia.23023 · DOI
- Takahashi, 2007, Induction of Pluripotent Stem Cells from Adult Human Fibroblasts by Defined Factors, Cell, 131, 10.1016/j.cell.2007.11.019 · DOI · Paper page
- Takahashi, 2006, Induction of Pluripotent Stem Cells from Mouse Embryonic and Adult Fibroblast Cultures by Defined Factors, Cell, 126, 10.1016/j.cell.2006.07.024 · DOI · Paper page
- Ginhoux, 2010, Fate Mapping Analysis Reveals That Adult Microglia Derive from Primitive Macrophages, Science, 330, 10.1126/science.1194637 · DOI · Paper page
- Abud, 2017, iPSC-Derived Human Microglia-like Cells to Study Neurological Diseases, Neuron, 94, 278, 10.1016/j.neuron.2017.03.042 · DOI · Paper page
- Pandya, 2017, Differentiation of human and murine induced pluripotent stem cells to microglia-like cells, Nat Neurosci, 20, 10.1038/nn.4534 · DOI · Paper page
- Gutbier, 2020, Large-Scale Production of Human iPSC-Derived Macrophages for Drug Screening, Int J Mol Sci, 21, 4808, 10.3390/ijms21134808 · DOI
- Lucin, 2009, Immune activation in brain aging and neurodegeneration: too much or too little, Neuron, 64, 10.1016/j.neuron.2009.08.039 · DOI · Paper page
- Colonna, 2016, TREM2 variants: new keys to decipher Alzheimer disease pathogenesis, Nat Rev Neurosci, 17, 10.1038/nrn.2016.7 · DOI · Paper page
- Guerreiro, 2013, TREM2 variants in Alzheimer’s disease, New Engl J Med, 368, 10.1056/NEJMoa1211851 · DOI · Paper page
- Kleinberger, 2017, The FTD-like syndrome causing TREM2 T66M mutation impairs microglia function, brain perfusion, and glucose metabolism, EMBO J, 36, 10.15252/embj.201796516 · DOI
- Korvatska, 2015, R47H Variant of TREM2 Associated With Alzheimer Disease in a Large Late-Onset Family: Clinical, Genetic, and Neuropathological Study, JAMA Neurol, 72, 10.1001/jamaneurol.2015.0979 · DOI · Paper page
- Keren-Shaul, 2017, A Unique Microglia Type Associated with Restricting Development of Alzheimer’s Disease, Cell, 169, 1276, 10.1016/j.cell.2017.05.018 · DOI · Paper page
- Wang, 2020, Anti-human TREM2 induces microglia proliferation and reduces pathology in an Alzheimer’s disease model, J Exp Med, 217, 9, 10.1084/jem.20200785 · DOI · Paper page
- Dobin, 2013, STAR: ultrafast universal RNA-seq aligner, Bioinf (Oxford England), 29, 15, 10.1093/bioinformatics/bts635 · DOI · Paper page
- Andrews, 2010, FastQC: a quality control tool for high throughput sequence data, Babraham Institute
- Ewels, 2016, MultiQC: summarize analysis results for multiple tools and samples in a single report, Bioinf (Oxford England), 32, 10.1093/bioinformatics/btw354 · DOI · Paper page
- Li, 2009, The Sequence Alignment/Map format and SAMtools. Bioinformatics (Oxford, England), 25, 10.1093/bioinformatics/btp352 · DOI · Paper page
- Mortazavi, 2008, Mapping and quantifying mammalian transcriptomes by RNA-Seq, Nat Methods, 5, 10.1038/nmeth.1226 · DOI · Paper page
- Metsalu, 2015, ClustVis: a web tool for visualizing clustering of multivariate data using Principal Component Analysis and heatmap, Nucleic Acids Res, 43, 10.1093/nar/gkv468 · DOI
- Pomaznoy, 2018, GOnet: a tool for interactive Gene Ontology analysis, BMC Bioinf, 19, 470, 10.1186/s12859-018-2533-3 · DOI
- Muffat, 2016, Efficient derivation of microglia-like cells from human pluripotent stem cells, Nat Med, 22, 10.1038/nm.4189 · DOI · Paper page
- Hamilton, 2019, GM-CSF-Dependent Inflammatory Pathways, Front Immunol, 10, 10.3389/fimmu.2019.02055 · DOI
- Nimmerjahn, 2005, Resting Microglial Cells Are Highly Dynamic Surveillants of Brain Parenchyma in Vivo, Science, 308, 10.1126/science.1110647 · DOI · Paper page
- Song, 2017, Complement C5a receptor knockout has diminished light-induced microglia/macrophage retinal migration, Mol Vis, 23
- Gasque, 1997, Expression of the receptor for complement C5a (CD88) is up-regulated on reactive astrocytes, microglia, and endothelial cells in the inflamed human central nervous system, Am J Pathol, 150, 31
- Honda, 2011, Extracellular ATP or ADP induce chemotaxis of cultured microglia through Gi/o-coupled P2Y receptors, 10.1523/JNEUROSCI.21-06-01975.2001 · DOI · Paper page
- Light, 2006, Purinergic receptors activating rapid intracellular Ca increases in microglia, Neuron Glia Biol, 2, 10.1017/S1740925X05000323 · DOI
- Zilkova, 2020, Humanized tau antibodies promote tau uptake by human microglia without any increase of inflammation, Acta Neuropathol Commun, 8, 74, 10.1186/s40478-020-00948-z · DOI
- Jung, 2000, Analysis of fractalkine receptor CX(3)CR1 function by targeted deletion and green fluorescent protein reporter gene insertion, Mol Cell Biol, 20, 10.1128/MCB.20.11.4106-4114.2000 · DOI · Paper page
- Jackson, 2020, A novel mouse model expressing human forms for complement receptors CR1 and CR2, BMC Genet, 21, 101, 10.1186/s12863-020-00893-9 · DOI
- Ryan, 2017, A human microglia-like cellular model for assessing the effects of neurodegenerative disease gene variants, Sci Trans Med, 9, 421, 10.1126/scitranslmed.aai7635 · DOI
- Douvaras, 2017, Directed Differentiation of Human Pluripotent Stem Cells to Microglia, Stem Cell Rep, 8, 10.1016/j.stemcr.2017.04.023 · DOI · Paper page
- Brüll, 2020, Incorporation of stem cell-derived astrocytes into neuronal organoids to allow neuro-glial interactions in toxicological studies, Altex, 37, 10.14573/altex.1911111 · DOI
- Shi, 2018, Interplay between innate immunity and Alzheimer disease: APOE and TREM2 in the spotlight, Nat Rev Immunol, 18, 10.1038/s41577-018-0051-1 · DOI · Paper page
- Alepee, 2014, State-of-the-art of 3D cultures (organs-on-a-chip) in safety testing and pathophysiology, ALTEX, 31, 10.14573/altex.1406111 · DOI
Cited by
Sorted by citations
Microglia in Alzheimer's disease at single-cell level. Are there common patterns in humans and mice?
Chen, Y., & Colonna, M. (2021) · Journal of Experimental Medicine · doi:10.1084/jem.20202717 · Cited by 339
Garcia, G., Pinto, S., Ferreira, S., Lopes, D., Serrador, M. J., Fernandes, A., Vaz, A. R., Mendonça, A. D., Edenhofer, F., Malm, T., et al. (2022) · Cells · doi:10.3390/cells11213377 · Cited by 55
Pocock, J., Vasilopoulou, F., Svensson, E., & Cosker, K. (2024) · Neuropharmacology · doi:10.1016/j.neuropharm.2024.110020 · Cited by 54
Penning, A., Snoeck, S., Ormaechea, O. R., Ayyildiz, D., Polzer, O., Buitrago-Arango, M., Capobianco, R., de Winter, F., Balusu, S., Verhaagen, J., et al. (2026) · Acta Neuropathologica Communications · doi:10.1186/s40478-026-02228-8 · Cited by 6
Metadata
- Authors
- Reich, M., Paris, I., Ebeling, M., Dahm, N., Schweitzer, C., Reinhardt, D., Schmucki, R., Prasad, M., Köchl, F., Leist, M., Cowley, S. A., Zhang, J. D., Patsch, C., Gutbier, S., & Britschgi, M.
- Venue
- Frontiers in Immunology
- Publisher
- Frontiers Media SA
- Published
- 2021-02-03
- Volume
- 11
- ISSN
- 1664-3224
- PMC
- PMC7887311
- Cited by
- 49
- References
- 36
About these checks
Registry, retraction, Cites and statistics results are computed, not judged, with one exception: a printed reference that no index lists is read once by a model before it counts as a citation error. Claims are extracted by a model and kept only when their quote appears verbatim in the text; each cited source is then checked, with a model’s help, for whether it says what the claim relies on. Those verdicts can be wrong — read the claim’s quote and the cited source before relying on one.
Statistics and arithmetic are recomputed, not judged.
Confidence bands are shown only for fields calibrated on our annotated test set. None is calibrated yet, so no band is shown.
What counts as a claim ›How we measure confidence ›How we check this ›
Are you an author, or do you see a problem with this page? Request a review
