

The DOI matches its Crossref record; 423 of the 429 references it cites were found in a registry or an index.
Cancer Immune Evasion Through Loss of MHC Class I Antigen Presentation
Open accessAbstract
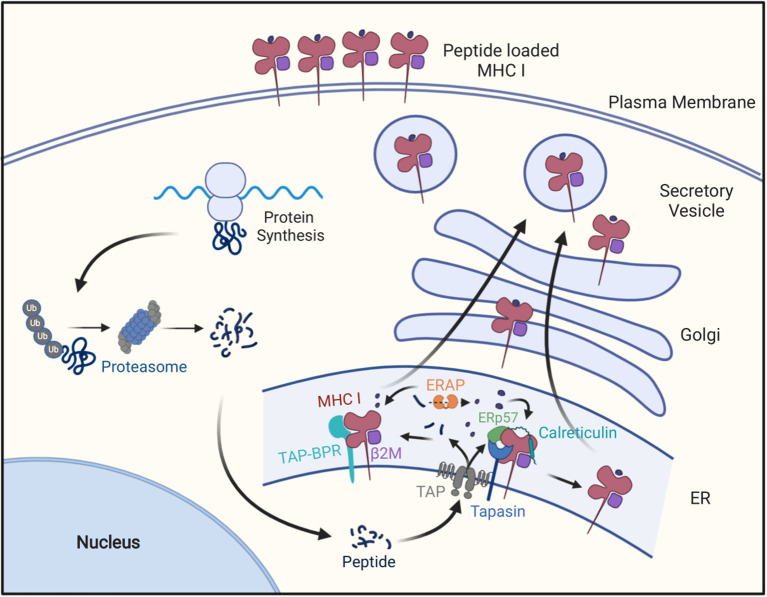
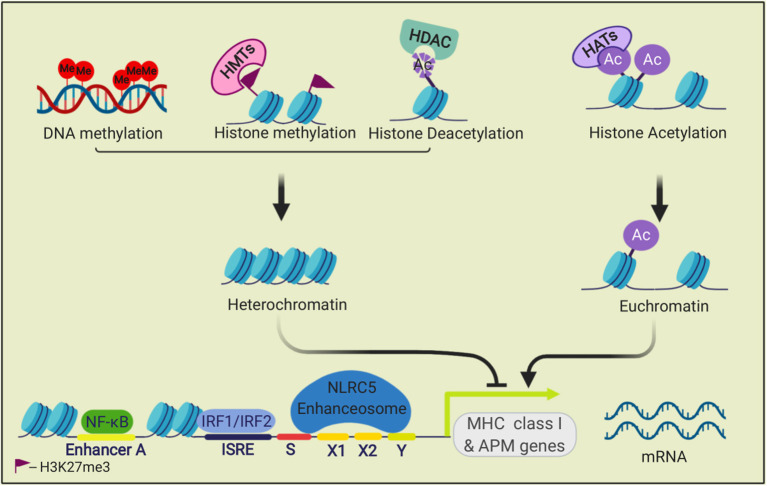
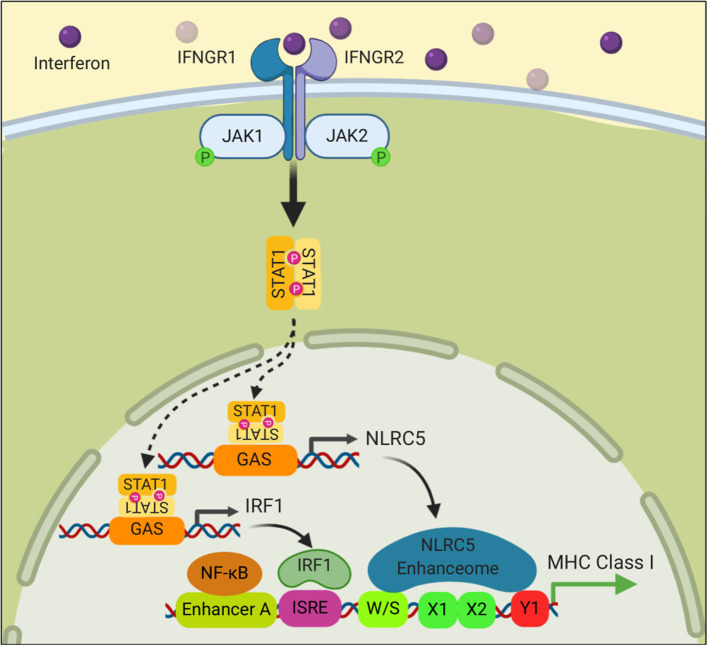
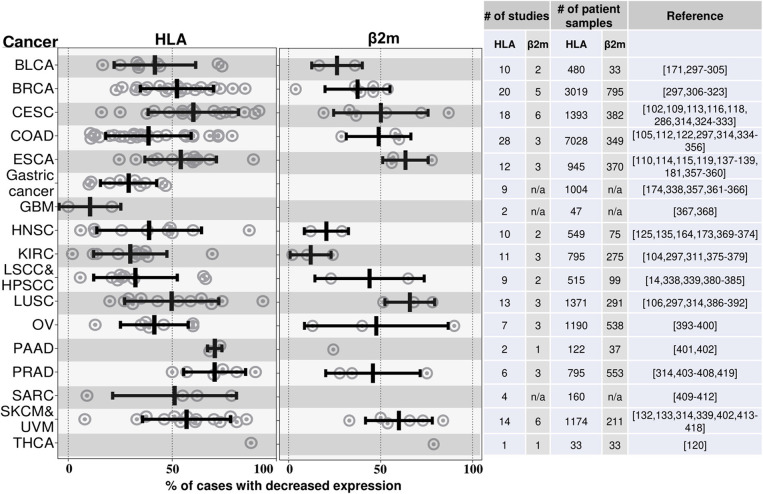
Major histocompatibility class I (MHC I) molecules bind peptides derived from a cell's expressed genes and then transport and display this antigenic information on the cell surface. This allows CD8 T cells to identify pathological cells that are synthesizing abnormal proteins, such as cancers that are expressing mutated proteins. In order for many cancers to arise and progress, they need to evolve mechanisms to avoid elimination by CD8 T cells. MHC I molecules are not essential for cell survival and therefore one mechanism by which cancers can evade immune control is by losing MHC I antigen presentation machinery (APM). Not only will this impair the ability of natural immune responses to control cancers, but also frustrate immunotherapies that work by re-invigorating anti-tumor CD8 T cells, such as checkpoint blockade. Here we review the evidence that loss of MHC I antigen presentation is a frequent occurrence in many cancers. We discuss new insights into some common underlying mechanisms through which some cancers inactivate the MHC I pathway and consider some possible strategies to overcome this limitation in ways that could restore immune control of tumors and improve immunotherapy.
Overview
The claims and statistics of this paper haven’t been checked yet.
Run the check — free, no account needed. It reads the open-access text and checks the sources it cites.
Integrity signals
Registry
Cites
Statistics
Figures
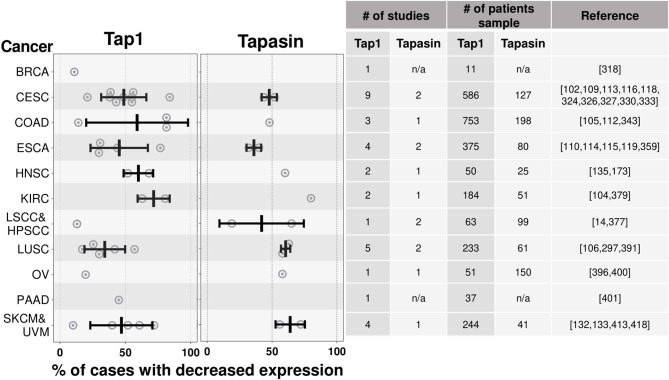
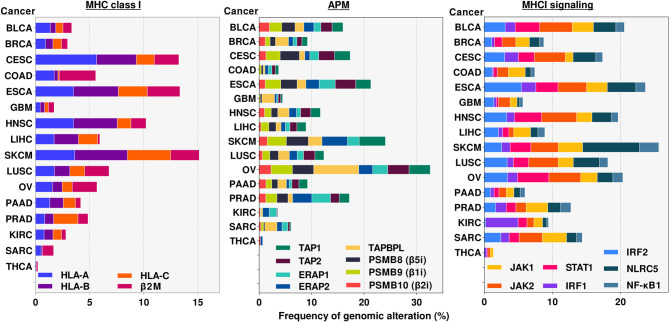
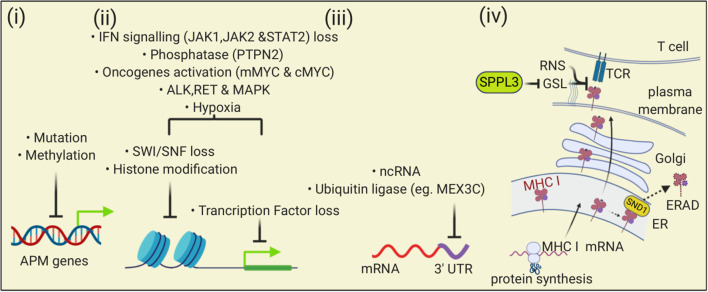
Verification
Claims the paper makes
The claims and statistics of this paper haven’t been checked yet.
Run the check — free, no account needed. It reads the open-access text and checks the sources it cites.
Claims other papers make about this one
Each is checked against this paper’s own text: does it say what the citing paper says it does?
The cited source doesn’t support the claim as written.
In the citing paper
“Desirable biocompatibility of natural scaffolds is primarily ascribed to the inter- and intra-species conservation of ECM [27] and its MHC-free nature that makes the host immune system recognize them as self-components [28].”
From Immunogenicity of decellularized extracellular matrix scaffolds: a bottleneck in tissue engineering and regenerative medicine (2023) · cites this paper as [28]
Checked by a reasoning model — may be wrong.
Experimental — accuracy not yet measuredThe source backs part of the claim, not all of it — or backs it for a different population, condition or comparison.
In the citing paper
“However, immune evasion can also occur by loss of the required HLA allele or defects in the HLA presentation pathway, although this is less common in GBM than other tumour types [40].”
From Preclinical development of an mRNA-based multiepitope immunotherapeutic for glioblastoma (2025) · cites this paper as [40]
Experimental — accuracy not yet measured
Self-check
Percentages, sums and reported differences re-computed from the paper’s own numbers.
The self-check needs the paper’s full text.
Citations
Cites
Items 201–400 of 423
Tapasin-related protein TAPBPR is an additional component of the MHC class I presentation pathway
Boyle, L. H., Hermann, C., Boname, J. M., Porter, K. M., Patel, P. A., Burr, M. L., Duncan, L. M., Harbour, M. E., Rhodes, D. A., Skjødt, K., et al. (2013) · Proceedings of the National Academy of Sciences · doi:10.1073/pnas.1222342110 · Cited by 125
Kostine, M., Cleven, A. H. G., de Miranda, N. F. C. C., Italiano, A., Cleton-Jansen, A., & Bovée, J. V. M. G. (2016) · Modern Pathology · doi:10.1038/modpathol.2016.108 · Cited by 125
Genetics of antigen processing and presentation
Kelly, A. P., & Trowsdale, J. (2018) · Immunogenetics · doi:10.1007/s00251-018-1082-2 · Cited by 119
Complex pattern of immune evasion in MSI colorectal cancer
Özcan, M., Janikovits, J., Doeberitz, M. V. K., & Kloor, M. (2018) · OncoImmunology · doi:10.1080/2162402x.2018.1445453 · Cited by 118
Knox, T. J., Sahakian, E., Banik, D., Hadley, M. M., Palmer, E., Noonepalle, S. K. R., Kim, J. S., Powers, J. J., Gracia-Hernandez, M., Oliveira, V. A., et al. (2019) · Scientific Reports · doi:10.1038/s41598-019-51403-6 · Cited by 118
Schoenhals, G. J., Krishna, R. M., Grandea, A. G., Spies, T. A., Peterson, P. A., Yang, Y. D., & Früh, K. (1999) · The EMBO Journal · doi:10.1093/emboj/18.3.743 · Cited by 117
Low-dose IFN-gamma induces tumor MHC expression in metastatic malignant melanoma.
PROPPER, D. J., Chao, D., Braybrooke, J. P., Bahl, P., Thavasu, P., Balkwill, F. R., Turley, H., Dobbs, N. A., Gatter, K. C., Talbot, D. C., et al. (2003) · PubMed · Cited by 115
Ferris, R. L., Hunt, J. L., & Ferrone, S. (2005) · Immunologic Research · doi:10.1385/ir:33:2:113 · Cited by 115
Implication of the β2-microglobulin gene in the generation of tumor escape phenotypes
Bernal, M., Ruiz‐Cabello, F., Concha, Á., Paschen, A., & Garrido, F. (2012) · Cancer Immunology Immunotherapy · doi:10.1007/s00262-012-1321-6 · Cited by 114
Kriegsman, B. A., Vangala, P., Chen, B. J., Meraner, P., Brass, A. L., Garber, M., & Rock, K. L. (2019) · The Journal of Immunology · doi:10.4049/jimmunol.1900475 · Cited by 114
Self-citationPandha, H., Rigg, A. S., John, J., & Lemoine, N. R. (2007) · Clinical & Experimental Immunology · doi:10.1111/j.1365-2249.2006.03289.x · Cited by 113
Kikuchi, E., Yamazaki, K., Torigoe, T., Cho, Y., Miyamoto, M., Oizumi, S., Hommura, F., Dosaka‐Akita, H., & Nishimura, M. (2007) · Cancer Science · doi:10.1111/j.1349-7006.2007.00558.x · Cited by 113
Seliger, B., Atkins, D., Bock, M., Ritz, U., Ferrone, S., Huber, C., & Störkel, S. (2003) · PubMed · Cited by 113
Vitale, M., Pelusi, G., Taroni, B., Gobbi, G., Micheloni, C., Rezzani, R., Donato, F., Wang, X., & Ferrone, S. (2005) · Clinical Cancer Research · doi:10.1158/1078-0432.67.11.1 · Cited by 113
de Kruijf, E. M., van Nes, J. G. H., Sajet, A., Tummers, Q. R. J. G., Putter, H., Osanto, S., Speetjens, F. M., Smit, V. T. H. B. M., Liefers, G., van de Velde, C. J. �., et al. (2010) · Clinical Cancer Research · doi:10.1158/1078-0432.ccr-09-1844 · Cited by 113
Endogenous T cells prevent tumor immune escape following adoptive T cell therapy
Walsh, S. R., Simovic, B., Chen, L., Bastin, D. J., Nguyen, A., Stephenson, K. B., Mandur, T. S., Bramson, J. L., Lichty, B. D., & Wan, Y. (2019) · Journal of Clinical Investigation · doi:10.1172/jci126199 · Cited by 113
Dierssen, J. W. F., de Miranda, N. F. C. C., Ferrone, S., van Puijenbroek, M., Cornelisse, C. J., Fleuren, G. J., van Wezel, T., & Morreau, H. M. (2007) · BMC Cancer · doi:10.1186/1471-2407-7-33 · Cited by 112
Natural killer cells infiltrating colorectal cancer and MHC class I expression
Sandel, M. H., Speetjens, F. M., Menon, A. G., Albertsson, P., Basse, P. H., Hokland, M., Nagelkerke, J. F., Tollenaar, R. A. E. M., van de Velde, C. J. �., & Kuppen, P. J. K. (2004) · Molecular Immunology · doi:10.1016/j.molimm.2004.07.039 · Cited by 112
Maleno, I., López‐Nevot, M. Á., Cabrera, T., Jose, S., & Garrido, F. (2002) · Cancer Immunology Immunotherapy · doi:10.1007/s00262-002-0296-0 · Cited by 111
TAP1 down-regulation elicits immune escape and poor prognosis in colorectal cancer
Ling, A., Löfgren‐Burström, A., Larsson, P. G., Li, X., Wikberg, M. L., Öberg, Å., Stenling, R., Edin, S., & Palmqvist, R. (2017) · OncoImmunology · doi:10.1080/2162402x.2017.1356143 · Cited by 110
Association of HLA class I and class II antigen expression and mortality in uveal melanoma.
Ericsson, C., Seregard, S., Bartolazzi, A., Levitskaya, E., Ferrone, S., Kiessling, R. W., & Larsson, O. (2001) · PubMed · Cited by 109
Expression of HLA Class I Antigen, Aspirin Use, and Survival After a Diagnosis of Colon Cancer
Reimers, M. S., Bastiaannet, E., Langley, R. E., van Eijk, R., van Vlierberghe, R. L. P., Lemmens, V. E. P. P., van Herk‐Sukel, M. P. P., van Wezel, T., Fodde, R., Kuppen, P. J. K., et al. (2014) · JAMA Internal Medicine · doi:10.1001/jamainternmed.2014.511 · Cited by 109
Chang, C., Hammer, J., Loh, J. E., Fodor, W. L., & Flavell, R. (1992) · Immunogenetics · doi:10.1007/bf00179793 · Cited by 109
HLA and proteasome expression body map
Boegel, S., Löwer, M., Bukur, T., Sorn, P., Castle, J. C., & Şahin, U. (2018) · BMC Medical Genomics · doi:10.1186/s12920-018-0354-x · Cited by 108
Cutting Edge: Impaired MHC Class I Expression in Mice Deficient for Nlrc5/Class I Transactivator
Biswas, A., Meissner, T. B., Kawai, T., & Kobayashi, K. S. (2012) · The Journal of Immunology · doi:10.4049/jimmunol.1200064 · Cited by 106
The SPPL3-Defined Glycosphingolipid Repertoire Orchestrates HLA Class I-Mediated Immune Responses
Jongsma, M. L. M., de Waard, A. A., Raaben, M., Zhang, T., Cabukusta, B., Platzer, R., Blomen, V. A., Xagara, A., Verkerk, T., Bliss, S., et al. (2020) · Immunity · doi:10.1016/j.immuni.2020.11.003 · Cited by 105
ERp57 Modulates STAT3 Signaling from the Lumen of the Endoplasmic Reticulum
Coe, H., Jung, J., Groenendyk, J., Prins, D., & Michalak, M. (2009) · Journal of Biological Chemistry · doi:10.1074/jbc.m109.054015 · Cited by 103
Wagner, S. N., Rebmann, V., Willers, C. P., Grosse‐Wilde, H., & Goos, M. (2000) · The Lancet · doi:10.1016/s0140-6736(00)02486-7 · Cited by 103
Human Leukocyte Antigen–G and Cancer Immunoediting
Urosevic, M., & Dummer, R. (2008) · Cancer Research · doi:10.1158/0008-5472.can-07-2704 · Cited by 101
Atkins, D., Ferrone, S., Schmahl, G. E., Störkel, S., & Seliger, B. (2004) · The Journal of Urology · doi:10.1097/01.ju.0000094807.95420.fe · Cited by 99
Grandis, J. R., Falkner, D. H., Melhem, M. F., Gooding, W. E., Drenning, S. D., & Morel, P. A. (2000) · PubMed · Cited by 99
Lorenzi, S., Forloni, M., Cifaldi, L., Antonucci, C., Citti, A., Boldrini, R., Pezzullo, M., Castellano, A., Russo, V. E. A., van der Bruggen, P., et al. (2012) · PLoS ONE · doi:10.1371/journal.pone.0046928 · Cited by 98
Ramnath, N., Tan, D. S. W., Li, Q., Hylander, B. L., Bogner, P. N., Ryes, L., & Ferrone, S. (2005) · Cancer Immunology Immunotherapy · doi:10.1007/s00262-005-0085-7 · Cited by 98
Seliger, B., Stoehr, R., Handke, D., Müeller, A., Ferrone, S., Wullich, B., Tannapfel, A., Hofstaedter, F., & Hartmann, A. (2009) · Cancer Immunology Immunotherapy · doi:10.1007/s00262-009-0769-5 · Cited by 98
Feenstra, M., Veltkamp, M., van Kuik, J., Wiertsema, S. P., Slootweg, P. J., van den Tweel, J. G., de Weger, R. A., & Tilanus, M. G. J. (1999) · Tissue Antigens · doi:10.1034/j.1399-0039.1999.540304.x · Cited by 98
The transporter associated with antigen processing: a key player in adaptive immunity
Eggensperger, S., & Tampé, R. (2015) · Biological Chemistry · doi:10.1515/hsz-2014-0320 · Cited by 97
Kaklamanis, L., Townsend, A., Doussis-Anagnostopoulou, I. A., Mortensen, N. J. M., Harris, A. L., & Gatter, K. C. (1994) · PubMed Central · Cited by 97
Chang, C., Campoli, M. R., Restifo, N. P., Wang, X., & Ferrone, S. (2005) · The Journal of Immunology · doi:10.4049/jimmunol.174.3.1462 · Cited by 95
Maleno, I., Cabrera, C., Cabrera, T., Paco, L., López‐Nevot, M. Á., Collado, A., Ferr�n, A., & Garrido, F. (2004) · Immunogenetics · doi:10.1007/s00251-004-0692-z · Cited by 93
The MAPK Pathway Is a Predominant Regulator of HLA-A Expression in Esophageal and Gastric Cancer
Mimura, K., Shiraishi, K., Mueller, A., Izawa, S., Kua, L., So, J., Yong, W., Fujii, H., Seliger, B., Kiessling, R., et al. (2013) · Journal of Immunology · doi:10.4049/jimmunol.1301597 · Cited by 92
Seliger, B., Höhne, A., Knuth, A. K., Bernhard, H., Ehring, B., Tampé, R., & Huber, C. G. (1996) · PubMed · Cited by 91
Maeurer, M. J., Gollin, S. M., Storkus, W. J., Swaney, W. P., Karbach, J., Martin, D., Castelli, C., Salter, R. D., Knuth, A., & Lotze, M. T. (1996) · PubMed · Cited by 91
Mari, L., Hoefnagel, S. J. M., Zito, D., van de Meent, M., Endert, P. V., Calpe, S., Sancho‐Serra, M. D. C., Heemskerk, M. H. M., van Laarhoven, H. W. M., Hulshof, M. C. C. M., et al. (2018) · Gastroenterology · doi:10.1053/j.gastro.2018.06.030 · Cited by 91
Almeida, L., Dhillon-LaBrooy, A., Castro, C. N., Adossa, N. A., Carriche, G. M., Guderian, M., Lippens, S., Dennerlein, S., Hesse, C., Lambrecht, B. N., et al. (2020) · Immunity · doi:10.1016/j.immuni.2020.11.001 · Cited by 91
Histocompatibility antigens in primary and metastatic squamous cell carcinoma of the larynx
Esteban, F., Concha, Á., Huelin, C., Perez‐Ayala, M., Pedrinaci, S., Ruiz‐Cabello, F., & Garrido, F. (1989) · International Journal of Cancer · doi:10.1002/ijc.2910430316 · Cited by 90
Defective HLA class I antigen processing machinery in cancer
Cai, L., Michelakos, T. P., Yamada, T., Fan, S., Wang, X., Schwab, J. H., Ferrone, C. R., & Ferrone, S. (2018) · Cancer Immunology Immunotherapy · doi:10.1007/s00262-018-2131-2 · Cited by 89
Burrack, A. L., Spartz, E. J., Raynor, J. F., Wang, I., Olson, M. A., & Stromnes, I. M. (2019) · Cell Reports · doi:10.1016/j.celrep.2019.07.059 · Cited by 89
Colangelo, T., Polcaro, G., Ziccardi, P., Pucci, B., Muccillo, L., Galgani, M., Fucci, A., Milone, M. R., Budillon, A., Santopaolo, M., et al. (2016) · Cell Death and Disease · doi:10.1038/cddis.2016.28 · Cited by 88
Pedersen, M. H., Hood, B. L., Beck, H. C., Conrads, T. P., Ditzel, H. J., & Leth‐Larsen, R. (2017) · OncoImmunology · doi:10.1080/2162402x.2017.1305531 · Cited by 88
Lou, Y., Vitalis, T. Z., Basha, G., Cai, B., Chen, S. S., Choi, K. B., Jeffries, A. P., Elliott, W. M., Atkins, D., Seliger, B., et al. (2005) · Cancer Research · doi:10.1158/0008-5472.can-04-3977 · Cited by 87
Reimers, M. S., Engels, C. C., Putter, H., Morreau, H., Liefers, G., van de Velde, C. J., & Kuppen, P. J. K. (2014) · BMC Cancer · doi:10.1186/1471-2407-14-486 · Cited by 87
Phase Ib/II Study of Pembrolizumab and Pegylated-Interferon Alfa-2b in Advanced Melanoma
Davar, D., Wang, H., Chauvin, J.-M., Pagliano, O., Fourcade, J. J., Ka, M., Menna, C., Rose, A., Sander, C., Borhani, A. A., et al. (2018) · Journal of Clinical Oncology · doi:10.1200/jco.18.00632 · Cited by 86
ERAP1–ERAP2 Dimerization Increases Peptide-Trimming Efficiency
Evnouchidou, I., Weimershaus, M., Saveanu, L., & Endert, P. V. (2014) · The Journal of Immunology · doi:10.4049/jimmunol.1302855 · Cited by 85
Marijt, K. A., Sluijter, M., Blijleven, L., Tolmeijer, S. H., Scheeren, F. A., van der Burg, S. H., & van Hall, T. (2019) · Journal for ImmunoTherapy of Cancer · doi:10.1186/s40425-019-0627-8 · Cited by 85
The RNA‐binding E3 ubiquitin ligase MEX‐3C links ubiquitination with MHC‐I mRNA degradation
Cano, F., Bye, H., Duncan, L. M., Buchet-Poyau, K., Billaud, M., Wills, M. R., & Lehner, P. J. (2012) · The EMBO Journal · doi:10.1038/emboj.2012.218 · Cited by 84
Ogino, T., Bandoh, N., Hayashi, T., Miyokawa, N., Harabuchi, Y., & Ferrone, S. (2003) · PubMed · Cited by 84
Ugurel, S., Spassova, I., Wohlfarth, J., Drusio, C., Cherouny, A., Melior, A., Sucker, A., Zimmer, L., Ritter, C., Schadendorf, D., et al. (2019) · Cancer Immunology Immunotherapy · doi:10.1007/s00262-019-02341-9 · Cited by 84
Maleno, I., Aptsiauri, N., Cabrera, T., Gallego, Á. O., Paschen, A., López‐Nevot, M. Á., & Garrido, F. (2010) · Immunogenetics · doi:10.1007/s00251-010-0494-4 · Cited by 81
Mizukami, Y., Kono, K., Maruyama, T., Watanabe, M., Kawaguchi, Y., Kamimura, K., & Fujii, H. (2008) · British Journal of Cancer · doi:10.1038/sj.bjc.6604715 · Cited by 80
Kabawat, S. E., Bast, R. C., Welch, W. R., KNAPP, R. C., & Bhan, A. K. (1983) · International Journal of Cancer · doi:10.1002/ijc.2910320505 · Cited by 80
TAP1 down-regulation in primary melanoma lesions: An independent marker of poor prognosis
Kamarashev, J. A., Ferrone, S., Seifert, B., B�ni, R., Nestle, F. O., Burg, G., & Dummer, R. (2001) · International Journal of Cancer · doi:10.1002/1097-0215(20010120)95:1 · Cited by 79
Histone Deacetylase Inhibition Sensitizes PD1 Blockade–Resistant B-cell Lymphomas
Wang, X., Waschke, B. C., Woolaver, R. A., Chen, Z., Zhang, G., Piscopio, A. D., Liu, X., & Wang, J. H. (2019) · Cancer Immunology Research · doi:10.1158/2326-6066.cir-18-0875 · Cited by 77
Redondo, M., Concha, Á., Oldiviela, R., Cueto, A., Gonzalez, A., Garrido, F., & Ruiz‐Cabello, F. (1991) · PubMed · Cited by 75
Perforinopathy: A Spectrum of Human Immune Disease Caused by Defective Perforin Delivery or Function
Voskoboinik, I., & Trapani, J. A. (2013) · Frontiers in Immunology · doi:10.3389/fimmu.2013.00441 · Cited by 75
Mora‐García, M. D. L., Dueñas‐González, A., Hernández‐Montes, J., la Cruz-Hernández, E. N. D., Pérez‐Cárdenas, E., Weiss‐Steider, B., Santiago‐Osorio, E., Ortiz-Navarrete, V. F., Rosales, V. H., de León, D. F. C., et al. (2006) · Journal of Translational Medicine · doi:10.1186/1479-5876-4-55 · Cited by 72
Lee, C., Gimeno, R., & Levy, D. E. (1999) · The Journal of Experimental Medicine · doi:10.1084/jem.190.10.1451 · Cited by 72
Innate Immune Recognition and Suppression of Tumors
Hayakawa, Y., & Smyth, M. J. (2006) · Advances in cancer research · doi:10.1016/s0065-230x(06)95008-8 · Cited by 71
Kooi, S., Zhang, H., Patenia, R. S., Edwards, C. L., Platsoucas, C. D., & Freedman, R. S. (1996) · Cellular Immunology · doi:10.1006/cimm.1996.0301 · Cited by 71
Covre, A., Coral, S., Nicolay, H. J. M., Parisi, G., Fazio, C., Colizzi, F., Fratta, E., Giacomo, A. M. D., Sigalotti, L., Natali, P. G., et al. (2015) · OncoImmunology · doi:10.1080/2162402x.2015.1019978 · Cited by 71
Veer, L. J. V., Beijersbergen, R. L., & Bernards, R. (1993) · The EMBO Journal · doi:10.1002/j.1460-2075.1993.tb05645.x · Cited by 71
Perforin deficiency and susceptibility to cancer
Brennan, A. J., Chia, J., Trapani, J. A., & Voskoboinik, I. (2010) · Cell Death and Differentiation · doi:10.1038/cdd.2009.212 · Cited by 69
Chang, C., Pirozzi, G., Wen, S.-H., Chung, I.-H., Chiu, B.-L., Errico, S., Luongo, M., Lombardi, M. L., & Ferrone, S. (2015) · Journal of Biological Chemistry · doi:10.1074/jbc.m115.676130 · Cited by 69
Ito, S., Okano, S., Morita, M., Saeki, H., Tsutsumi, S., Tsukihara, H., Nakashima, Y., Ando, K., Imamura, Y., Ohgaki, K., et al. (2016) · Annals of Surgical Oncology · doi:10.1245/s10434-016-5376-z · Cited by 68
Shionoya, Y., Kanaseki, T., Miyamoto, S., Tokita, S., Hongo, A., Kikuchi, Y., Kochin, V., Watanabe, K., Horibe, R., Saijo, H., et al. (2017) · OncoImmunology · doi:10.1080/2162402x.2016.1274476 · Cited by 68
Stratikos, E., Stamogiannos, A., Zervoudi, E., & Fruci, D. (2014) · Frontiers in Oncology · doi:10.3389/fonc.2014.00363 · Cited by 67
Kasajima, A., Sers, C., Sasano, H., Jöhrens, K., Stenzinger, A., Noske, A., Buckendahl, A., Darb‐Esfahani, S., Müller, B. M., Budczies, J., et al. (2010) · Human Pathology · doi:10.1016/j.humpath.2010.05.014 · Cited by 66
Kitamura, H., Torigoe, T., Asanuma, H., Honma, I., Sato, N., & Tsukamoto, T. (2007) · The Journal of Urology · doi:10.1016/j.juro.2007.03.109 · Cited by 66
Elashi, A. A., Nair, V. S., Taha, R. Z., Shaath, H., & Elkord, E. (2018) · OncoImmunology · doi:10.1080/2162402x.2018.1542918 · Cited by 66
Noncoding RNAs: the shot callers in tumor immune escape
Liu, L., Wang, Q., Qiu, Z., Kang, Y., Liu, J., Ning, S., Yin, Y., Pang, D., & Xu, S. (2020) · Signal Transduction and Targeted Therapy · doi:10.1038/s41392-020-0194-y · Cited by 66
Ye, Q., Shen, Y., Wang, X., Yang, J., Miao, F., Shen, C., & Zhang, J. (2009) · Tissue Antigens · doi:10.1111/j.1399-0039.2009.01390.x · Cited by 65
Goes, N. B., Sims, T. N., Urmson, J. R., Vincent, D., Ramassar, V., & Halloran, P. F. (1995) · The Journal of Immunology · doi:10.4049/jimmunol.155.10.4559 · Cited by 64
Rolland, P., Deen, S., Scott, I., Durrant, L. G., & Spendlove, I. (2007) · Clinical Cancer Research · doi:10.1158/1078-0432.ccr-06-2087 · Cited by 62
Lack of MHC class I antigens and tumour aggressiveness of the squamous cell carcinoma of the larynx
Esteban, F., Concha, Á., Delgado‐Rodríguez, M., Perez‐Ayala, M., Ruiz‐Cabello, F., & Garrido, F. (1990) · British Journal of Cancer · doi:10.1038/bjc.1990.437 · Cited by 61
Jang, M., Yew, P., Hasegawa, K., Ikeda, Y., Fujiwara, K., Fleming, G. F., Nakamura, Y., & Park, J.-H. (2015) · OncoImmunology · doi:10.1080/2162402x.2015.1030561 · Cited by 60
Loss of HLA class‐I alleles, heavy chains and β2‐microglobulin in colorectal cancer
Kaklamanis, L., Gatter, K. C., Hill, A. B., Mortensen, N., Harris, A. L., Krausa, P., McMichael, A. J., Bodmer, J. G., & Bodmer, W. F. (1992) · International Journal of Cancer · doi:10.1002/ijc.2910510308 · Cited by 60
T cell recognition of HLA‐A2 restricted tumor antigens is impaired by the oncogene HER2
Mimura, K., Ando, T., Poschke, I., Mougiakakos, D., Johansson, C. C., Ichikawa, J., Okita, R., Nishimura, M., Handke, D., Krug, N., et al. (2011) · International Journal of Cancer · doi:10.1002/ijc.25613 · Cited by 60
Mariya, T., Hirohashi, Y., Torigoe, T., Asano, T., Kuroda, T., Yasuda, K., Mizuuchi, M., Sonoda, T., Saito, T., & Sato, N. (2014) · Cancer Immunology Research · doi:10.1158/2326-6066.cir-14-0101 · Cited by 60
Torigoe, T., Asanuma, H., Nakazawa, E., Tamura, Y., Hirohashi, Y., Yamamoto, E. M., Kanaseki, T., Hasegawa, T., & Sato, N. (2012) · Pathology International · doi:10.1111/j.1440-1827.2012.02789.x · Cited by 59
Erlich, H., Lee, J. S., Petersen, J. W., Bugawan, T. L., & DeMars, R. (1986) · Human Immunology · doi:10.1016/0198-8859(86)90049-2 · Cited by 59
Association of immunoescape mechanisms with Epstein‐Barr virus infection in nasopharyngeal carcinoma
Ogino, T., Moriai, S., Ishida, Y., Ishii, H., Katayama, A., Miyokawa, N., Harabuchi, Y., & Ferrone, S. (2007) · International Journal of Cancer · doi:10.1002/ijc.22334 · Cited by 59
Vora, A., Rodgers, S., Parker, A., Start, R. D., Rees, R. C., & Murray, A. (1997) · British Journal of Cancer · doi:10.1038/bjc.1997.472 · Cited by 59
Sun, T., Li, Y., Yang, W., Wu, H., Li, X., Huang, Y.-L., Zhou, Y., & Du, Z. (2019) · Journal of Cancer · doi:10.7150/jca.34471 · Cited by 59
Rodrı́guez, J. A., Galeano, L., Palacios, D. M., Gómez, C., Serrano, M. L., Bravo, M. M., & Cómbita, A. L. (2011) · Pathobiology · doi:10.1159/000334089 · Cited by 58
Hasim, A., Abudula, M., Aimiduo, R., Ma, J., Jiao, Z., Akula, G., Wang, T., & Abudula, A. (2012) · PLoS ONE · doi:10.1371/journal.pone.0044952 · Cited by 58
LOH at 6p21.3 region and HLA class altered phenotypes in bladder carcinomas
Maleno, I., Romero, J. M., Cabrera, T., Paco, L., Aptsiauri, N., Cózar, J. M., Tallada, M., López‐Nevot, M. Á., & Garrido, F. (2006) · Immunogenetics · doi:10.1007/s00251-006-0111-8 · Cited by 57
The Expression of Histocompatibility-related Leukocyte Antigens in the Pathway to Cervical Carcinoma
Hilders, C. G. J. M., Houbiers, J. G. A., Krul, E. J. T., & Fleuren, G. J. (1994) · American Journal of Clinical Pathology · doi:10.1093/ajcp/101.1.5 · Cited by 57
Elevated expression of SerpinA1 and SerpinA3 in HLA‐positive cervical carcinoma
Kloth, J. N., Gorter, A., Fleuren, G. J., Oosting, J., Kolkman-Uljee, S. M., ter Haar, N. T., Dreef, E., Kenter, G. G., & Jordanova, E. S. (2008) · The Journal of Pathology · doi:10.1002/path.2347 · Cited by 56
Differential modulation and prognostic values of immune-escape genes in uveal melanoma
Basile, M. S., Mazzon, E., Russo, A., Mammana, S., Longo, A., Bonfiglio, V. M. E., Fallico, M., Caltabiano, R., Fagone, P., Nicoletti, F., et al. (2019) · PLoS ONE · doi:10.1371/journal.pone.0210276 · Cited by 56
Zhang, X., Lin, A., Zhang, J. ‐., Bao, W. ‐., Xu, D., Ruan, Y., & Yan, W. (2012) · International Journal of Cancer · doi:10.1002/ijc.27621 · Cited by 55
Carretero, R., Cabrera, T., Gil-Julio, H., Sáenz-López, P., Maleno, I., Aptsiauri, N., Cozar, J. M., & Garrido, F. (2010) · International Journal of Cancer · doi:10.1002/ijc.25733 · Cited by 55
Clinical impact of HLA class I expression in rectal cancer
Speetjens, F. M., de Bruin, E. C., Morreau, H. M., Zeestraten, E. C. M., Putter, H., van Krieken, J. H., van Buren, M. M., van Velzen, M., Dekker-Ensink, N. G., van de Velde, C. J. �., et al. (2007) · Cancer Immunology Immunotherapy · doi:10.1007/s00262-007-0396-y · Cited by 54
Loss of tapasin correlates with diminished CD8+ T-cell immunity and prognosis in colorectal cancer
Sokol, L., Koelzer, V. H., Rau, T. T., Karamitopoulou, E., Zlobec, I., & Lugli, A. (2015) · Journal of Translational Medicine · doi:10.1186/s12967-015-0647-1 · Cited by 54
Major histocompatibility complex status in breast carcinogenesis and relationship to apoptosis
Redondo, M., Garcı́a, J., Villar, E., Rodrigo, I., Perea‐Milla, E., Serrano, A., & Morell, M. (2003) · Human Pathology · doi:10.1016/j.humpath.2003.06.001 · Cited by 54
Targeting HLA class I expression to increase tumor immunogenicity
Campo, A. B., Carretero, J., Aptsiauri, N., & Garrido, F. (2012) · Tissue Antigens · doi:10.1111/j.1399-0039.2011.01831.x · Cited by 53
Zhang, H., Melamed, J., Wei, P., Cox, K., Frankel, W. L., Bahnson, R. R., Robinson, N., Pyka, R., Liu, Y., & Zheng, P. (2003) · PubMed · Cited by 52
Garrido, M. A., Rodríguez, T., Zinchenko, S. P., Maleno, I., Ruiz‐Cabello, F., Concha, Á., Olea, N., Garrido, F., & Aptsiauri, N. (2018) · Immunogenetics · doi:10.1007/s00251-018-1074-2 · Cited by 52
Wang, Y., Wang, X., Cui, X., Zhuo, Y., Li, H., Ha, C., Xin, L., Ren, Y., Zhang, W., Sun, X., et al. (2020) · Science Advances · doi:10.1126/sciadv.aba5412 · Cited by 52
van den Elsen, P. J., Holling, T. M., van der Stoep, N., & Boss, J. M. (2003) · Clinical Immunology · doi:10.1016/s1521-6616(03)00200-6 · Cited by 51
Koelzer, V. H., Dawson, H., Andersson, E. K., Karamitopoulou, E., Masucci, G. V., Lugli, A., & Zlobec, I. (2015) · Translational research · doi:10.1016/j.trsl.2015.02.008 · Cited by 50
Carretero, F., Campo, A. B., Flores-Martín, J. F., Méndez, R., García-López, C., Cózar, J. M., Adams, V., Ward, S., Cabrera, T., Ruiz‐Cabello, F., et al. (2015) · Cancer Immunology Immunotherapy · doi:10.1007/s00262-015-1774-5 · Cited by 50
Yoo, S. H., Keam, B., Ock, C.-Y., Kim, S., Han, B., Kim, J., Lee, K., Jeon, Y. K., Jung, K. C., Chung, E., et al. (2019) · Scientific Reports · doi:10.1038/s41598-019-44206-2 · Cited by 49
High frequency of altered HLA class I phenotypes in laryngeal carcinomas
Cabrera, T., Jose, S., Fernandez, M. A., Garrido, A., Esquivias, J., & Garrido, F. (2000) · Human Immunology · doi:10.1016/s0198-8859(00)00097-5 · Cited by 48
Wintzer, H.-O., Benzing, M., & von Kleist, S. (1990) · British Journal of Cancer · doi:10.1038/bjc.1990.280 · Cited by 48
Tanaka, K., Tsuchikawa, T., Miyamoto, M., Maki, T., Ichinokawa, M., Kubota, K., Shichinohe, T., Hirano, S., Ferrone, S., Dosaka‐Akita, H., et al. (2011) · International Journal of Oncology · doi:10.3892/ijo.2011.1274 · Cited by 48
ERAAP Shapes the Peptidome Associated with Classical and Nonclassical MHC Class I Molecules
Nagarajan, N. A., de Verteuil, D. A., Sriranganadane, D., Yahyaoui, W., Thibault, P., Perreault, C., & Shastri, N. (2016) · The Journal of Immunology · doi:10.4049/jimmunol.1500654 · Cited by 48
Moon, W. Y., & Powis, S. J. (2019) · Frontiers in Immunology · doi:10.3389/fimmu.2019.01703 · Cited by 48
Saito, T., Tanaka, R., Yoshida, S., Washiyama, K., & Kumanishi, T. (1988) · Surgical Neurology · doi:10.1016/0090-3019(88)90137-1 · Cited by 47
Oh, C. Y., Klatt, M. G., Bourne, C. M., Dao, T., Dacek, M. M., Brea, E. J., Mun, S. S., Chang, A. Y., Korontsvit, T., & Scheinberg, D. A. (2019) · Cancer Immunology Research · doi:10.1158/2326-6066.cir-19-0056 · Cited by 46
Li, H., Xiong, H., Xiao, Y., Yang, Q., Yang, S., Tang, H., Zhang, W., & Sun, Z. (2020) · Frontiers in Oncology · doi:10.3389/fonc.2020.00615 · Cited by 46
HLA class I phenotype and genotype alterations in cervical carcinomas and derivative cell lines
Koopman, L. A., Mulder, A., Corver, W. E., Anholts, J. D. H., Giphart, M. J., Claas, F. H. J., & Fleuren, G. J. (1998) · Tissue Antigens · doi:10.1111/j.1399-0039.1998.tb03005.x · Cited by 45
An epigenetic vaccine model active in the prevention and treatment of melanoma
Khan, A. N. H., Magner, W. J., & Tomasi, T. B. (2007) · Journal of Translational Medicine · doi:10.1186/1479-5876-5-64 · Cited by 45
Erdoğdu, İ. H. (2019) · Gastroenterology Research and Practice · doi:10.1155/2019/4785098 · Cited by 44
Hafstrand, I., Sayitoğlu, E. C., Apavaloaei, A., Josey, B. J., Sun, R., Han, X. Y., Pellegrino, S., Özkazanç, D., Potens, R., Janssen, L., et al. (2019) · Proceedings of the National Academy of Sciences · doi:10.1073/pnas.1807656116 · Cited by 44
Smithy, J. W., Moore, L. M., Pelekanou, V., Rehman, J., Gaule, P., Wong, P. F., Neumeister, V. M., Sznol, M., Kluger, H. M., & Rimm, D. L. (2017) · Journal for ImmunoTherapy of Cancer · doi:10.1186/s40425-017-0229-2 · Cited by 43
Prognostic significance of HLA class I expression in Ewing's sarcoma family of tumors
Yabe, H., Tsukahara, T., Kawaguchi, S., Wada, T., Torigoe, T., Sato, N., Terai, C., Aoki, M., Hirose, S., Morioka, H., et al. (2010) · Journal of Surgical Oncology · doi:10.1002/jso.21829 · Cited by 41
Frequent HLA Class I Loss is an Early Event in Cervical Carcinogenesis
Vermeulen, C. F. W., Jordanova, E. S., Zomerdijk-Nooijen, Y. A., ter Haar, N. T., Peters, A. A. W., & Fleuren, G. J. (2005) · Human Immunology · doi:10.1016/j.humimm.2005.10.011 · Cited by 41
Inverse correlation of HER2 with MHC class I expression on oesophageal squamous cell carcinoma
Maruyama, T., Mimura, K., Sato, E., Watanabe, M., Mizukami, Y., Kawaguchi, Y., Ando, T., Kinouchi, H., Fujii, H., & Kono, K. (2010) · British Journal of Cancer · doi:10.1038/sj.bjc.6605772 · Cited by 41
Sandberg, J. K., Chambers, B. J., Kaer, L. V., Kärre, K., & Ljunggren, H. (1996) · European Journal of Immunology · doi:10.1002/eji.1830260203 · Cited by 41
Varied Role of Ubiquitylation in Generating MHC Class I Peptide Ligands
Wei, J., Zanker, D. J., Carluccio, A. R. D., Smelkinson, M. G., Takeda, K., Seedhom, M. O., Dersh, D., Gibbs, J. S., Yang, N., Jadhav, A., et al. (2017) · The Journal of Immunology · doi:10.4049/jimmunol.1602122 · Cited by 41
Campo, A. B., Aptsiauri, N., Méndez, R., Zinchenko, S. P., Vales, Á., Paschen, A., Ward, S., Ruiz‐Cabello, F., González‐Aseguinolaza, G., & Garrido, F. (2009) · Scandinavian Journal of Immunology · doi:10.1111/j.1365-3083.2009.02276.x · Cited by 40
Liu, Q., Hao, C., Su, P., & Shi, J. (2009) · Scandinavian Journal of Gastroenterology · doi:10.1080/00365520902998679 · Cited by 39
Lee, D., Gupta, J. D., Gaughan, C., Steffen, I., Tang, N., Luk, K., Qiu, X., Urisman, A., Fischer, N., Molinaro, R. J., et al. (2012) · PLoS ONE · doi:10.1371/journal.pone.0044954 · Cited by 39
Vlková, V., Štěpánek, I., Hrušková, V., Šenigl, F., Mayerová, V., Šrámek, M., Šímová, J., Bieblová, J., Indrová, M., Hejhal, T., et al. (2014) · Oncotarget · doi:10.18632/oncotarget.2222 · Cited by 39
Hanalıoğlu, D., Cağdaş, D. N., Özgür, T. T., van der Burg, M., Sanal, Ö., & Tezcan, İ. (2017) · Clinical Immunology · doi:10.1016/j.clim.2017.01.011 · Cited by 39
Mattijssen, V., Mulder, P. H. M. D., Schalkwijk, L., Manni, J. J., Hof-Grootenboer, B. E. V., & Ruiter, D. J. (1991) · International Journal of Cancer · doi:10.1002/ijc.2910470719 · Cited by 38
Association of Allele-Specific HLA Expression and Histopathologic Progression of Cervical Carcinoma
van Driel, W. J., Tjiong, M. Y., Hilders, C. G. J. M., Trimbos, B. J. B. M. Z., & Fleuren, G. J. (1996) · Gynecologic Oncology · doi:10.1006/gyno.1996.0186 · Cited by 37
Schrörs, B., Lübcke, S., Lennerz, V., Fatho, M., Bicker, A., Wölfel, C., Derigs, P., Hankeln, T., Schadendorf, D., Paschen, A., et al. (2017) · Oncotarget · doi:10.18632/oncotarget.16048 · Cited by 37
HLA class I expression in bladder carcinomas
Cabrera, T., Pedrajas, G., Cozar, J. M., Garrido, A., Vicente, J., Tallada, M., & Garrido, F. (2003) · Tissue Antigens · doi:10.1034/j.1399-0039.2003.00104.x · Cited by 36
Campo, A. B., Carretero, J., Muñoz, J. A., Zinchenko, S. P., Ruiz‐Cabello, F., González‐Aseguinolaza, G., Garrido, F., & Aptsiauri, N. (2014) · Cancer Gene Therapy · doi:10.1038/cgt.2014.32 · Cited by 35
Sato, H., Suzuki, Y., Ide, M., Katoh, T., Noda, S., Ando, K., Oike, T., Yoshimoto, Y., Okonogi, N., Mimura, K., et al. (2014) · PLoS ONE · doi:10.1371/journal.pone.0108122 · Cited by 35
Shehata, M., Mukherjee, A., Deen, S., Al‐Attar, A., Durrant, L. G., & Chan, S. Y. T. (2009) · British Journal of Cancer · doi:10.1038/sj.bjc.6605315 · Cited by 35
Tsuchikawa, T., Ikeda, H., Cho, Y., Miyamoto, M., Shichinohe, T., Hirano, S., & Kondo, S. (2011) · Clinical & Experimental Immunology · doi:10.1111/j.1365-2249.2010.04311.x · Cited by 34
Toquet, C. S., Jarry, A., Bou‐Hanna, C., Bach‐Ngohou, K., Denis, M. G., Mosnier, J., & LABOISSE, C. L. (2007) · Oncology Reports · doi:10.3892/or.17.5.1101 · Cited by 34
ERAAP and Tapasin Independently Edit the Amino and Carboxyl Termini of MHC Class I Peptides
Kanaseki, T., Lind, K. C., Escobar, H., Nagarajan, N. A., Reyes‐Vargas, E., Rudd, B., Rockwood, A. L., Kaer, L. V., Sato, N., Delgado, J. C., et al. (2013) · The Journal of Immunology · doi:10.4049/jimmunol.1301043 · Cited by 34
Lulli, D., Carbone, M. L., & Pastore, S. (2017) · International Journal of Molecular Sciences · doi:10.3390/ijms18102227 · Cited by 34
Creation of versatile cloning platforms for transgene expression and dCas9-based epigenome editing
Haldeman, J. M., Conway, A. E., Arlotto, M. E., Slentz, D. H., Muoio, D. M., Becker, T. C., & Newgard, C. B. (2018) · Nucleic Acids Research · doi:10.1093/nar/gky1286 · Cited by 34
Wu, Y., Li, J., Kaboli, P. J., Shen, J., Wu, X., Zhao, Y., Ji, H., Du, F., Zhou, Y., Wang, Y., et al. (2020) · Pharmacological Research · doi:10.1016/j.phrs.2020.104691 · Cited by 34
Hasim, A., Ma, H., Sheyhidin, I., Zhang, L., & Abudula, A. (2011) · PubMed · Cited by 33
Leffers, N., Lambeck, A. J. A., de Graeff, P., Bijlsma, A. Y., Daemen, T., van der Zee, A. G. J., & Nijman, H. W. (2008) · Gynecologic Oncology · doi:10.1016/j.ygyno.2008.04.043 · Cited by 33
New Insights Into the Role of Qa-2 and HLA-G Non-classical MHC-I Complexes in Malignancy
Silva, I. L. D., Montero-Montero, L., Ferreira, E. F., & Quintanilla, M. (2018) · Frontiers in Immunology · doi:10.3389/fimmu.2018.02894 · Cited by 33
Zeestraten, E. C. M., van Hoesel, A. Q., Speetjens, F. M., Menon, A. G., Putter, H., van de Velde, C. J. �., & Kuppen, P. J. K. (2011) · Cancer Microenvironment · doi:10.1007/s12307-011-0071-x · Cited by 32
Characterization of β2-microglobulin expression in different types of breast cancer
Li, K., Du, H., Lian, X., Yang, S., Chai, D., Wang, C., Yang, R., & Chen, X. (2014) · BMC Cancer · doi:10.1186/1471-2407-14-750 · Cited by 32
HLA Class I and Class II Antigen Expression on Squamous Cell Carcinoma of the Head and Neck
Houck, J. R., Sexton, F. M., & Zajdel, G. (1990) · Archives of Otolaryngology - Head and Neck Surgery · doi:10.1001/archotol.1990.01870100075016 · Cited by 32
Nouri, A., Smith, M., Crosby, D. L., & Oliver, R. T. D. (1990) · British Journal of Cancer · doi:10.1038/bjc.1990.338 · Cited by 32
MHC Intratumoral Heterogeneity May Predict Cancer Progression and Response to Immunotherapy
Romero, I., Garrido, C., Algarra, I., Chamorro, V., Collado, A., Garrido, F., & Garcia-Lora, A. M. (2018) · Frontiers in Immunology · doi:10.3389/fimmu.2018.00102 · Cited by 32
de Miranda, N. F. C. C., Nielsen, M., Pereira, D., van Puijenbroek, M., Vasen, H. F. A., Hes, F. J., van Wezel, T., & Morreau, H. M. (2009) · The Journal of Pathology · doi:10.1002/path.2569 · Cited by 31
Hanagiri, T., Shigematsu, Y., Shinohara, S., Takenaka, M., Oka, S., Chikaishi, Y., Nagata, Y., Baba, T., Uramoto, H., So, T., et al. (2013) · PubMed · Cited by 31
Yan, Y., Liang, Z., Du, Q., Yang, M., & Geller, D. A. (2016) · Oncology Reports · doi:10.3892/or.2016.4864 · Cited by 31
Maiorana, A., Cesinaro, A. M., Fano, R. A., & Collina, G. (1995) · Clinical & Experimental Metastasis · doi:10.1007/bf00144017 · Cited by 30
Altered HLA class I expression in non-small cell lung cancer is independent of c-myc activation
Redondo, M., Ruiz‐Cabello, F., Concha, Á., Cabrera, T., Perez‐Ayala, M., Oliva, M. R., & Garrido, F. (1992) · Lung Cancer · doi:10.1016/0169-5002(92)90236-d · Cited by 30
Bernal, M., García-Alcalde, F., Concha, Á., Cano, C., Blanco, A. J., Garrido, F., & Ruiz‐Cabello, F. (2011) · Cancer Immunology Immunotherapy · doi:10.1007/s00262-011-1147-7 · Cited by 29
The SPPL3-defined glycosphingolipid repertoire orchestrates HLA class I-mediated immune responses
Jongsma, M. L. M., de Waard, A. A., Raaben, M., Zhang, T., Cabukusta, B., Platzer, R., Blomen, V. A., Xagara, A., Verkerk, T., Bliss, S., et al. (2021) · Immunity · doi:10.1016/j.immuni.2021.01.016 · Cited by 29
Levin, I., Klein, T., Goldstein, J., Kuperman, O. J., Kanetti, J., & Klein, B. (1991) · Cancer · doi:10.1002/1097-0142(19911215)68:12 · Cited by 28
Tomita, Y., Matsumoto, Y., Nishiyama, T., & Fujiwara, M. (1990) · The Journal of Pathology · doi:10.1002/path.1711620209 · Cited by 28
Homma, I., Kitamura, H., Torigoe, T., Tanaka, T., Sato, E., Hirohashi, Y., Masumori, N., Sato, N., & Tsukamoto, T. (2009) · Cancer Science · doi:10.1111/j.1349-7006.2009.01329.x · Cited by 28
Rs56288038 (C/G) in 3'UTR of IRF-1 Regulated by MiR-502-5p Promotes Gastric Cancer Development
Wang, B., Yang, H., Shen, L., Wang, J., Pu, W., Chen, Z., Shen, X., Fu, J., & Zhuang, Z. (2016) · Cellular Physiology and Biochemistry · doi:10.1159/000452554 · Cited by 28
Durgeau, A., Virk, Y., Gros, G., Voilin, E., Corgnac, S., Djenidi, F., Salmon, J., Adam, J., de Montpréville, V., Validire, P., et al. (2018) · Nature Communications · doi:10.1038/s41467-018-07603-1 · Cited by 28
Yuan, J., Liu, S., Yu, Q., Lin, Y., Bi, Y., Wang, Y., & An, R. (2012) · Acta Histochemica · doi:10.1016/j.acthis.2012.11.002 · Cited by 27
Jiang, Q., Pan, H., Ye, D., Zhang, P., Zhong, L., & Zhang, Z. (2010) · Tumor Biology · doi:10.1007/s13277-010-0054-4 · Cited by 27
Kitamura, H., Torigoe, T., Honma, I., Asanuma, H., Nakazawa, E., Shimozawa, K., Hirohashi, Y., Sato, E., Sato, N., & Tsukamoto, T. (2006) · Urology · doi:10.1016/j.urology.2005.11.052 · Cited by 26
Lazaridou, M., Massa, C., Handke, D., Müeller, A., Friedrich, M., Subbarayan, K., Tretbar, S., Dummer, R., Koelblinger, P., & Seliger, B. (2020) · Journal of Clinical Medicine · doi:10.3390/jcm9092690 · Cited by 26
Buferne, M., Chasson, L., Grange, M., Mas, A., Arnoux, F., Bertuzzi, M., Naquet, P., Leserman, L., Schmitt‐Verhulst, A., & Auphan‐Anezin, N. (2015) · OncoImmunology · doi:10.4161/2162402x.2014.974959 · Cited by 25
MHC CLASS I AND II ANTIGENS ON GASTRIC CARCINOMAS AND AUTOLOGOUS MUCOSA
FERRON, A. D., Perez‐Ayala, M., Concha, Á., Cabrera, T., Redondo, M., Oliva, M. R., Ruiz‐Cabello, F., & Garrido, F. (1989) · International Journal of Immunogenetics · doi:10.1111/j.1744-313x.1989.tb00489.x · Cited by 25
Higher HLA class I expression in renal cell carcinoma than in autologous normal tissue
Sáenz-López, P., Gouttefangeas, C., Hennenlotter, J., Concha, Á., Maleno, I., Ruiz‐Cabello, F., zar, J. M. C., Tallada, M., Stenzl, A., Rammensee, H., et al. (2009) · Tissue Antigens · doi:10.1111/j.1399-0039.2009.01409.x · Cited by 24
Boesen, M., Svane, I. M., ENGEL, A. ‐., Rygaard, J., Thomsen, A. R., & Werdelin, O. (2000) · Clinical & Experimental Immunology · doi:10.1046/j.1365-2249.2000.01292.x · Cited by 24
Hage, F. E., Durgeau, A., & Mami‐Chouaib, F. (2013) · Annals of the New York Academy of Sciences · doi:10.1111/j.1749-6632.2012.06777.x · Cited by 24
Prognostic value of HLA class I expression in patients with colorectal cancer
Iwayama, Y., Tsuruma, T., Mizuguchi, T., Furuhata, T., TOYOTA, N., Matsumura, M., Torigoe, T., Sato, N., & Hirata, K. (2015) · World Journal of Surgical Oncology · doi:10.1186/s12957-015-0456-2 · Cited by 24
HLA‐class I expression in gastric cancer
Ishigami, S., Natsugoe, S., Nakajo, A., Arigami, T., Kitazono, M., Okumura, H., Matsumoto, M., Uchikado, Y., Setoyama, T., Sasaki, K., et al. (2008) · Journal of Surgical Oncology · doi:10.1002/jso.21029 · Cited by 24
Tumor intrinsic immunity related proteins may be novel tumor suppressors in some types of cancer
Xiong, D., Wang, Y., & You, M. (2019) · Scientific Reports · doi:10.1038/s41598-019-47382-3 · Cited by 24
Thuring, C., Follin, E., Geironson, L., Freyhult, E., Junghans, V., Harndahl, M. N., Buus, S., & Paulsson, K. M. (2015) · British Journal of Cancer · doi:10.1038/bjc.2015.297 · Cited by 23
High-resolution analysis of HLA class I alterations in colorectal cancer
Dierssen, J. W. F., de Miranda, N. F. C. C., Mulder, A., van Puijenbroek, M., Verduyn, W., Claas, F. H. J., van de Velde, C. J., Fleuren, G. J., Cornelisse, C. J., Corver, W. E., et al. (2006) · BMC Cancer · doi:10.1186/1471-2407-6-233 · Cited by 23
Hosch, S. B., Meyer, A. J., Schneider, C. G., Stoecklein, N. H., Prenzel, K., Pantel, K., Broelsch, C. E., & Izbicki, J. R. (1997) · Journal of Gastrointestinal Surgery · doi:10.1016/s1091-255x(97)80051-0 · Cited by 23
Clinical significance of HLA class I heavy chain expression in patients with gastric cancer
Ueda, Y., Ishikawa, K., Shiraishi, N., Yokoyama, S., & Kitano, S. (2008) · Journal of Surgical Oncology · doi:10.1002/jso.20985 · Cited by 23
Biochemical analysis of HLA class I subunits expression in breast cancer tissues
Pistillo, M. P., Nicolò, G., Salvi, S., Capanni, P., Perdelli, L., Pasciucco, G., & Ferrara, G. B. (2000) · Human Immunology · doi:10.1016/s0198-8859(99)00179-2 · Cited by 22
Hanák, L., Slabý, O., Lauerová, L., Křen, L., Nenutil, R., & Michálek, J. (2009) · PubMed · Cited by 22
Tao, J., Li, Y., Liu, Y.-Q., Li, L., Liu, J., Shen, X., Shen, G.-X., & Tu, Y.-T. (2007) · British Journal of Dermatology · doi:10.1111/j.1365-2133.2007.08294.x · Cited by 21
Survivin and HLA-I expression predicts survival of patients with clear cell renal cell carcinoma
Liu, S., Qi, L., Yu, Q., Song, Y., Han, W., Zu, X., Jiang, S., Yuan, J., Zeng, F., & Xie, Y. (2014) · Tumor Biology · doi:10.1007/s13277-014-2058-y · Cited by 21
Shen, T., Chen, Z., Zhao, Z. J., & Wu, J. (2017) · Oncotarget · doi:10.18632/oncotarget.17689 · Cited by 21
Na, H. Y., Park, Y., Nam, S. K., Lee, K. S., Oh, H., Kim, D., Kang, S., Kim, W. H., & Lee, H. S. (2020) · Cancer Science · doi:10.1111/cas.14723 · Cited by 21
The Role of HLA-Class Ib Molecules in Immune-Related Diseases, Tumors, and Infections 2016
Rizzo, R., Fainardi, E., Rouas‐Freiss, N., & Morandi, F. (2017) · Journal of Immunology Research · doi:10.1155/2017/2309574 · Cited by 20
Jiménez, P., Cantón, J., Concha, Á., Cabrera, T., Fernández, M., Real, L. M., Garcia-Lora, A. M., Serrano, A., Garrido, F., & Ruiz‐Cabello, F. (2000) · Cancer Immunology Immunotherapy · doi:10.1007/s002620050017 · Cited by 20
de Boer, M. A., Jordanova, E. S., van Poelgeest, M. I. E., van den Akker, B. E., van der Burg, S. H., Kenter, G. G., & Fleuren, G. J. (2007) · International Journal of Cancer · doi:10.1002/ijc.23035 · Cited by 19
Prognostic significance of HLA EMR8-5 immunohistochemically analyzed expression in osteosarcoma
Nada, O. H., Ahmed, N. S., & Gabal, H. H. A. (2014) · Diagnostic Pathology · doi:10.1186/1746-1596-9-72 · Cited by 19
Levin, I., Klein, T. L., Kuperman, O. J., Segal, S., Shapira, J., Gal, R., Hart, Y., & Klein, B. (1994) · PubMed · Cited by 19
Ichinokawa, K., Nakanishi, Y., Hida, Y., Tsuchikawa, T., Kato, T., Itoh, T., Kaji, M., Kaga, K., & Hirano, S. (2019) · Oncology Letters · doi:10.3892/ol.2019.10293 · Cited by 19
Vermeulen, C. F. W., Jordanova, E. S., ter Haar, N. T., Kolkman-Uljee, S. M., de Miranda, N. F. C. C., Ferrone, S., Peters, A. A. W., & Fleuren, G. J. (2007) · Gynecologic Oncology · doi:10.1016/j.ygyno.2007.02.016 · Cited by 18
Mink, S. R., Hodge, A., Agus, D. B., Jain, A., & Gross, M. E. (2010) · The Prostate · doi:10.1002/pros.21155 · Cited by 17
Hearn, A. R., York, I. A., Bishop, C., & Rock, K. L. (2010) · The Journal of Immunology · doi:10.4049/jimmunol.0903125 · Cited by 17
Self-citationSaio, M., Teicher, M., Campbell, G. A., Feiner, H. D., Delgado, Y., & Frey, A. B. (2004) · Clinical & Experimental Metastasis · doi:10.1023/b:clin.0000037707.07428.ff · Cited by 16
Research works printed but not linked: 1
- Lu, 2000, Decreased HLA-A expression in prostate cancer is associated with normal allele dosage in the majority of cases, J Pathol, 190, 169, 10.1002/(SICI)1096-9896(200002)190:2169::AID-PATH517>3.0.CO;2-# · DOI
Cited by
Sorted by citations
Toward personalized treatment approaches for non-small-cell lung cancer
Wang, M., Herbst, R. S., & Boshoff, C. (2021) · Nature Medicine · doi:10.1038/s41591-021-01450-2 · Cited by 1,127
A guide to antigen processing and presentation
Pishesha, N., Harmand, T. J., & Ploegh, H. L. (2022) · Nature Reviews Immunology · doi:10.1038/s41577-022-00707-2 · Cited by 805
Vivier, É., Rebuffet, L., Narni-Mancinelli, É., Cornen, S., Igarashi, R., & Fantin, V. R. (2024) · Nature · doi:10.1038/s41586-023-06945-1 · Cited by 496
The Evasion Mechanisms of Cancer Immunity and Drug Intervention in the Tumor Microenvironment
Kim, S. K., & Cho, S. W. (2022) · Frontiers in Pharmacology · doi:10.3389/fphar.2022.868695 · Cited by 502
A pan-cancer single-cell panorama of human natural killer cells
Tang, F., Li, J., Qi, L., Liu, D., Bo, Y., Qin, S., Miao, Y., Yu, K., Hou, W., Li, J., et al. (2023) · Cell · doi:10.1016/j.cell.2023.07.034 · Cited by 450
“Compared with CD8 T cells, NK cells serve as alternative sources of cytotoxic activities and combat tumor cells with low mutation load and aberrant expression of major histocompatibility complex (MHC) class I.(22,23) Although the dysfunctional state of CD8 T cells is well-characterized with reduced cytotoxicity”
Background
Metadata
- Authors
- Dhatchinamoorthy, K., Colbert, J. D., & Rock, K. L.
- Affiliations
- University of Massachusetts Chan Medical School (US)
- Corresponding author
- Rock, Kenneth L.
- Venue
- Frontiers in Immunology
- Publisher
- Frontiers Media SA
- Published
- 2021-03-09
- Volume
- 12
- Pages
- 636568-636568
- ISSN
- 1664-3224 (ISSN-L)
- PMC
- PMC7986854
- OpenAlex
- W3134746059
- Cited by
- 1,077
- References
- 429
- Citations by year
- 2026: 209 · 2025: 244 · 2024: 251 · 2023: 202 · 2022: 138 · 2021: 33
- FWCI
- 19.72
- Type
- journal article
- Language
- en
- Open access
- gold
- doi.org
- Licence
- Locations
- Frontiers in Immunology (publishedVersion, cc-by)
- PubMed Central (publishedVersion, cc-by)
- PubMed (publishedVersion)
- eScholarship@UMassChan (submittedVersion, cc-by)
- DOAJ (DOAJ: Directory of Open Access Journals) (submittedVersion, cc-by-sa)
- Funders
- National Cancer Institute (R01CA247624)
- National Institute of Allergy and Infectious Diseases (R01AI145932)
- Topics
- Health Sciences › Medicine › Oncology › Cancer Immunotherapy and Biomarkers
- Life Sciences › Immunology and Microbiology › Immunology › Immunotherapy and Immune Responses
- Life Sciences › Immunology and Microbiology › Immunology › T-cell and B-cell Immunology
- Keywords
- tumor immune evasion, MHC class I antigen presentation, MHC class I loss, CD8+ T cells, cancer immunotherapy, immune checkpoint blockade, tumor antigens
- MeSH terms
- Animals, Humans, Killer Cells, Natural, Mutation, Neoplasms, Transcription, Genetic, Histocompatibility Antigens Class I, Signal Transduction, Gene Expression Regulation, Neoplastic, Lymphocytes, Tumor-Infiltrating, Gene Deletion, Antigen Presentation, Tumor Escape, Tumor Microenvironment
About these checks
Registry, retraction, Cites and statistics results are computed, not judged, with one exception: a printed reference that no index lists is read once by a model before it counts as a citation error. Claims are extracted by a model and kept only when their quote appears verbatim in the text; each cited source is then checked, with a model’s help, for whether it says what the claim relies on. Those verdicts can be wrong — read the claim’s quote and the cited source before relying on one.
Statistics and arithmetic are recomputed, not judged.
Confidence bands are shown only for fields calibrated on our annotated test set. None is calibrated yet, so no band is shown.
What counts as a claim ›How we measure confidence ›How we check this ›
Are you an author, or do you see a problem with this page? Request a review
